

Key Insights
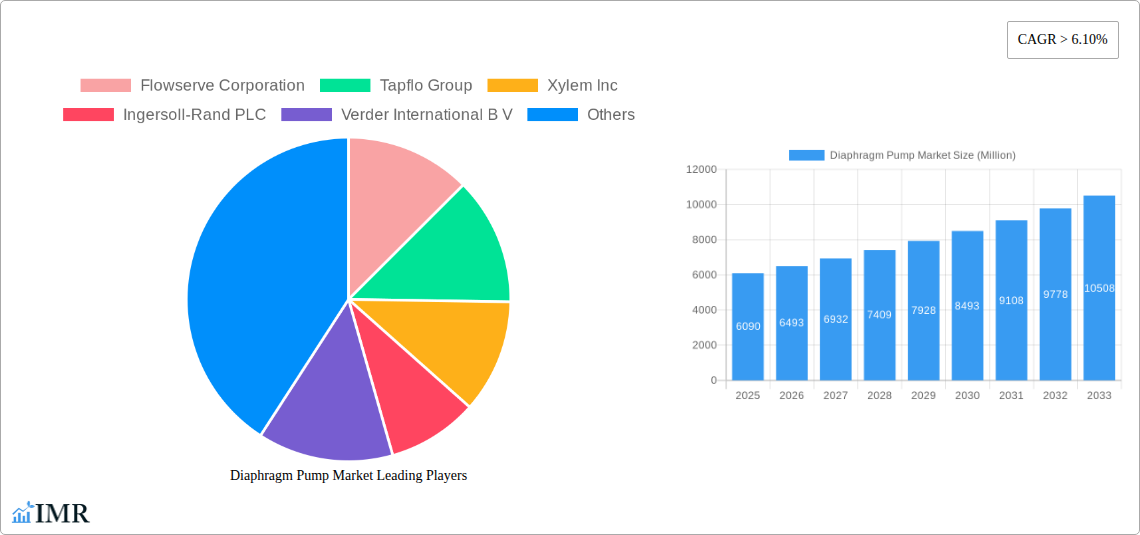
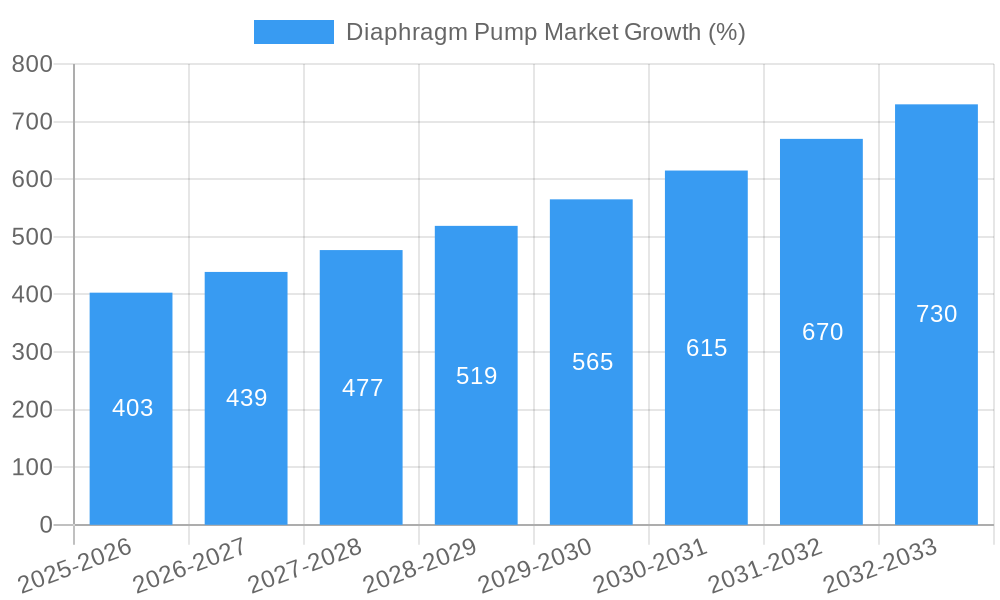
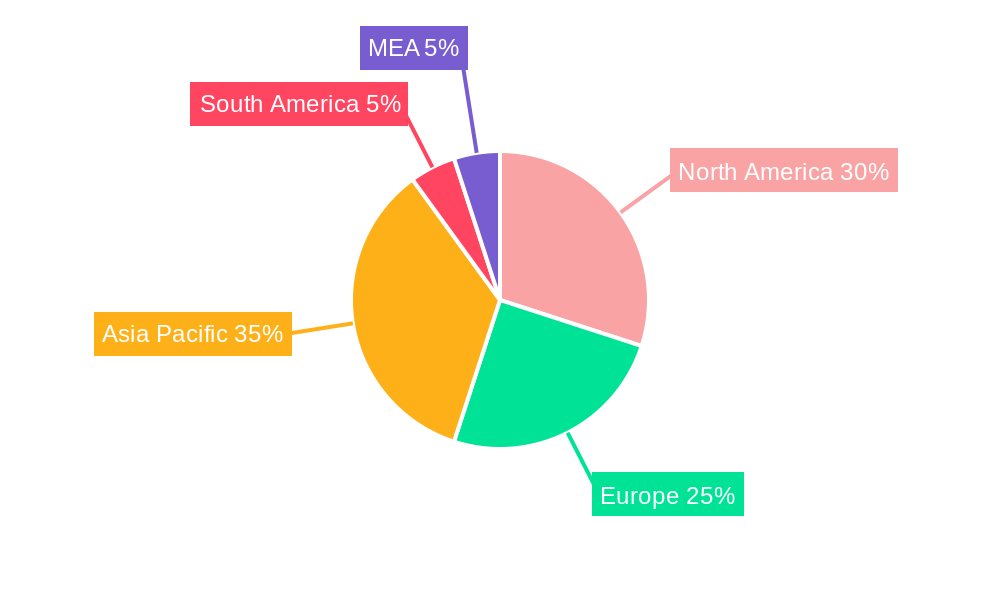
The global diaphragm pump market, valued at $6.09 billion in 2025, is projected to experience robust growth, driven by a compound annual growth rate (CAGR) exceeding 6.10% from 2025 to 2033. This expansion is fueled by several key factors. Increasing demand across diverse end-user industries, including water and wastewater treatment, oil and gas extraction, chemical processing, pharmaceuticals, and food and beverage production, is a significant driver. The inherent advantages of diaphragm pumps—such as their ability to handle viscous, abrasive, and corrosive fluids—make them indispensable in these sectors. Furthermore, ongoing technological advancements leading to improved efficiency, durability, and automation are contributing to market growth. The shift towards sustainable and environmentally friendly solutions is also bolstering adoption, with manufacturers focusing on energy-efficient designs and reduced environmental impact. Market segmentation by mechanism (air-operated and electrically operated) and discharge pressure (categorized as up to 80 bar, 80-200 bar, and above 200 bar) reflects the diverse application requirements and technological capabilities within the industry. The geographical distribution of market share is expected to show strong growth in the Asia-Pacific region, driven by industrialization and infrastructure development in emerging economies like China and India, while North America and Europe maintain significant market presence due to established industrial bases and stringent environmental regulations.
The competitive landscape is characterized by a mix of established players like Flowserve Corporation, Xylem Inc, and Graco Inc., alongside other significant contributors. These companies are strategically focusing on product innovation, mergers and acquisitions, and expanding their global footprint to strengthen their market positions. However, factors like fluctuating raw material prices and stringent regulatory compliance requirements could pose challenges to market growth. Despite these potential restraints, the overall outlook for the diaphragm pump market remains positive, with continuous growth projected throughout the forecast period, fueled by the sustained demand across various industries and ongoing technological developments. The market's maturity and segmentation allow for targeted growth strategies and significant opportunities for both established and new market entrants.
Diaphragm Pump Market: A Comprehensive Report (2019-2033)
This in-depth report provides a comprehensive analysis of the global Diaphragm Pump market, encompassing market dynamics, growth trends, regional segmentation, product landscape, key players, and future outlook. The study period spans from 2019 to 2033, with 2025 serving as the base and estimated year. The report is designed for industry professionals, investors, and anyone seeking a detailed understanding of this vital industrial sector. Market values are presented in million units.
Diaphragm Pump Market Dynamics & Structure
The global diaphragm pump market is characterized by moderate concentration, with several key players holding significant market share. Technological advancements, particularly in electric operation and higher discharge pressures, are driving market expansion. Stringent environmental regulations and the need for efficient fluid handling are shaping market trends. The market faces competition from alternative pumping technologies, necessitating continuous innovation. M&A activity remains significant, with larger players consolidating their presence through acquisitions.
- Market Concentration: Moderately concentrated, with top 10 players holding xx% market share (2024).
- Technological Innovation: Focus on energy efficiency, smart pump technologies, and improved material durability.
- Regulatory Landscape: Stringent emission and safety regulations, particularly in chemical and petrochemical sectors.
- Competitive Substitutes: Centrifugal pumps, peristaltic pumps, and positive displacement pumps pose competitive challenges.
- End-User Demographics: Diverse end-user segments, including water & wastewater, oil & gas, chemical, pharmaceutical, and food & beverage industries.
- M&A Activity: xx major M&A deals recorded between 2019 and 2024, indicating a trend of consolidation.
Diaphragm Pump Market Growth Trends & Insights
The global diaphragm pump market exhibited a CAGR of xx% during the historical period (2019-2024) and is projected to maintain a CAGR of xx% during the forecast period (2025-2033). This growth is attributed to rising demand from key end-user sectors, particularly the expansion of water and wastewater treatment facilities and increasing oil & gas exploration activities. Technological advancements, such as the development of energy-efficient electric diaphragm pumps and pumps capable of handling highly corrosive fluids, are further boosting market adoption. Shifting consumer preferences towards eco-friendly and sustainable solutions are also playing a role. Market penetration within emerging economies presents a significant opportunity for growth. The increasing adoption of automation and remote monitoring capabilities for industrial processes is impacting market trends.
Dominant Regions, Countries, or Segments in Diaphragm Pump Market
North America currently holds the largest market share in the diaphragm pump market, followed by Europe and Asia-Pacific. The high adoption rate of advanced technologies and robust infrastructure in these regions contributes to their dominance. Within the segments, the air-operated diaphragm pump segment holds a larger market share compared to the electrically operated segment, but the electrically operated segment is experiencing faster growth. High discharge pressure pumps (above 200 bar) are witnessing higher growth driven by specialized applications. The water and wastewater industry remains the largest end-user segment, followed by the oil & gas and chemical sectors.
- Key Regional Drivers: Strong industrial base, robust infrastructure, and favorable government policies.
- Leading Segments: Air-operated pumps, up to 80 bar discharge pressure, and water & wastewater end-user segment.
- Growth Potential: Emerging economies in Asia-Pacific and the Middle East present high growth opportunities.
Diaphragm Pump Market Product Landscape
Diaphragm pumps are available in a wide range of designs, materials, and configurations to suit diverse applications. Recent product innovations focus on enhancing energy efficiency, increasing flow rates, improving durability, and expanding operational capabilities for various fluids. Manufacturers are emphasizing the development of pumps capable of handling hazardous materials and operating under harsh conditions. Key improvements include smart connectivity, remote monitoring and predictive maintenance capabilities.
Key Drivers, Barriers & Challenges in Diaphragm Pump Market
Key Drivers:
- Increasing industrialization and urbanization.
- Growing demand for efficient and reliable fluid handling solutions.
- Advancements in pump design and materials.
- Stringent environmental regulations promoting efficient pump technologies.
Key Challenges:
- High initial investment costs for advanced pumps.
- Fluctuations in raw material prices.
- Intense competition from alternative pumping technologies (market share impact: xx%).
- Supply chain disruptions due to geopolitical factors.
Emerging Opportunities in Diaphragm Pump Market
- Expansion into untapped markets in developing economies.
- Development of pumps for specialized applications (e.g., biopharmaceuticals).
- Integration of advanced technologies such as IoT and AI for improved efficiency and monitoring.
- Focus on sustainable and eco-friendly pump designs.
Growth Accelerators in the Diaphragm Pump Market Industry
Technological advancements are key growth drivers, particularly in materials science, enabling the development of pumps capable of handling increasingly aggressive fluids. Strategic partnerships and collaborations are facilitating the development of innovative pump technologies. The expansion of industrial applications in emerging markets is driving significant market growth.
Key Players Shaping the Diaphragm Pump Market Market
- Flowserve Corporation
- Tapflo Group
- Xylem Inc
- Ingersoll-Rand PLC
- Verder International B.V.
- Graco Inc
- LEWA Group
- Idex Corporation
- Dover Corporation
- SPX FLOW Inc
- Yamada Corporation
- Grundfos AS
Notable Milestones in Diaphragm Pump Sector
- August 2021: Graco Inc. launched the Husky 3300e electric double diaphragm pump, offering high-volume fluid transfer and reduced power consumption.
- April 2020: Dover Corporation's Quattroflow introduced the QF2500 Quaternary Diaphragm Pump, ideal for biopharma applications.
In-Depth Diaphragm Pump Market Outlook
The diaphragm pump market is poised for continued growth, driven by ongoing technological advancements, increasing industrial demand, and expansion into new markets. Strategic investments in R&D, coupled with strategic partnerships and acquisitions, will further shape market dynamics. The market presents significant opportunities for manufacturers who can adapt to evolving industry needs and deliver innovative, sustainable, and cost-effective solutions.
Diaphragm Pump Market Segmentation
-
1. Mechanism
- 1.1. Air Operated
- 1.2. Electrically Operated
-
2. Discharge Pressure
- 2.1. Up to 80 bar
- 2.2. Between 80 to 200 bar
- 2.3. Above 200 bar
-
3. End-User
- 3.1. Water and Wastewater
- 3.2. Oil and Gas
- 3.3. Chemical and Petrochemical
- 3.4. Pharmaceutical
- 3.5. Food and Beverage
- 3.6. Other End-Users
Diaphragm Pump Market Segmentation By Geography
- 1. North America
- 2. Europe
- 3. Asia Pacific
- 4. South America
- 5. Middle East and Africa
Diaphragm Pump Market REPORT HIGHLIGHTS
| Aspects | Details |
|---|---|
| Study Period | 2019-2033 |
| Base Year | 2024 |
| Estimated Year | 2025 |
| Forecast Period | 2025-2033 |
| Historical Period | 2019-2024 |
| Growth Rate | CAGR of > 6.10% from 2019-2033 |
| Segmentation |
|
Table of Contents
- 1. Introduction
- 1.1. Research Scope
- 1.2. Market Segmentation
- 1.3. Research Methodology
- 1.4. Definitions and Assumptions
- 2. Executive Summary
- 2.1. Introduction
- 3. Market Dynamics
- 3.1. Introduction
- 3.2. Market Drivers
- 3.2.1. 4.; Declining Costs of Solar Technologies4.; Demand for Decentralized Solar Energy Systems
- 3.3. Market Restrains
- 3.3.1. 4.; Absence of Any New Initiatives in the Country
- 3.4. Market Trends
- 3.4.1. Water and Wastewater Sector to Dominate the Market
- 4. Market Factor Analysis
- 4.1. Porters Five Forces
- 4.2. Supply/Value Chain
- 4.3. PESTEL analysis
- 4.4. Market Entropy
- 4.5. Patent/Trademark Analysis
- 5. Global Diaphragm Pump Market Analysis, Insights and Forecast, 2019-2031
- 5.1. Market Analysis, Insights and Forecast - by Mechanism
- 5.1.1. Air Operated
- 5.1.2. Electrically Operated
- 5.2. Market Analysis, Insights and Forecast - by Discharge Pressure
- 5.2.1. Up to 80 bar
- 5.2.2. Between 80 to 200 bar
- 5.2.3. Above 200 bar
- 5.3. Market Analysis, Insights and Forecast - by End-User
- 5.3.1. Water and Wastewater
- 5.3.2. Oil and Gas
- 5.3.3. Chemical and Petrochemical
- 5.3.4. Pharmaceutical
- 5.3.5. Food and Beverage
- 5.3.6. Other End-Users
- 5.4. Market Analysis, Insights and Forecast - by Region
- 5.4.1. North America
- 5.4.2. Europe
- 5.4.3. Asia Pacific
- 5.4.4. South America
- 5.4.5. Middle East and Africa
- 5.1. Market Analysis, Insights and Forecast - by Mechanism
- 6. North America Diaphragm Pump Market Analysis, Insights and Forecast, 2019-2031
- 6.1. Market Analysis, Insights and Forecast - by Mechanism
- 6.1.1. Air Operated
- 6.1.2. Electrically Operated
- 6.2. Market Analysis, Insights and Forecast - by Discharge Pressure
- 6.2.1. Up to 80 bar
- 6.2.2. Between 80 to 200 bar
- 6.2.3. Above 200 bar
- 6.3. Market Analysis, Insights and Forecast - by End-User
- 6.3.1. Water and Wastewater
- 6.3.2. Oil and Gas
- 6.3.3. Chemical and Petrochemical
- 6.3.4. Pharmaceutical
- 6.3.5. Food and Beverage
- 6.3.6. Other End-Users
- 6.1. Market Analysis, Insights and Forecast - by Mechanism
- 7. Europe Diaphragm Pump Market Analysis, Insights and Forecast, 2019-2031
- 7.1. Market Analysis, Insights and Forecast - by Mechanism
- 7.1.1. Air Operated
- 7.1.2. Electrically Operated
- 7.2. Market Analysis, Insights and Forecast - by Discharge Pressure
- 7.2.1. Up to 80 bar
- 7.2.2. Between 80 to 200 bar
- 7.2.3. Above 200 bar
- 7.3. Market Analysis, Insights and Forecast - by End-User
- 7.3.1. Water and Wastewater
- 7.3.2. Oil and Gas
- 7.3.3. Chemical and Petrochemical
- 7.3.4. Pharmaceutical
- 7.3.5. Food and Beverage
- 7.3.6. Other End-Users
- 7.1. Market Analysis, Insights and Forecast - by Mechanism
- 8. Asia Pacific Diaphragm Pump Market Analysis, Insights and Forecast, 2019-2031
- 8.1. Market Analysis, Insights and Forecast - by Mechanism
- 8.1.1. Air Operated
- 8.1.2. Electrically Operated
- 8.2. Market Analysis, Insights and Forecast - by Discharge Pressure
- 8.2.1. Up to 80 bar
- 8.2.2. Between 80 to 200 bar
- 8.2.3. Above 200 bar
- 8.3. Market Analysis, Insights and Forecast - by End-User
- 8.3.1. Water and Wastewater
- 8.3.2. Oil and Gas
- 8.3.3. Chemical and Petrochemical
- 8.3.4. Pharmaceutical
- 8.3.5. Food and Beverage
- 8.3.6. Other End-Users
- 8.1. Market Analysis, Insights and Forecast - by Mechanism
- 9. South America Diaphragm Pump Market Analysis, Insights and Forecast, 2019-2031
- 9.1. Market Analysis, Insights and Forecast - by Mechanism
- 9.1.1. Air Operated
- 9.1.2. Electrically Operated
- 9.2. Market Analysis, Insights and Forecast - by Discharge Pressure
- 9.2.1. Up to 80 bar
- 9.2.2. Between 80 to 200 bar
- 9.2.3. Above 200 bar
- 9.3. Market Analysis, Insights and Forecast - by End-User
- 9.3.1. Water and Wastewater
- 9.3.2. Oil and Gas
- 9.3.3. Chemical and Petrochemical
- 9.3.4. Pharmaceutical
- 9.3.5. Food and Beverage
- 9.3.6. Other End-Users
- 9.1. Market Analysis, Insights and Forecast - by Mechanism
- 10. Middle East and Africa Diaphragm Pump Market Analysis, Insights and Forecast, 2019-2031
- 10.1. Market Analysis, Insights and Forecast - by Mechanism
- 10.1.1. Air Operated
- 10.1.2. Electrically Operated
- 10.2. Market Analysis, Insights and Forecast - by Discharge Pressure
- 10.2.1. Up to 80 bar
- 10.2.2. Between 80 to 200 bar
- 10.2.3. Above 200 bar
- 10.3. Market Analysis, Insights and Forecast - by End-User
- 10.3.1. Water and Wastewater
- 10.3.2. Oil and Gas
- 10.3.3. Chemical and Petrochemical
- 10.3.4. Pharmaceutical
- 10.3.5. Food and Beverage
- 10.3.6. Other End-Users
- 10.1. Market Analysis, Insights and Forecast - by Mechanism
- 11. North America Diaphragm Pump Market Analysis, Insights and Forecast, 2019-2031
- 11.1. Market Analysis, Insights and Forecast - By Country/Sub-region
- 11.1.1 United States
- 11.1.2 Canada
- 11.1.3 Mexico
- 12. Europe Diaphragm Pump Market Analysis, Insights and Forecast, 2019-2031
- 12.1. Market Analysis, Insights and Forecast - By Country/Sub-region
- 12.1.1 Germany
- 12.1.2 United Kingdom
- 12.1.3 France
- 12.1.4 Spain
- 12.1.5 Italy
- 12.1.6 Spain
- 12.1.7 Belgium
- 12.1.8 Netherland
- 12.1.9 Nordics
- 12.1.10 Rest of Europe
- 13. Asia Pacific Diaphragm Pump Market Analysis, Insights and Forecast, 2019-2031
- 13.1. Market Analysis, Insights and Forecast - By Country/Sub-region
- 13.1.1 China
- 13.1.2 Japan
- 13.1.3 India
- 13.1.4 South Korea
- 13.1.5 Southeast Asia
- 13.1.6 Australia
- 13.1.7 Indonesia
- 13.1.8 Phillipes
- 13.1.9 Singapore
- 13.1.10 Thailandc
- 13.1.11 Rest of Asia Pacific
- 14. South America Diaphragm Pump Market Analysis, Insights and Forecast, 2019-2031
- 14.1. Market Analysis, Insights and Forecast - By Country/Sub-region
- 14.1.1 Brazil
- 14.1.2 Argentina
- 14.1.3 Peru
- 14.1.4 Chile
- 14.1.5 Colombia
- 14.1.6 Ecuador
- 14.1.7 Venezuela
- 14.1.8 Rest of South America
- 15. North America Diaphragm Pump Market Analysis, Insights and Forecast, 2019-2031
- 15.1. Market Analysis, Insights and Forecast - By Country/Sub-region
- 15.1.1 United States
- 15.1.2 Canada
- 15.1.3 Mexico
- 16. MEA Diaphragm Pump Market Analysis, Insights and Forecast, 2019-2031
- 16.1. Market Analysis, Insights and Forecast - By Country/Sub-region
- 16.1.1 United Arab Emirates
- 16.1.2 Saudi Arabia
- 16.1.3 South Africa
- 16.1.4 Rest of Middle East and Africa
- 17. Competitive Analysis
- 17.1. Global Market Share Analysis 2024
- 17.2. Company Profiles
- 17.2.1 Flowserve Corporation
- 17.2.1.1. Overview
- 17.2.1.2. Products
- 17.2.1.3. SWOT Analysis
- 17.2.1.4. Recent Developments
- 17.2.1.5. Financials (Based on Availability)
- 17.2.2 Tapflo Group
- 17.2.2.1. Overview
- 17.2.2.2. Products
- 17.2.2.3. SWOT Analysis
- 17.2.2.4. Recent Developments
- 17.2.2.5. Financials (Based on Availability)
- 17.2.3 Xylem Inc
- 17.2.3.1. Overview
- 17.2.3.2. Products
- 17.2.3.3. SWOT Analysis
- 17.2.3.4. Recent Developments
- 17.2.3.5. Financials (Based on Availability)
- 17.2.4 Ingersoll-Rand PLC
- 17.2.4.1. Overview
- 17.2.4.2. Products
- 17.2.4.3. SWOT Analysis
- 17.2.4.4. Recent Developments
- 17.2.4.5. Financials (Based on Availability)
- 17.2.5 Verder International B V
- 17.2.5.1. Overview
- 17.2.5.2. Products
- 17.2.5.3. SWOT Analysis
- 17.2.5.4. Recent Developments
- 17.2.5.5. Financials (Based on Availability)
- 17.2.6 Graco Inc
- 17.2.6.1. Overview
- 17.2.6.2. Products
- 17.2.6.3. SWOT Analysis
- 17.2.6.4. Recent Developments
- 17.2.6.5. Financials (Based on Availability)
- 17.2.7 LEWA Group*List Not Exhaustive
- 17.2.7.1. Overview
- 17.2.7.2. Products
- 17.2.7.3. SWOT Analysis
- 17.2.7.4. Recent Developments
- 17.2.7.5. Financials (Based on Availability)
- 17.2.8 Idex Corporation
- 17.2.8.1. Overview
- 17.2.8.2. Products
- 17.2.8.3. SWOT Analysis
- 17.2.8.4. Recent Developments
- 17.2.8.5. Financials (Based on Availability)
- 17.2.9 Dover Corporation
- 17.2.9.1. Overview
- 17.2.9.2. Products
- 17.2.9.3. SWOT Analysis
- 17.2.9.4. Recent Developments
- 17.2.9.5. Financials (Based on Availability)
- 17.2.10 SPX FLOW Inc
- 17.2.10.1. Overview
- 17.2.10.2. Products
- 17.2.10.3. SWOT Analysis
- 17.2.10.4. Recent Developments
- 17.2.10.5. Financials (Based on Availability)
- 17.2.11 Yamada Corporation
- 17.2.11.1. Overview
- 17.2.11.2. Products
- 17.2.11.3. SWOT Analysis
- 17.2.11.4. Recent Developments
- 17.2.11.5. Financials (Based on Availability)
- 17.2.12 Grundfos AS
- 17.2.12.1. Overview
- 17.2.12.2. Products
- 17.2.12.3. SWOT Analysis
- 17.2.12.4. Recent Developments
- 17.2.12.5. Financials (Based on Availability)
- 17.2.1 Flowserve Corporation
List of Figures
- Figure 1: Global Diaphragm Pump Market Revenue Breakdown (Million, %) by Region 2024 & 2032
- Figure 2: Global Diaphragm Pump Market Volume Breakdown (K Tons, %) by Region 2024 & 2032
- Figure 3: North America Diaphragm Pump Market Revenue (Million), by Country 2024 & 2032
- Figure 4: North America Diaphragm Pump Market Volume (K Tons), by Country 2024 & 2032
- Figure 5: North America Diaphragm Pump Market Revenue Share (%), by Country 2024 & 2032
- Figure 6: North America Diaphragm Pump Market Volume Share (%), by Country 2024 & 2032
- Figure 7: Europe Diaphragm Pump Market Revenue (Million), by Country 2024 & 2032
- Figure 8: Europe Diaphragm Pump Market Volume (K Tons), by Country 2024 & 2032
- Figure 9: Europe Diaphragm Pump Market Revenue Share (%), by Country 2024 & 2032
- Figure 10: Europe Diaphragm Pump Market Volume Share (%), by Country 2024 & 2032
- Figure 11: Asia Pacific Diaphragm Pump Market Revenue (Million), by Country 2024 & 2032
- Figure 12: Asia Pacific Diaphragm Pump Market Volume (K Tons), by Country 2024 & 2032
- Figure 13: Asia Pacific Diaphragm Pump Market Revenue Share (%), by Country 2024 & 2032
- Figure 14: Asia Pacific Diaphragm Pump Market Volume Share (%), by Country 2024 & 2032
- Figure 15: South America Diaphragm Pump Market Revenue (Million), by Country 2024 & 2032
- Figure 16: South America Diaphragm Pump Market Volume (K Tons), by Country 2024 & 2032
- Figure 17: South America Diaphragm Pump Market Revenue Share (%), by Country 2024 & 2032
- Figure 18: South America Diaphragm Pump Market Volume Share (%), by Country 2024 & 2032
- Figure 19: North America Diaphragm Pump Market Revenue (Million), by Country 2024 & 2032
- Figure 20: North America Diaphragm Pump Market Volume (K Tons), by Country 2024 & 2032
- Figure 21: North America Diaphragm Pump Market Revenue Share (%), by Country 2024 & 2032
- Figure 22: North America Diaphragm Pump Market Volume Share (%), by Country 2024 & 2032
- Figure 23: MEA Diaphragm Pump Market Revenue (Million), by Country 2024 & 2032
- Figure 24: MEA Diaphragm Pump Market Volume (K Tons), by Country 2024 & 2032
- Figure 25: MEA Diaphragm Pump Market Revenue Share (%), by Country 2024 & 2032
- Figure 26: MEA Diaphragm Pump Market Volume Share (%), by Country 2024 & 2032
- Figure 27: North America Diaphragm Pump Market Revenue (Million), by Mechanism 2024 & 2032
- Figure 28: North America Diaphragm Pump Market Volume (K Tons), by Mechanism 2024 & 2032
- Figure 29: North America Diaphragm Pump Market Revenue Share (%), by Mechanism 2024 & 2032
- Figure 30: North America Diaphragm Pump Market Volume Share (%), by Mechanism 2024 & 2032
- Figure 31: North America Diaphragm Pump Market Revenue (Million), by Discharge Pressure 2024 & 2032
- Figure 32: North America Diaphragm Pump Market Volume (K Tons), by Discharge Pressure 2024 & 2032
- Figure 33: North America Diaphragm Pump Market Revenue Share (%), by Discharge Pressure 2024 & 2032
- Figure 34: North America Diaphragm Pump Market Volume Share (%), by Discharge Pressure 2024 & 2032
- Figure 35: North America Diaphragm Pump Market Revenue (Million), by End-User 2024 & 2032
- Figure 36: North America Diaphragm Pump Market Volume (K Tons), by End-User 2024 & 2032
- Figure 37: North America Diaphragm Pump Market Revenue Share (%), by End-User 2024 & 2032
- Figure 38: North America Diaphragm Pump Market Volume Share (%), by End-User 2024 & 2032
- Figure 39: North America Diaphragm Pump Market Revenue (Million), by Country 2024 & 2032
- Figure 40: North America Diaphragm Pump Market Volume (K Tons), by Country 2024 & 2032
- Figure 41: North America Diaphragm Pump Market Revenue Share (%), by Country 2024 & 2032
- Figure 42: North America Diaphragm Pump Market Volume Share (%), by Country 2024 & 2032
- Figure 43: Europe Diaphragm Pump Market Revenue (Million), by Mechanism 2024 & 2032
- Figure 44: Europe Diaphragm Pump Market Volume (K Tons), by Mechanism 2024 & 2032
- Figure 45: Europe Diaphragm Pump Market Revenue Share (%), by Mechanism 2024 & 2032
- Figure 46: Europe Diaphragm Pump Market Volume Share (%), by Mechanism 2024 & 2032
- Figure 47: Europe Diaphragm Pump Market Revenue (Million), by Discharge Pressure 2024 & 2032
- Figure 48: Europe Diaphragm Pump Market Volume (K Tons), by Discharge Pressure 2024 & 2032
- Figure 49: Europe Diaphragm Pump Market Revenue Share (%), by Discharge Pressure 2024 & 2032
- Figure 50: Europe Diaphragm Pump Market Volume Share (%), by Discharge Pressure 2024 & 2032
- Figure 51: Europe Diaphragm Pump Market Revenue (Million), by End-User 2024 & 2032
- Figure 52: Europe Diaphragm Pump Market Volume (K Tons), by End-User 2024 & 2032
- Figure 53: Europe Diaphragm Pump Market Revenue Share (%), by End-User 2024 & 2032
- Figure 54: Europe Diaphragm Pump Market Volume Share (%), by End-User 2024 & 2032
- Figure 55: Europe Diaphragm Pump Market Revenue (Million), by Country 2024 & 2032
- Figure 56: Europe Diaphragm Pump Market Volume (K Tons), by Country 2024 & 2032
- Figure 57: Europe Diaphragm Pump Market Revenue Share (%), by Country 2024 & 2032
- Figure 58: Europe Diaphragm Pump Market Volume Share (%), by Country 2024 & 2032
- Figure 59: Asia Pacific Diaphragm Pump Market Revenue (Million), by Mechanism 2024 & 2032
- Figure 60: Asia Pacific Diaphragm Pump Market Volume (K Tons), by Mechanism 2024 & 2032
- Figure 61: Asia Pacific Diaphragm Pump Market Revenue Share (%), by Mechanism 2024 & 2032
- Figure 62: Asia Pacific Diaphragm Pump Market Volume Share (%), by Mechanism 2024 & 2032
- Figure 63: Asia Pacific Diaphragm Pump Market Revenue (Million), by Discharge Pressure 2024 & 2032
- Figure 64: Asia Pacific Diaphragm Pump Market Volume (K Tons), by Discharge Pressure 2024 & 2032
- Figure 65: Asia Pacific Diaphragm Pump Market Revenue Share (%), by Discharge Pressure 2024 & 2032
- Figure 66: Asia Pacific Diaphragm Pump Market Volume Share (%), by Discharge Pressure 2024 & 2032
- Figure 67: Asia Pacific Diaphragm Pump Market Revenue (Million), by End-User 2024 & 2032
- Figure 68: Asia Pacific Diaphragm Pump Market Volume (K Tons), by End-User 2024 & 2032
- Figure 69: Asia Pacific Diaphragm Pump Market Revenue Share (%), by End-User 2024 & 2032
- Figure 70: Asia Pacific Diaphragm Pump Market Volume Share (%), by End-User 2024 & 2032
- Figure 71: Asia Pacific Diaphragm Pump Market Revenue (Million), by Country 2024 & 2032
- Figure 72: Asia Pacific Diaphragm Pump Market Volume (K Tons), by Country 2024 & 2032
- Figure 73: Asia Pacific Diaphragm Pump Market Revenue Share (%), by Country 2024 & 2032
- Figure 74: Asia Pacific Diaphragm Pump Market Volume Share (%), by Country 2024 & 2032
- Figure 75: South America Diaphragm Pump Market Revenue (Million), by Mechanism 2024 & 2032
- Figure 76: South America Diaphragm Pump Market Volume (K Tons), by Mechanism 2024 & 2032
- Figure 77: South America Diaphragm Pump Market Revenue Share (%), by Mechanism 2024 & 2032
- Figure 78: South America Diaphragm Pump Market Volume Share (%), by Mechanism 2024 & 2032
- Figure 79: South America Diaphragm Pump Market Revenue (Million), by Discharge Pressure 2024 & 2032
- Figure 80: South America Diaphragm Pump Market Volume (K Tons), by Discharge Pressure 2024 & 2032
- Figure 81: South America Diaphragm Pump Market Revenue Share (%), by Discharge Pressure 2024 & 2032
- Figure 82: South America Diaphragm Pump Market Volume Share (%), by Discharge Pressure 2024 & 2032
- Figure 83: South America Diaphragm Pump Market Revenue (Million), by End-User 2024 & 2032
- Figure 84: South America Diaphragm Pump Market Volume (K Tons), by End-User 2024 & 2032
- Figure 85: South America Diaphragm Pump Market Revenue Share (%), by End-User 2024 & 2032
- Figure 86: South America Diaphragm Pump Market Volume Share (%), by End-User 2024 & 2032
- Figure 87: South America Diaphragm Pump Market Revenue (Million), by Country 2024 & 2032
- Figure 88: South America Diaphragm Pump Market Volume (K Tons), by Country 2024 & 2032
- Figure 89: South America Diaphragm Pump Market Revenue Share (%), by Country 2024 & 2032
- Figure 90: South America Diaphragm Pump Market Volume Share (%), by Country 2024 & 2032
- Figure 91: Middle East and Africa Diaphragm Pump Market Revenue (Million), by Mechanism 2024 & 2032
- Figure 92: Middle East and Africa Diaphragm Pump Market Volume (K Tons), by Mechanism 2024 & 2032
- Figure 93: Middle East and Africa Diaphragm Pump Market Revenue Share (%), by Mechanism 2024 & 2032
- Figure 94: Middle East and Africa Diaphragm Pump Market Volume Share (%), by Mechanism 2024 & 2032
- Figure 95: Middle East and Africa Diaphragm Pump Market Revenue (Million), by Discharge Pressure 2024 & 2032
- Figure 96: Middle East and Africa Diaphragm Pump Market Volume (K Tons), by Discharge Pressure 2024 & 2032
- Figure 97: Middle East and Africa Diaphragm Pump Market Revenue Share (%), by Discharge Pressure 2024 & 2032
- Figure 98: Middle East and Africa Diaphragm Pump Market Volume Share (%), by Discharge Pressure 2024 & 2032
- Figure 99: Middle East and Africa Diaphragm Pump Market Revenue (Million), by End-User 2024 & 2032
- Figure 100: Middle East and Africa Diaphragm Pump Market Volume (K Tons), by End-User 2024 & 2032
- Figure 101: Middle East and Africa Diaphragm Pump Market Revenue Share (%), by End-User 2024 & 2032
- Figure 102: Middle East and Africa Diaphragm Pump Market Volume Share (%), by End-User 2024 & 2032
- Figure 103: Middle East and Africa Diaphragm Pump Market Revenue (Million), by Country 2024 & 2032
- Figure 104: Middle East and Africa Diaphragm Pump Market Volume (K Tons), by Country 2024 & 2032
- Figure 105: Middle East and Africa Diaphragm Pump Market Revenue Share (%), by Country 2024 & 2032
- Figure 106: Middle East and Africa Diaphragm Pump Market Volume Share (%), by Country 2024 & 2032
List of Tables
- Table 1: Global Diaphragm Pump Market Revenue Million Forecast, by Region 2019 & 2032
- Table 2: Global Diaphragm Pump Market Volume K Tons Forecast, by Region 2019 & 2032
- Table 3: Global Diaphragm Pump Market Revenue Million Forecast, by Mechanism 2019 & 2032
- Table 4: Global Diaphragm Pump Market Volume K Tons Forecast, by Mechanism 2019 & 2032
- Table 5: Global Diaphragm Pump Market Revenue Million Forecast, by Discharge Pressure 2019 & 2032
- Table 6: Global Diaphragm Pump Market Volume K Tons Forecast, by Discharge Pressure 2019 & 2032
- Table 7: Global Diaphragm Pump Market Revenue Million Forecast, by End-User 2019 & 2032
- Table 8: Global Diaphragm Pump Market Volume K Tons Forecast, by End-User 2019 & 2032
- Table 9: Global Diaphragm Pump Market Revenue Million Forecast, by Region 2019 & 2032
- Table 10: Global Diaphragm Pump Market Volume K Tons Forecast, by Region 2019 & 2032
- Table 11: Global Diaphragm Pump Market Revenue Million Forecast, by Country 2019 & 2032
- Table 12: Global Diaphragm Pump Market Volume K Tons Forecast, by Country 2019 & 2032
- Table 13: United States Diaphragm Pump Market Revenue (Million) Forecast, by Application 2019 & 2032
- Table 14: United States Diaphragm Pump Market Volume (K Tons) Forecast, by Application 2019 & 2032
- Table 15: Canada Diaphragm Pump Market Revenue (Million) Forecast, by Application 2019 & 2032
- Table 16: Canada Diaphragm Pump Market Volume (K Tons) Forecast, by Application 2019 & 2032
- Table 17: Mexico Diaphragm Pump Market Revenue (Million) Forecast, by Application 2019 & 2032
- Table 18: Mexico Diaphragm Pump Market Volume (K Tons) Forecast, by Application 2019 & 2032
- Table 19: Global Diaphragm Pump Market Revenue Million Forecast, by Country 2019 & 2032
- Table 20: Global Diaphragm Pump Market Volume K Tons Forecast, by Country 2019 & 2032
- Table 21: Germany Diaphragm Pump Market Revenue (Million) Forecast, by Application 2019 & 2032
- Table 22: Germany Diaphragm Pump Market Volume (K Tons) Forecast, by Application 2019 & 2032
- Table 23: United Kingdom Diaphragm Pump Market Revenue (Million) Forecast, by Application 2019 & 2032
- Table 24: United Kingdom Diaphragm Pump Market Volume (K Tons) Forecast, by Application 2019 & 2032
- Table 25: France Diaphragm Pump Market Revenue (Million) Forecast, by Application 2019 & 2032
- Table 26: France Diaphragm Pump Market Volume (K Tons) Forecast, by Application 2019 & 2032
- Table 27: Spain Diaphragm Pump Market Revenue (Million) Forecast, by Application 2019 & 2032
- Table 28: Spain Diaphragm Pump Market Volume (K Tons) Forecast, by Application 2019 & 2032
- Table 29: Italy Diaphragm Pump Market Revenue (Million) Forecast, by Application 2019 & 2032
- Table 30: Italy Diaphragm Pump Market Volume (K Tons) Forecast, by Application 2019 & 2032
- Table 31: Spain Diaphragm Pump Market Revenue (Million) Forecast, by Application 2019 & 2032
- Table 32: Spain Diaphragm Pump Market Volume (K Tons) Forecast, by Application 2019 & 2032
- Table 33: Belgium Diaphragm Pump Market Revenue (Million) Forecast, by Application 2019 & 2032
- Table 34: Belgium Diaphragm Pump Market Volume (K Tons) Forecast, by Application 2019 & 2032
- Table 35: Netherland Diaphragm Pump Market Revenue (Million) Forecast, by Application 2019 & 2032
- Table 36: Netherland Diaphragm Pump Market Volume (K Tons) Forecast, by Application 2019 & 2032
- Table 37: Nordics Diaphragm Pump Market Revenue (Million) Forecast, by Application 2019 & 2032
- Table 38: Nordics Diaphragm Pump Market Volume (K Tons) Forecast, by Application 2019 & 2032
- Table 39: Rest of Europe Diaphragm Pump Market Revenue (Million) Forecast, by Application 2019 & 2032
- Table 40: Rest of Europe Diaphragm Pump Market Volume (K Tons) Forecast, by Application 2019 & 2032
- Table 41: Global Diaphragm Pump Market Revenue Million Forecast, by Country 2019 & 2032
- Table 42: Global Diaphragm Pump Market Volume K Tons Forecast, by Country 2019 & 2032
- Table 43: China Diaphragm Pump Market Revenue (Million) Forecast, by Application 2019 & 2032
- Table 44: China Diaphragm Pump Market Volume (K Tons) Forecast, by Application 2019 & 2032
- Table 45: Japan Diaphragm Pump Market Revenue (Million) Forecast, by Application 2019 & 2032
- Table 46: Japan Diaphragm Pump Market Volume (K Tons) Forecast, by Application 2019 & 2032
- Table 47: India Diaphragm Pump Market Revenue (Million) Forecast, by Application 2019 & 2032
- Table 48: India Diaphragm Pump Market Volume (K Tons) Forecast, by Application 2019 & 2032
- Table 49: South Korea Diaphragm Pump Market Revenue (Million) Forecast, by Application 2019 & 2032
- Table 50: South Korea Diaphragm Pump Market Volume (K Tons) Forecast, by Application 2019 & 2032
- Table 51: Southeast Asia Diaphragm Pump Market Revenue (Million) Forecast, by Application 2019 & 2032
- Table 52: Southeast Asia Diaphragm Pump Market Volume (K Tons) Forecast, by Application 2019 & 2032
- Table 53: Australia Diaphragm Pump Market Revenue (Million) Forecast, by Application 2019 & 2032
- Table 54: Australia Diaphragm Pump Market Volume (K Tons) Forecast, by Application 2019 & 2032
- Table 55: Indonesia Diaphragm Pump Market Revenue (Million) Forecast, by Application 2019 & 2032
- Table 56: Indonesia Diaphragm Pump Market Volume (K Tons) Forecast, by Application 2019 & 2032
- Table 57: Phillipes Diaphragm Pump Market Revenue (Million) Forecast, by Application 2019 & 2032
- Table 58: Phillipes Diaphragm Pump Market Volume (K Tons) Forecast, by Application 2019 & 2032
- Table 59: Singapore Diaphragm Pump Market Revenue (Million) Forecast, by Application 2019 & 2032
- Table 60: Singapore Diaphragm Pump Market Volume (K Tons) Forecast, by Application 2019 & 2032
- Table 61: Thailandc Diaphragm Pump Market Revenue (Million) Forecast, by Application 2019 & 2032
- Table 62: Thailandc Diaphragm Pump Market Volume (K Tons) Forecast, by Application 2019 & 2032
- Table 63: Rest of Asia Pacific Diaphragm Pump Market Revenue (Million) Forecast, by Application 2019 & 2032
- Table 64: Rest of Asia Pacific Diaphragm Pump Market Volume (K Tons) Forecast, by Application 2019 & 2032
- Table 65: Global Diaphragm Pump Market Revenue Million Forecast, by Country 2019 & 2032
- Table 66: Global Diaphragm Pump Market Volume K Tons Forecast, by Country 2019 & 2032
- Table 67: Brazil Diaphragm Pump Market Revenue (Million) Forecast, by Application 2019 & 2032
- Table 68: Brazil Diaphragm Pump Market Volume (K Tons) Forecast, by Application 2019 & 2032
- Table 69: Argentina Diaphragm Pump Market Revenue (Million) Forecast, by Application 2019 & 2032
- Table 70: Argentina Diaphragm Pump Market Volume (K Tons) Forecast, by Application 2019 & 2032
- Table 71: Peru Diaphragm Pump Market Revenue (Million) Forecast, by Application 2019 & 2032
- Table 72: Peru Diaphragm Pump Market Volume (K Tons) Forecast, by Application 2019 & 2032
- Table 73: Chile Diaphragm Pump Market Revenue (Million) Forecast, by Application 2019 & 2032
- Table 74: Chile Diaphragm Pump Market Volume (K Tons) Forecast, by Application 2019 & 2032
- Table 75: Colombia Diaphragm Pump Market Revenue (Million) Forecast, by Application 2019 & 2032
- Table 76: Colombia Diaphragm Pump Market Volume (K Tons) Forecast, by Application 2019 & 2032
- Table 77: Ecuador Diaphragm Pump Market Revenue (Million) Forecast, by Application 2019 & 2032
- Table 78: Ecuador Diaphragm Pump Market Volume (K Tons) Forecast, by Application 2019 & 2032
- Table 79: Venezuela Diaphragm Pump Market Revenue (Million) Forecast, by Application 2019 & 2032
- Table 80: Venezuela Diaphragm Pump Market Volume (K Tons) Forecast, by Application 2019 & 2032
- Table 81: Rest of South America Diaphragm Pump Market Revenue (Million) Forecast, by Application 2019 & 2032
- Table 82: Rest of South America Diaphragm Pump Market Volume (K Tons) Forecast, by Application 2019 & 2032
- Table 83: Global Diaphragm Pump Market Revenue Million Forecast, by Country 2019 & 2032
- Table 84: Global Diaphragm Pump Market Volume K Tons Forecast, by Country 2019 & 2032
- Table 85: United States Diaphragm Pump Market Revenue (Million) Forecast, by Application 2019 & 2032
- Table 86: United States Diaphragm Pump Market Volume (K Tons) Forecast, by Application 2019 & 2032
- Table 87: Canada Diaphragm Pump Market Revenue (Million) Forecast, by Application 2019 & 2032
- Table 88: Canada Diaphragm Pump Market Volume (K Tons) Forecast, by Application 2019 & 2032
- Table 89: Mexico Diaphragm Pump Market Revenue (Million) Forecast, by Application 2019 & 2032
- Table 90: Mexico Diaphragm Pump Market Volume (K Tons) Forecast, by Application 2019 & 2032
- Table 91: Global Diaphragm Pump Market Revenue Million Forecast, by Country 2019 & 2032
- Table 92: Global Diaphragm Pump Market Volume K Tons Forecast, by Country 2019 & 2032
- Table 93: United Arab Emirates Diaphragm Pump Market Revenue (Million) Forecast, by Application 2019 & 2032
- Table 94: United Arab Emirates Diaphragm Pump Market Volume (K Tons) Forecast, by Application 2019 & 2032
- Table 95: Saudi Arabia Diaphragm Pump Market Revenue (Million) Forecast, by Application 2019 & 2032
- Table 96: Saudi Arabia Diaphragm Pump Market Volume (K Tons) Forecast, by Application 2019 & 2032
- Table 97: South Africa Diaphragm Pump Market Revenue (Million) Forecast, by Application 2019 & 2032
- Table 98: South Africa Diaphragm Pump Market Volume (K Tons) Forecast, by Application 2019 & 2032
- Table 99: Rest of Middle East and Africa Diaphragm Pump Market Revenue (Million) Forecast, by Application 2019 & 2032
- Table 100: Rest of Middle East and Africa Diaphragm Pump Market Volume (K Tons) Forecast, by Application 2019 & 2032
- Table 101: Global Diaphragm Pump Market Revenue Million Forecast, by Mechanism 2019 & 2032
- Table 102: Global Diaphragm Pump Market Volume K Tons Forecast, by Mechanism 2019 & 2032
- Table 103: Global Diaphragm Pump Market Revenue Million Forecast, by Discharge Pressure 2019 & 2032
- Table 104: Global Diaphragm Pump Market Volume K Tons Forecast, by Discharge Pressure 2019 & 2032
- Table 105: Global Diaphragm Pump Market Revenue Million Forecast, by End-User 2019 & 2032
- Table 106: Global Diaphragm Pump Market Volume K Tons Forecast, by End-User 2019 & 2032
- Table 107: Global Diaphragm Pump Market Revenue Million Forecast, by Country 2019 & 2032
- Table 108: Global Diaphragm Pump Market Volume K Tons Forecast, by Country 2019 & 2032
- Table 109: Global Diaphragm Pump Market Revenue Million Forecast, by Mechanism 2019 & 2032
- Table 110: Global Diaphragm Pump Market Volume K Tons Forecast, by Mechanism 2019 & 2032
- Table 111: Global Diaphragm Pump Market Revenue Million Forecast, by Discharge Pressure 2019 & 2032
- Table 112: Global Diaphragm Pump Market Volume K Tons Forecast, by Discharge Pressure 2019 & 2032
- Table 113: Global Diaphragm Pump Market Revenue Million Forecast, by End-User 2019 & 2032
- Table 114: Global Diaphragm Pump Market Volume K Tons Forecast, by End-User 2019 & 2032
- Table 115: Global Diaphragm Pump Market Revenue Million Forecast, by Country 2019 & 2032
- Table 116: Global Diaphragm Pump Market Volume K Tons Forecast, by Country 2019 & 2032
- Table 117: Global Diaphragm Pump Market Revenue Million Forecast, by Mechanism 2019 & 2032
- Table 118: Global Diaphragm Pump Market Volume K Tons Forecast, by Mechanism 2019 & 2032
- Table 119: Global Diaphragm Pump Market Revenue Million Forecast, by Discharge Pressure 2019 & 2032
- Table 120: Global Diaphragm Pump Market Volume K Tons Forecast, by Discharge Pressure 2019 & 2032
- Table 121: Global Diaphragm Pump Market Revenue Million Forecast, by End-User 2019 & 2032
- Table 122: Global Diaphragm Pump Market Volume K Tons Forecast, by End-User 2019 & 2032
- Table 123: Global Diaphragm Pump Market Revenue Million Forecast, by Country 2019 & 2032
- Table 124: Global Diaphragm Pump Market Volume K Tons Forecast, by Country 2019 & 2032
- Table 125: Global Diaphragm Pump Market Revenue Million Forecast, by Mechanism 2019 & 2032
- Table 126: Global Diaphragm Pump Market Volume K Tons Forecast, by Mechanism 2019 & 2032
- Table 127: Global Diaphragm Pump Market Revenue Million Forecast, by Discharge Pressure 2019 & 2032
- Table 128: Global Diaphragm Pump Market Volume K Tons Forecast, by Discharge Pressure 2019 & 2032
- Table 129: Global Diaphragm Pump Market Revenue Million Forecast, by End-User 2019 & 2032
- Table 130: Global Diaphragm Pump Market Volume K Tons Forecast, by End-User 2019 & 2032
- Table 131: Global Diaphragm Pump Market Revenue Million Forecast, by Country 2019 & 2032
- Table 132: Global Diaphragm Pump Market Volume K Tons Forecast, by Country 2019 & 2032
- Table 133: Global Diaphragm Pump Market Revenue Million Forecast, by Mechanism 2019 & 2032
- Table 134: Global Diaphragm Pump Market Volume K Tons Forecast, by Mechanism 2019 & 2032
- Table 135: Global Diaphragm Pump Market Revenue Million Forecast, by Discharge Pressure 2019 & 2032
- Table 136: Global Diaphragm Pump Market Volume K Tons Forecast, by Discharge Pressure 2019 & 2032
- Table 137: Global Diaphragm Pump Market Revenue Million Forecast, by End-User 2019 & 2032
- Table 138: Global Diaphragm Pump Market Volume K Tons Forecast, by End-User 2019 & 2032
- Table 139: Global Diaphragm Pump Market Revenue Million Forecast, by Country 2019 & 2032
- Table 140: Global Diaphragm Pump Market Volume K Tons Forecast, by Country 2019 & 2032
Frequently Asked Questions
1. What is the projected Compound Annual Growth Rate (CAGR) of the Diaphragm Pump Market?
The projected CAGR is approximately > 6.10%.
2. Which companies are prominent players in the Diaphragm Pump Market?
Key companies in the market include Flowserve Corporation, Tapflo Group, Xylem Inc, Ingersoll-Rand PLC, Verder International B V, Graco Inc, LEWA Group*List Not Exhaustive, Idex Corporation, Dover Corporation, SPX FLOW Inc, Yamada Corporation, Grundfos AS.
3. What are the main segments of the Diaphragm Pump Market?
The market segments include Mechanism, Discharge Pressure, End-User.
4. Can you provide details about the market size?
The market size is estimated to be USD 6090 Million as of 2022.
5. What are some drivers contributing to market growth?
4.; Declining Costs of Solar Technologies4.; Demand for Decentralized Solar Energy Systems.
6. What are the notable trends driving market growth?
Water and Wastewater Sector to Dominate the Market.
7. Are there any restraints impacting market growth?
4.; Absence of Any New Initiatives in the Country.
8. Can you provide examples of recent developments in the market?
In August 2021, Graco Inc. announced the launch of its new Husky 3300e electric double diaphragm pump. The Husky 3300e pump transfers industrial fluids and offers plant managers high-volume fluid transfer (up 220 gpm) and drastically reduces power consumption.
9. What pricing options are available for accessing the report?
Pricing options include single-user, multi-user, and enterprise licenses priced at USD 4750, USD 5250, and USD 8750 respectively.
10. Is the market size provided in terms of value or volume?
The market size is provided in terms of value, measured in Million and volume, measured in K Tons.
11. Are there any specific market keywords associated with the report?
Yes, the market keyword associated with the report is "Diaphragm Pump Market," which aids in identifying and referencing the specific market segment covered.
12. How do I determine which pricing option suits my needs best?
The pricing options vary based on user requirements and access needs. Individual users may opt for single-user licenses, while businesses requiring broader access may choose multi-user or enterprise licenses for cost-effective access to the report.
13. Are there any additional resources or data provided in the Diaphragm Pump Market report?
While the report offers comprehensive insights, it's advisable to review the specific contents or supplementary materials provided to ascertain if additional resources or data are available.
14. How can I stay updated on further developments or reports in the Diaphragm Pump Market?
To stay informed about further developments, trends, and reports in the Diaphragm Pump Market, consider subscribing to industry newsletters, following relevant companies and organizations, or regularly checking reputable industry news sources and publications.
Methodology
Step 1 - Identification of Relevant Samples Size from Population Database


Step 2 - Approaches for Defining Global Market Size (Value, Volume* & Price*)

Note*: In applicable scenarios
Step 3 - Data Sources
Primary Research
- Web Analytics
- Survey Reports
- Research Institute
- Latest Research Reports
- Opinion Leaders
Secondary Research
- Annual Reports
- White Paper
- Latest Press Release
- Industry Association
- Paid Database
- Investor Presentations

Step 4 - Data Triangulation
Involves using different sources of information in order to increase the validity of a study
These sources are likely to be stakeholders in a program - participants, other researchers, program staff, other community members, and so on.
Then we put all data in single framework & apply various statistical tools to find out the dynamic on the market.
During the analysis stage, feedback from the stakeholder groups would be compared to determine areas of agreement as well as areas of divergence
