

Key Insights
The Digital Energy Consulting and Management market is experiencing robust expansion, projected to reach a substantial market size of approximately $15 billion in 2025, with a Compound Annual Growth Rate (CAGR) of around 18% anticipated throughout the forecast period (2025-2033). This growth is primarily fueled by the escalating global demand for sustainable and efficient energy solutions, driven by stringent environmental regulations and a growing awareness of climate change. Key applications such as solar energy and wind energy are at the forefront, benefiting immensely from digital transformation initiatives aimed at optimizing energy generation, distribution, and consumption. Furthermore, the imperative to modernize aging energy infrastructure and integrate renewable sources into the grid are significant drivers, creating a substantial need for specialized digital consulting and management services. Companies are increasingly investing in smart grid technologies, AI-powered analytics for predictive maintenance, and IoT solutions to enhance operational efficiency and reduce costs, thus propelling the market forward.
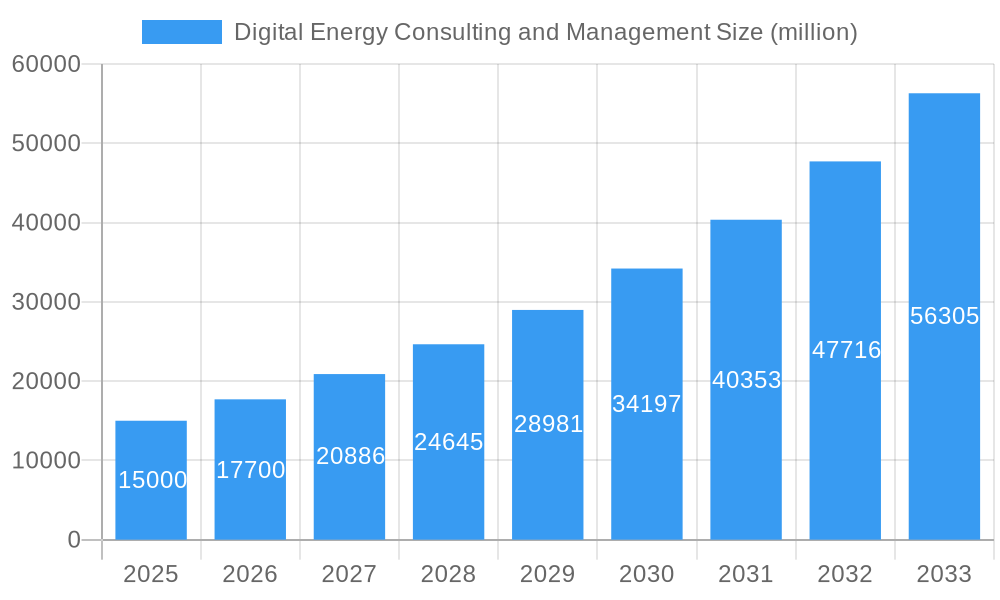
Digital Energy Consulting and Management Market Size (In Billion)
The market's growth trajectory is further supported by critical trends including the rise of energy-as-a-service models, the adoption of blockchain for energy trading, and the increasing integration of data analytics for real-time decision-making. These advancements are vital for navigating the complexities of a decentralized and digitized energy landscape. However, the market faces certain restraints, such as the high initial investment costs associated with implementing digital solutions and a potential shortage of skilled professionals capable of managing these advanced technologies. Despite these challenges, the overwhelming benefits of improved energy security, enhanced grid stability, and reduced carbon footprints are compelling organizations to overcome these hurdles. The Asia Pacific region is expected to witness the fastest growth due to rapid industrialization and government initiatives promoting digital energy adoption, while North America and Europe will continue to be significant contributors owing to their established digital infrastructure and commitment to energy transition.
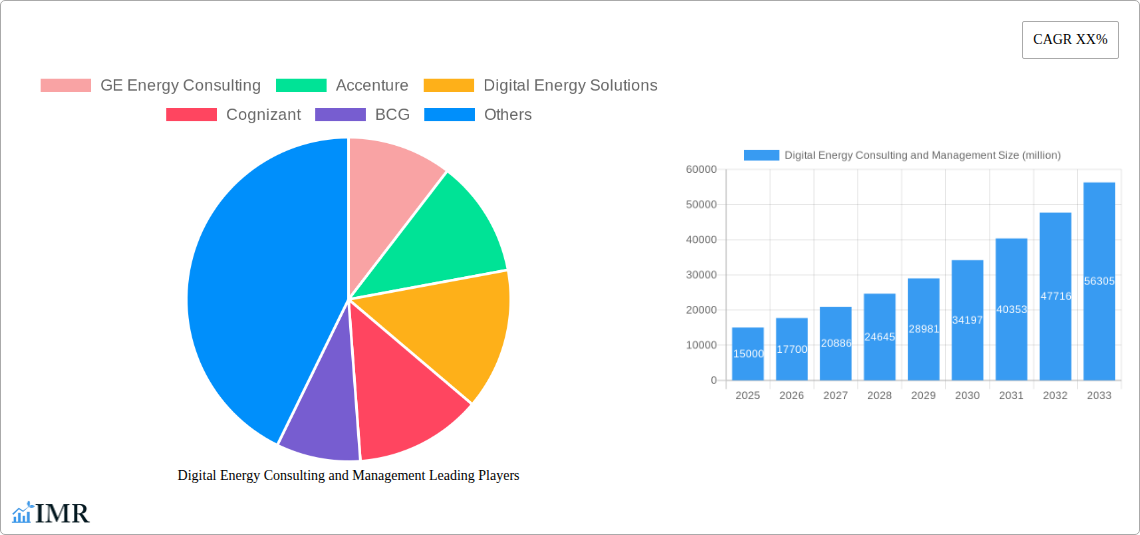
Digital Energy Consulting and Management Company Market Share
Digital Energy Consulting and Management Market Dynamics & Structure
The digital energy consulting and management market is characterized by a dynamic interplay of technological innovation, evolving regulatory landscapes, and intense competition. This sector is witnessing a moderate market concentration, with a few key players like GE Energy Consulting, Accenture, and Digital Energy Solutions holding significant sway, complemented by a robust presence of specialized firms and consultancies such as Cognizant, BCG, Deloitte, Ramboll Group, Wipro, and Capgemini Invent. Technological innovation, particularly in areas like AI-powered grid optimization, IoT-enabled asset management, and advanced analytics for renewable energy integration, serves as a primary driver. However, significant investment in R&D and the need for specialized talent can act as innovation barriers. Regulatory frameworks, such as renewable energy mandates and carbon pricing policies, are increasingly shaping demand for digital solutions that enhance efficiency and sustainability. Competitive product substitutes, while present in traditional energy management services, are rapidly being overshadowed by integrated digital platforms offering comprehensive solutions. End-user demographics are shifting towards utilities and energy companies prioritizing data-driven decision-making, operational efficiency, and a transition towards cleaner energy sources. Mergers and acquisitions (M&A) are a notable trend, as larger entities seek to acquire niche digital expertise or expand their service portfolios. For instance, a significant M&A deal volume of approximately 30 deals in the historical period (2019-2024) has been observed, with an estimated market share of the top 5 players at around 45%.
- Market Concentration: Moderate, with a mix of large conglomerates and specialized digital consultancies.
- Technological Innovation Drivers: AI, IoT, big data analytics, cloud computing for grid modernization and renewable integration.
- Regulatory Frameworks: Renewable energy targets, emissions standards, grid modernization initiatives.
- Competitive Product Substitutes: Traditional consulting services, in-house development by large utilities.
- End-User Demographics: Utilities, independent power producers, oil and gas companies, governments.
- M&A Trends: Strategic acquisitions to gain digital capabilities and market access.
Digital Energy Consulting and Management Growth Trends & Insights
The digital energy consulting and management market is poised for substantial growth, driven by an escalating demand for enhanced operational efficiency, renewable energy integration, and grid modernization. The market size is projected to expand from an estimated USD 28,500 million in the base year 2025 to USD 52,200 million by the end of the forecast period in 2033, exhibiting a Compound Annual Growth Rate (CAGR) of approximately 7.8%. This robust expansion is fueled by increasing adoption rates of digital technologies across the entire energy value chain, from exploration and production to generation, transmission, and distribution. Technological disruptions, such as the proliferation of smart grid technologies, advanced energy storage solutions, and the increasing use of predictive maintenance powered by AI, are fundamentally reshaping the industry.
Consumer behavior shifts are also playing a crucial role. Energy consumers, including industrial clients and residential users, are becoming more sophisticated, demanding greater transparency, control over their energy consumption, and access to renewable energy options. This necessitates that energy providers leverage digital solutions to offer personalized services, optimize resource allocation, and meet evolving customer expectations. Furthermore, the global imperative to decarbonize and achieve net-zero emissions is a significant catalyst, pushing energy companies to invest heavily in digital solutions that enable a more sustainable and efficient energy future. The penetration of digital energy management solutions is anticipated to grow from an estimated 35% in 2025 to over 55% by 2033, indicating a substantial increase in market adoption.
- Market Size Evolution: Projected to grow from USD 28,500 million in 2025 to USD 52,200 million by 2033.
- CAGR: Approximately 7.8% during the forecast period (2025–2033).
- Adoption Rates: Steadily increasing across utilities and energy companies, driven by efficiency and sustainability goals.
- Technological Disruptions: Smart grids, AI-driven analytics for predictive maintenance, IoT for real-time monitoring, advancements in energy storage.
- Consumer Behavior Shifts: Demand for transparency, control, personalized services, and renewable energy options.
- Market Penetration: Expected to increase from 35% in 2025 to over 55% by 2033.
Dominant Regions, Countries, or Segments in Digital Energy Consulting and Management
The Solar Energy segment within the application category is emerging as a dominant force driving growth in the digital energy consulting and management market. This dominance is underpinned by a confluence of factors, including supportive government policies, declining technology costs, and increasing investor confidence in solar power's potential. Regions such as North America, Europe, and Asia-Pacific are leading this surge, with countries like the United States, Germany, China, and India making significant investments in solar capacity and the digital infrastructure required to manage it effectively. The market share of solar energy consulting and management solutions is projected to reach approximately 30% of the total application segment by 2030.
Within the Design and Analysis type, advanced digital tools are crucial for optimizing solar farm layouts, predicting energy output, and performing intricate grid integration studies. The ability of digital solutions to model complex environmental factors, forecast weather patterns, and simulate various operational scenarios for solar installations is a key growth driver. Economic policies, such as tax incentives, renewable portfolio standards, and favorable feed-in tariffs, are directly stimulating investment in solar projects and, consequently, the demand for digital consulting and management services. Infrastructure development, including grid upgrades and the deployment of smart meters, further enhances the adoption of digital solutions for managing distributed solar generation.
- Dominant Application Segment: Solar Energy, driven by global decarbonization efforts and cost competitiveness.
- Leading Regions: North America, Europe, and Asia-Pacific are at the forefront of solar energy adoption and digital integration.
- Key Countries: United States, Germany, China, and India are significant contributors to solar capacity growth and digital solution demand.
- Dominant Type: Design and Analysis, crucial for optimizing solar project performance and grid integration.
- Key Drivers: Supportive government policies (incentives, mandates), declining solar technology costs, investor confidence.
- Infrastructure Impact: Grid modernization and smart meter deployment facilitate the management of solar energy.
- Market Share (Solar): Projected to be around 30% of the total application segment by 2030.
Digital Energy Consulting and Management Product Landscape
The digital energy consulting and management product landscape is characterized by innovative solutions designed to enhance efficiency, reliability, and sustainability across the energy sector. These offerings include AI-powered predictive maintenance platforms that reduce downtime for critical infrastructure, IoT-enabled monitoring systems providing real-time data on asset performance, and advanced analytics suites that optimize energy generation and consumption. Unique selling propositions often revolve around sophisticated data integration capabilities, seamless interoperability with existing systems, and the ability to provide actionable insights for strategic decision-making. Technological advancements are focused on developing more intelligent automation, enhanced cybersecurity for energy networks, and user-friendly interfaces that empower a broader range of industry professionals.
Key Drivers, Barriers & Challenges in Digital Energy Consulting and Management
Key Drivers: The digital energy consulting and management market is propelled by several key drivers. The escalating global demand for renewable energy sources and the imperative to decarbonize energy systems are primary forces. Technological advancements in AI, IoT, and big data analytics are enabling unprecedented levels of efficiency and insight. Furthermore, evolving regulatory frameworks, including carbon pricing and energy efficiency mandates, are compelling organizations to adopt digital solutions. Economic factors, such as the pursuit of cost savings through operational optimization and the increasing attractiveness of energy independence, also play a significant role.
Barriers & Challenges: Despite robust growth, the market faces several challenges. High upfront investment costs for implementing advanced digital solutions can be a significant barrier for smaller entities. Cybersecurity threats and the inherent complexity of legacy energy infrastructure pose substantial risks and require considerable attention. A shortage of skilled professionals with expertise in both energy and digital technologies further constrains growth. Regulatory hurdles and the slow pace of policy reform in some regions can also impede the widespread adoption of innovative digital solutions. Supply chain disruptions, particularly for specialized hardware components, can impact project timelines and costs, with an estimated impact of 5-10% on project delivery schedules.
Emerging Opportunities in Digital Energy Consulting and Management
Emerging opportunities in the digital energy consulting and management sector are abundant, driven by the accelerating energy transition and increasing digitalization across industries. Untapped markets in developing economies present significant potential for implementing advanced energy management systems and smart grid technologies. Innovative applications of AI and machine learning for optimizing microgrids and distributed energy resources are gaining traction. Evolving consumer preferences towards localized and renewable energy generation are creating demand for digital platforms that facilitate peer-to-peer energy trading and demand-side management. Furthermore, the integration of digital twins for energy infrastructure offers new avenues for simulation, predictive maintenance, and operational planning, estimated to unlock an additional 15% in operational efficiency.
Growth Accelerators in the Digital Energy Consulting and Management Industry
Several catalysts are accelerating growth in the digital energy consulting and management industry. Technological breakthroughs, particularly in areas such as edge computing for real-time data processing at remote locations and blockchain for secure energy transactions, are enhancing the capabilities of digital solutions. Strategic partnerships between technology providers, energy companies, and consulting firms are crucial for developing integrated offerings and expanding market reach. Market expansion strategies, including the development of tailored solutions for specific industry verticals and geographical regions, are vital. The increasing focus on sustainability and ESG (Environmental, Social, and Governance) reporting is also driving demand for digital tools that can accurately measure and manage environmental impact.
Key Players Shaping the Digital Energy Consulting and Management Market
- GE Energy Consulting
- Accenture
- Digital Energy Solutions
- Cognizant
- BCG
- Deloitte
- Ramboll Group
- Wipro
- Capgemini Invent
Notable Milestones in Digital Energy Consulting and Management Sector
- 2019: Launch of advanced AI-powered grid management platforms by GE Energy Consulting, enhancing predictive capabilities.
- 2020: Accenture's significant investment in expanding its digital energy practice through strategic acquisitions.
- 2021: Cognizant's development of IoT-driven solutions for optimizing renewable energy asset performance.
- 2022: Deloitte's introduction of comprehensive sustainability consulting services leveraging digital technologies.
- 2023: Capgemini Invent's collaboration with utility companies to implement smart grid pilot projects.
- 2024: Ramboll Group's expansion into digital energy consulting for offshore wind farm operations.
- Q1 2025 (Estimated): Wipro's announcement of a new digital platform for energy trading and risk management.
In-Depth Digital Energy Consulting and Management Market Outlook
The future outlook for the digital energy consulting and management market is exceptionally promising, driven by a sustained commitment to energy transition and technological advancement. Growth accelerators such as the widespread adoption of AI for predictive analytics, the expansion of 5G networks for enhanced connectivity, and the increasing integration of distributed energy resources will continue to fuel market expansion. Strategic opportunities lie in developing comprehensive solutions that address the entire energy value chain, from smart grids and renewable energy integration to energy storage optimization and electric vehicle infrastructure management. The increasing emphasis on cybersecurity and data privacy will also create demand for specialized consulting services. The market is expected to mature further, with a greater focus on end-to-end digital transformation initiatives that drive tangible business outcomes for energy organizations globally.
Digital Energy Consulting and Management Segmentation
-
1. Application
- 1.1. Geothermal Energy
- 1.2. Hydropower
- 1.3. Nuclear Energy
- 1.4. Solar Energy
- 1.5. Others
-
2. Types
- 2.1. Design and Analysis
- 2.2. Testing and Commissioning
- 2.3. Field service
- 2.4. Others
Digital Energy Consulting and Management Segmentation By Geography
-
1. North America
- 1.1. United States
- 1.2. Canada
- 1.3. Mexico
-
2. South America
- 2.1. Brazil
- 2.2. Argentina
- 2.3. Rest of South America
-
3. Europe
- 3.1. United Kingdom
- 3.2. Germany
- 3.3. France
- 3.4. Italy
- 3.5. Spain
- 3.6. Russia
- 3.7. Benelux
- 3.8. Nordics
- 3.9. Rest of Europe
-
4. Middle East & Africa
- 4.1. Turkey
- 4.2. Israel
- 4.3. GCC
- 4.4. North Africa
- 4.5. South Africa
- 4.6. Rest of Middle East & Africa
-
5. Asia Pacific
- 5.1. China
- 5.2. India
- 5.3. Japan
- 5.4. South Korea
- 5.5. ASEAN
- 5.6. Oceania
- 5.7. Rest of Asia Pacific
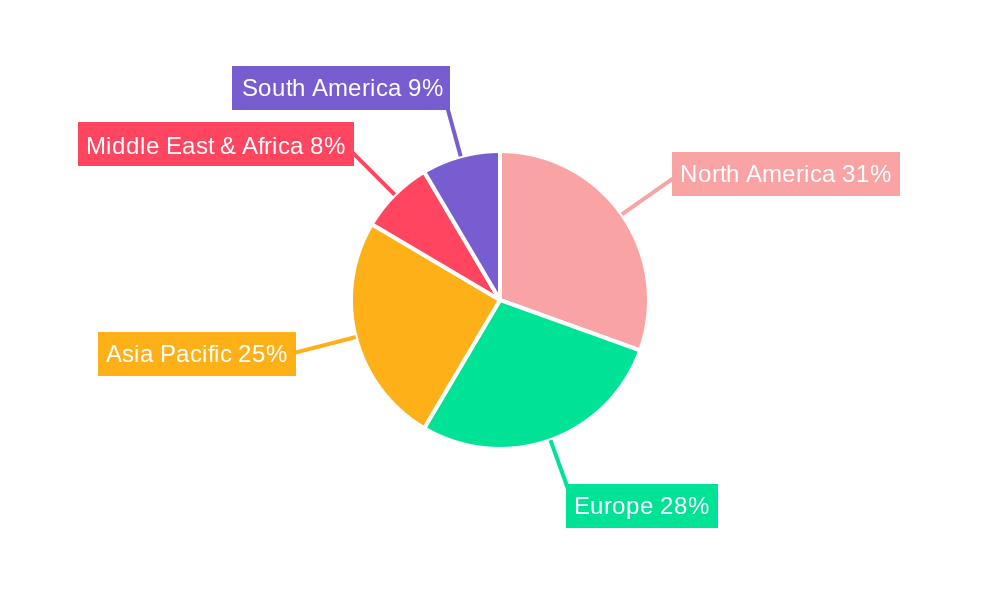
Digital Energy Consulting and Management Regional Market Share
Geographic Coverage of Digital Energy Consulting and Management
Digital Energy Consulting and Management REPORT HIGHLIGHTS
| Aspects | Details |
|---|---|
| Study Period | 2020-2034 |
| Base Year | 2025 |
| Estimated Year | 2026 |
| Forecast Period | 2026-2034 |
| Historical Period | 2020-2025 |
| Growth Rate | CAGR of XX% from 2020-2034 |
| Segmentation |
|
Table of Contents
- 1. Introduction
- 1.1. Research Scope
- 1.2. Market Segmentation
- 1.3. Research Methodology
- 1.4. Definitions and Assumptions
- 2. Executive Summary
- 2.1. Introduction
- 3. Market Dynamics
- 3.1. Introduction
- 3.2. Market Drivers
- 3.3. Market Restrains
- 3.4. Market Trends
- 4. Market Factor Analysis
- 4.1. Porters Five Forces
- 4.2. Supply/Value Chain
- 4.3. PESTEL analysis
- 4.4. Market Entropy
- 4.5. Patent/Trademark Analysis
- 5. Global Digital Energy Consulting and Management Analysis, Insights and Forecast, 2020-2032
- 5.1. Market Analysis, Insights and Forecast - by Application
- 5.1.1. Geothermal Energy
- 5.1.2. Hydropower
- 5.1.3. Nuclear Energy
- 5.1.4. Solar Energy
- 5.1.5. Others
- 5.2. Market Analysis, Insights and Forecast - by Types
- 5.2.1. Design and Analysis
- 5.2.2. Testing and Commissioning
- 5.2.3. Field service
- 5.2.4. Others
- 5.3. Market Analysis, Insights and Forecast - by Region
- 5.3.1. North America
- 5.3.2. South America
- 5.3.3. Europe
- 5.3.4. Middle East & Africa
- 5.3.5. Asia Pacific
- 5.1. Market Analysis, Insights and Forecast - by Application
- 6. North America Digital Energy Consulting and Management Analysis, Insights and Forecast, 2020-2032
- 6.1. Market Analysis, Insights and Forecast - by Application
- 6.1.1. Geothermal Energy
- 6.1.2. Hydropower
- 6.1.3. Nuclear Energy
- 6.1.4. Solar Energy
- 6.1.5. Others
- 6.2. Market Analysis, Insights and Forecast - by Types
- 6.2.1. Design and Analysis
- 6.2.2. Testing and Commissioning
- 6.2.3. Field service
- 6.2.4. Others
- 6.1. Market Analysis, Insights and Forecast - by Application
- 7. South America Digital Energy Consulting and Management Analysis, Insights and Forecast, 2020-2032
- 7.1. Market Analysis, Insights and Forecast - by Application
- 7.1.1. Geothermal Energy
- 7.1.2. Hydropower
- 7.1.3. Nuclear Energy
- 7.1.4. Solar Energy
- 7.1.5. Others
- 7.2. Market Analysis, Insights and Forecast - by Types
- 7.2.1. Design and Analysis
- 7.2.2. Testing and Commissioning
- 7.2.3. Field service
- 7.2.4. Others
- 7.1. Market Analysis, Insights and Forecast - by Application
- 8. Europe Digital Energy Consulting and Management Analysis, Insights and Forecast, 2020-2032
- 8.1. Market Analysis, Insights and Forecast - by Application
- 8.1.1. Geothermal Energy
- 8.1.2. Hydropower
- 8.1.3. Nuclear Energy
- 8.1.4. Solar Energy
- 8.1.5. Others
- 8.2. Market Analysis, Insights and Forecast - by Types
- 8.2.1. Design and Analysis
- 8.2.2. Testing and Commissioning
- 8.2.3. Field service
- 8.2.4. Others
- 8.1. Market Analysis, Insights and Forecast - by Application
- 9. Middle East & Africa Digital Energy Consulting and Management Analysis, Insights and Forecast, 2020-2032
- 9.1. Market Analysis, Insights and Forecast - by Application
- 9.1.1. Geothermal Energy
- 9.1.2. Hydropower
- 9.1.3. Nuclear Energy
- 9.1.4. Solar Energy
- 9.1.5. Others
- 9.2. Market Analysis, Insights and Forecast - by Types
- 9.2.1. Design and Analysis
- 9.2.2. Testing and Commissioning
- 9.2.3. Field service
- 9.2.4. Others
- 9.1. Market Analysis, Insights and Forecast - by Application
- 10. Asia Pacific Digital Energy Consulting and Management Analysis, Insights and Forecast, 2020-2032
- 10.1. Market Analysis, Insights and Forecast - by Application
- 10.1.1. Geothermal Energy
- 10.1.2. Hydropower
- 10.1.3. Nuclear Energy
- 10.1.4. Solar Energy
- 10.1.5. Others
- 10.2. Market Analysis, Insights and Forecast - by Types
- 10.2.1. Design and Analysis
- 10.2.2. Testing and Commissioning
- 10.2.3. Field service
- 10.2.4. Others
- 10.1. Market Analysis, Insights and Forecast - by Application
- 11. Competitive Analysis
- 11.1. Global Market Share Analysis 2025
- 11.2. Company Profiles
- 11.2.1 GE Energy Consulting
- 11.2.1.1. Overview
- 11.2.1.2. Products
- 11.2.1.3. SWOT Analysis
- 11.2.1.4. Recent Developments
- 11.2.1.5. Financials (Based on Availability)
- 11.2.2 Accenture
- 11.2.2.1. Overview
- 11.2.2.2. Products
- 11.2.2.3. SWOT Analysis
- 11.2.2.4. Recent Developments
- 11.2.2.5. Financials (Based on Availability)
- 11.2.3 Digital Energy Solutions
- 11.2.3.1. Overview
- 11.2.3.2. Products
- 11.2.3.3. SWOT Analysis
- 11.2.3.4. Recent Developments
- 11.2.3.5. Financials (Based on Availability)
- 11.2.4 Cognizant
- 11.2.4.1. Overview
- 11.2.4.2. Products
- 11.2.4.3. SWOT Analysis
- 11.2.4.4. Recent Developments
- 11.2.4.5. Financials (Based on Availability)
- 11.2.5 BCG
- 11.2.5.1. Overview
- 11.2.5.2. Products
- 11.2.5.3. SWOT Analysis
- 11.2.5.4. Recent Developments
- 11.2.5.5. Financials (Based on Availability)
- 11.2.6 Deloitte
- 11.2.6.1. Overview
- 11.2.6.2. Products
- 11.2.6.3. SWOT Analysis
- 11.2.6.4. Recent Developments
- 11.2.6.5. Financials (Based on Availability)
- 11.2.7 Ramboll Group
- 11.2.7.1. Overview
- 11.2.7.2. Products
- 11.2.7.3. SWOT Analysis
- 11.2.7.4. Recent Developments
- 11.2.7.5. Financials (Based on Availability)
- 11.2.8 Wipro
- 11.2.8.1. Overview
- 11.2.8.2. Products
- 11.2.8.3. SWOT Analysis
- 11.2.8.4. Recent Developments
- 11.2.8.5. Financials (Based on Availability)
- 11.2.9 Capgemini Invent
- 11.2.9.1. Overview
- 11.2.9.2. Products
- 11.2.9.3. SWOT Analysis
- 11.2.9.4. Recent Developments
- 11.2.9.5. Financials (Based on Availability)
- 11.2.1 GE Energy Consulting
List of Figures
- Figure 1: Global Digital Energy Consulting and Management Revenue Breakdown (million, %) by Region 2025 & 2033
- Figure 2: North America Digital Energy Consulting and Management Revenue (million), by Application 2025 & 2033
- Figure 3: North America Digital Energy Consulting and Management Revenue Share (%), by Application 2025 & 2033
- Figure 4: North America Digital Energy Consulting and Management Revenue (million), by Types 2025 & 2033
- Figure 5: North America Digital Energy Consulting and Management Revenue Share (%), by Types 2025 & 2033
- Figure 6: North America Digital Energy Consulting and Management Revenue (million), by Country 2025 & 2033
- Figure 7: North America Digital Energy Consulting and Management Revenue Share (%), by Country 2025 & 2033
- Figure 8: South America Digital Energy Consulting and Management Revenue (million), by Application 2025 & 2033
- Figure 9: South America Digital Energy Consulting and Management Revenue Share (%), by Application 2025 & 2033
- Figure 10: South America Digital Energy Consulting and Management Revenue (million), by Types 2025 & 2033
- Figure 11: South America Digital Energy Consulting and Management Revenue Share (%), by Types 2025 & 2033
- Figure 12: South America Digital Energy Consulting and Management Revenue (million), by Country 2025 & 2033
- Figure 13: South America Digital Energy Consulting and Management Revenue Share (%), by Country 2025 & 2033
- Figure 14: Europe Digital Energy Consulting and Management Revenue (million), by Application 2025 & 2033
- Figure 15: Europe Digital Energy Consulting and Management Revenue Share (%), by Application 2025 & 2033
- Figure 16: Europe Digital Energy Consulting and Management Revenue (million), by Types 2025 & 2033
- Figure 17: Europe Digital Energy Consulting and Management Revenue Share (%), by Types 2025 & 2033
- Figure 18: Europe Digital Energy Consulting and Management Revenue (million), by Country 2025 & 2033
- Figure 19: Europe Digital Energy Consulting and Management Revenue Share (%), by Country 2025 & 2033
- Figure 20: Middle East & Africa Digital Energy Consulting and Management Revenue (million), by Application 2025 & 2033
- Figure 21: Middle East & Africa Digital Energy Consulting and Management Revenue Share (%), by Application 2025 & 2033
- Figure 22: Middle East & Africa Digital Energy Consulting and Management Revenue (million), by Types 2025 & 2033
- Figure 23: Middle East & Africa Digital Energy Consulting and Management Revenue Share (%), by Types 2025 & 2033
- Figure 24: Middle East & Africa Digital Energy Consulting and Management Revenue (million), by Country 2025 & 2033
- Figure 25: Middle East & Africa Digital Energy Consulting and Management Revenue Share (%), by Country 2025 & 2033
- Figure 26: Asia Pacific Digital Energy Consulting and Management Revenue (million), by Application 2025 & 2033
- Figure 27: Asia Pacific Digital Energy Consulting and Management Revenue Share (%), by Application 2025 & 2033
- Figure 28: Asia Pacific Digital Energy Consulting and Management Revenue (million), by Types 2025 & 2033
- Figure 29: Asia Pacific Digital Energy Consulting and Management Revenue Share (%), by Types 2025 & 2033
- Figure 30: Asia Pacific Digital Energy Consulting and Management Revenue (million), by Country 2025 & 2033
- Figure 31: Asia Pacific Digital Energy Consulting and Management Revenue Share (%), by Country 2025 & 2033
List of Tables
- Table 1: Global Digital Energy Consulting and Management Revenue million Forecast, by Application 2020 & 2033
- Table 2: Global Digital Energy Consulting and Management Revenue million Forecast, by Types 2020 & 2033
- Table 3: Global Digital Energy Consulting and Management Revenue million Forecast, by Region 2020 & 2033
- Table 4: Global Digital Energy Consulting and Management Revenue million Forecast, by Application 2020 & 2033
- Table 5: Global Digital Energy Consulting and Management Revenue million Forecast, by Types 2020 & 2033
- Table 6: Global Digital Energy Consulting and Management Revenue million Forecast, by Country 2020 & 2033
- Table 7: United States Digital Energy Consulting and Management Revenue (million) Forecast, by Application 2020 & 2033
- Table 8: Canada Digital Energy Consulting and Management Revenue (million) Forecast, by Application 2020 & 2033
- Table 9: Mexico Digital Energy Consulting and Management Revenue (million) Forecast, by Application 2020 & 2033
- Table 10: Global Digital Energy Consulting and Management Revenue million Forecast, by Application 2020 & 2033
- Table 11: Global Digital Energy Consulting and Management Revenue million Forecast, by Types 2020 & 2033
- Table 12: Global Digital Energy Consulting and Management Revenue million Forecast, by Country 2020 & 2033
- Table 13: Brazil Digital Energy Consulting and Management Revenue (million) Forecast, by Application 2020 & 2033
- Table 14: Argentina Digital Energy Consulting and Management Revenue (million) Forecast, by Application 2020 & 2033
- Table 15: Rest of South America Digital Energy Consulting and Management Revenue (million) Forecast, by Application 2020 & 2033
- Table 16: Global Digital Energy Consulting and Management Revenue million Forecast, by Application 2020 & 2033
- Table 17: Global Digital Energy Consulting and Management Revenue million Forecast, by Types 2020 & 2033
- Table 18: Global Digital Energy Consulting and Management Revenue million Forecast, by Country 2020 & 2033
- Table 19: United Kingdom Digital Energy Consulting and Management Revenue (million) Forecast, by Application 2020 & 2033
- Table 20: Germany Digital Energy Consulting and Management Revenue (million) Forecast, by Application 2020 & 2033
- Table 21: France Digital Energy Consulting and Management Revenue (million) Forecast, by Application 2020 & 2033
- Table 22: Italy Digital Energy Consulting and Management Revenue (million) Forecast, by Application 2020 & 2033
- Table 23: Spain Digital Energy Consulting and Management Revenue (million) Forecast, by Application 2020 & 2033
- Table 24: Russia Digital Energy Consulting and Management Revenue (million) Forecast, by Application 2020 & 2033
- Table 25: Benelux Digital Energy Consulting and Management Revenue (million) Forecast, by Application 2020 & 2033
- Table 26: Nordics Digital Energy Consulting and Management Revenue (million) Forecast, by Application 2020 & 2033
- Table 27: Rest of Europe Digital Energy Consulting and Management Revenue (million) Forecast, by Application 2020 & 2033
- Table 28: Global Digital Energy Consulting and Management Revenue million Forecast, by Application 2020 & 2033
- Table 29: Global Digital Energy Consulting and Management Revenue million Forecast, by Types 2020 & 2033
- Table 30: Global Digital Energy Consulting and Management Revenue million Forecast, by Country 2020 & 2033
- Table 31: Turkey Digital Energy Consulting and Management Revenue (million) Forecast, by Application 2020 & 2033
- Table 32: Israel Digital Energy Consulting and Management Revenue (million) Forecast, by Application 2020 & 2033
- Table 33: GCC Digital Energy Consulting and Management Revenue (million) Forecast, by Application 2020 & 2033
- Table 34: North Africa Digital Energy Consulting and Management Revenue (million) Forecast, by Application 2020 & 2033
- Table 35: South Africa Digital Energy Consulting and Management Revenue (million) Forecast, by Application 2020 & 2033
- Table 36: Rest of Middle East & Africa Digital Energy Consulting and Management Revenue (million) Forecast, by Application 2020 & 2033
- Table 37: Global Digital Energy Consulting and Management Revenue million Forecast, by Application 2020 & 2033
- Table 38: Global Digital Energy Consulting and Management Revenue million Forecast, by Types 2020 & 2033
- Table 39: Global Digital Energy Consulting and Management Revenue million Forecast, by Country 2020 & 2033
- Table 40: China Digital Energy Consulting and Management Revenue (million) Forecast, by Application 2020 & 2033
- Table 41: India Digital Energy Consulting and Management Revenue (million) Forecast, by Application 2020 & 2033
- Table 42: Japan Digital Energy Consulting and Management Revenue (million) Forecast, by Application 2020 & 2033
- Table 43: South Korea Digital Energy Consulting and Management Revenue (million) Forecast, by Application 2020 & 2033
- Table 44: ASEAN Digital Energy Consulting and Management Revenue (million) Forecast, by Application 2020 & 2033
- Table 45: Oceania Digital Energy Consulting and Management Revenue (million) Forecast, by Application 2020 & 2033
- Table 46: Rest of Asia Pacific Digital Energy Consulting and Management Revenue (million) Forecast, by Application 2020 & 2033
Frequently Asked Questions
1. What is the projected Compound Annual Growth Rate (CAGR) of the Digital Energy Consulting and Management?
The projected CAGR is approximately XX%.
2. Which companies are prominent players in the Digital Energy Consulting and Management?
Key companies in the market include GE Energy Consulting, Accenture, Digital Energy Solutions, Cognizant, BCG, Deloitte, Ramboll Group, Wipro, Capgemini Invent.
3. What are the main segments of the Digital Energy Consulting and Management?
The market segments include Application, Types.
4. Can you provide details about the market size?
The market size is estimated to be USD XXX million as of 2022.
5. What are some drivers contributing to market growth?
N/A
6. What are the notable trends driving market growth?
N/A
7. Are there any restraints impacting market growth?
N/A
8. Can you provide examples of recent developments in the market?
N/A
9. What pricing options are available for accessing the report?
Pricing options include single-user, multi-user, and enterprise licenses priced at USD 4900.00, USD 7350.00, and USD 9800.00 respectively.
10. Is the market size provided in terms of value or volume?
The market size is provided in terms of value, measured in million.
11. Are there any specific market keywords associated with the report?
Yes, the market keyword associated with the report is "Digital Energy Consulting and Management," which aids in identifying and referencing the specific market segment covered.
12. How do I determine which pricing option suits my needs best?
The pricing options vary based on user requirements and access needs. Individual users may opt for single-user licenses, while businesses requiring broader access may choose multi-user or enterprise licenses for cost-effective access to the report.
13. Are there any additional resources or data provided in the Digital Energy Consulting and Management report?
While the report offers comprehensive insights, it's advisable to review the specific contents or supplementary materials provided to ascertain if additional resources or data are available.
14. How can I stay updated on further developments or reports in the Digital Energy Consulting and Management?
To stay informed about further developments, trends, and reports in the Digital Energy Consulting and Management, consider subscribing to industry newsletters, following relevant companies and organizations, or regularly checking reputable industry news sources and publications.
Methodology
Step 1 - Identification of Relevant Samples Size from Population Database


Step 2 - Approaches for Defining Global Market Size (Value, Volume* & Price*)

Note*: In applicable scenarios
Step 3 - Data Sources
Primary Research
- Web Analytics
- Survey Reports
- Research Institute
- Latest Research Reports
- Opinion Leaders
Secondary Research
- Annual Reports
- White Paper
- Latest Press Release
- Industry Association
- Paid Database
- Investor Presentations

Step 4 - Data Triangulation
Involves using different sources of information in order to increase the validity of a study
These sources are likely to be stakeholders in a program - participants, other researchers, program staff, other community members, and so on.
Then we put all data in single framework & apply various statistical tools to find out the dynamic on the market.
During the analysis stage, feedback from the stakeholder groups would be compared to determine areas of agreement as well as areas of divergence