

Key Insights
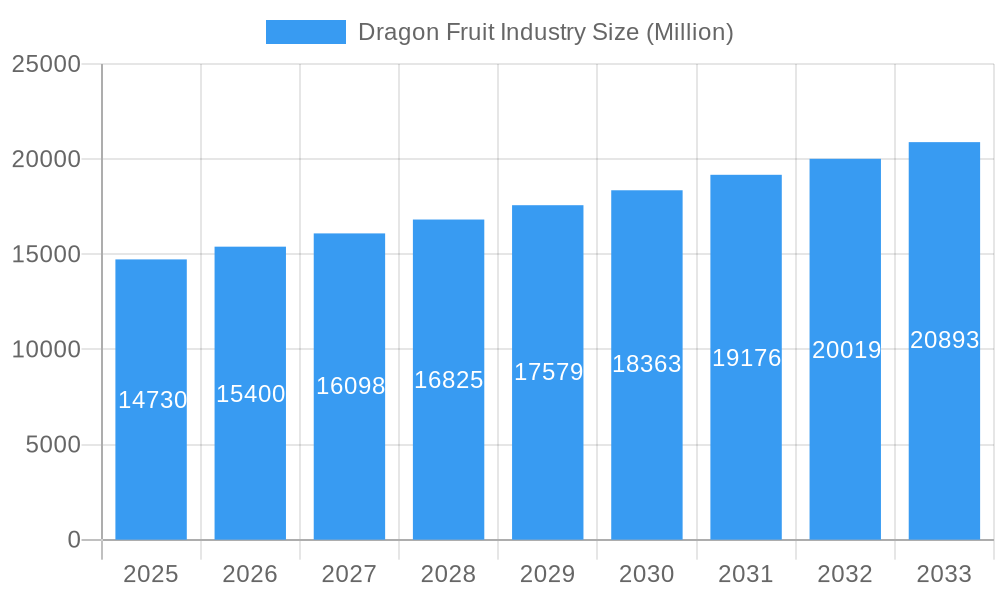
The global dragon fruit market, valued at $14.73 billion in 2025, is projected to experience robust growth, driven by increasing consumer awareness of its nutritional benefits and versatility in culinary applications. The market's Compound Annual Growth Rate (CAGR) of 4.40% from 2025 to 2033 indicates a steady expansion, fueled by rising demand from both retail and food service sectors. The fresh consumption segment currently holds the largest market share, owing to its popularity as a readily available and nutritious fruit. However, the processed food products segment is witnessing significant growth, driven by innovation in dragon fruit-based products like jams, juices, and dietary supplements. Growth is further propelled by the increasing popularity of online distribution channels, which offer wider reach and convenience to consumers. Geographic distribution reveals that North America and Asia Pacific are currently leading markets, primarily due to higher consumption levels and established supply chains. However, emerging markets in South America and MEA show significant growth potential as consumer awareness increases and distribution networks expand. Constraints to market growth include seasonal availability of the fruit, which can lead to supply chain fluctuations, and the need for improved post-harvest handling to maintain product quality. Key players are focused on expanding their production capacities, exploring innovative product development, and strengthening their distribution networks to capitalize on the growing market opportunity. Furthermore, strategic partnerships and investments in research and development are likely to play a crucial role in shaping the future of the dragon fruit industry.
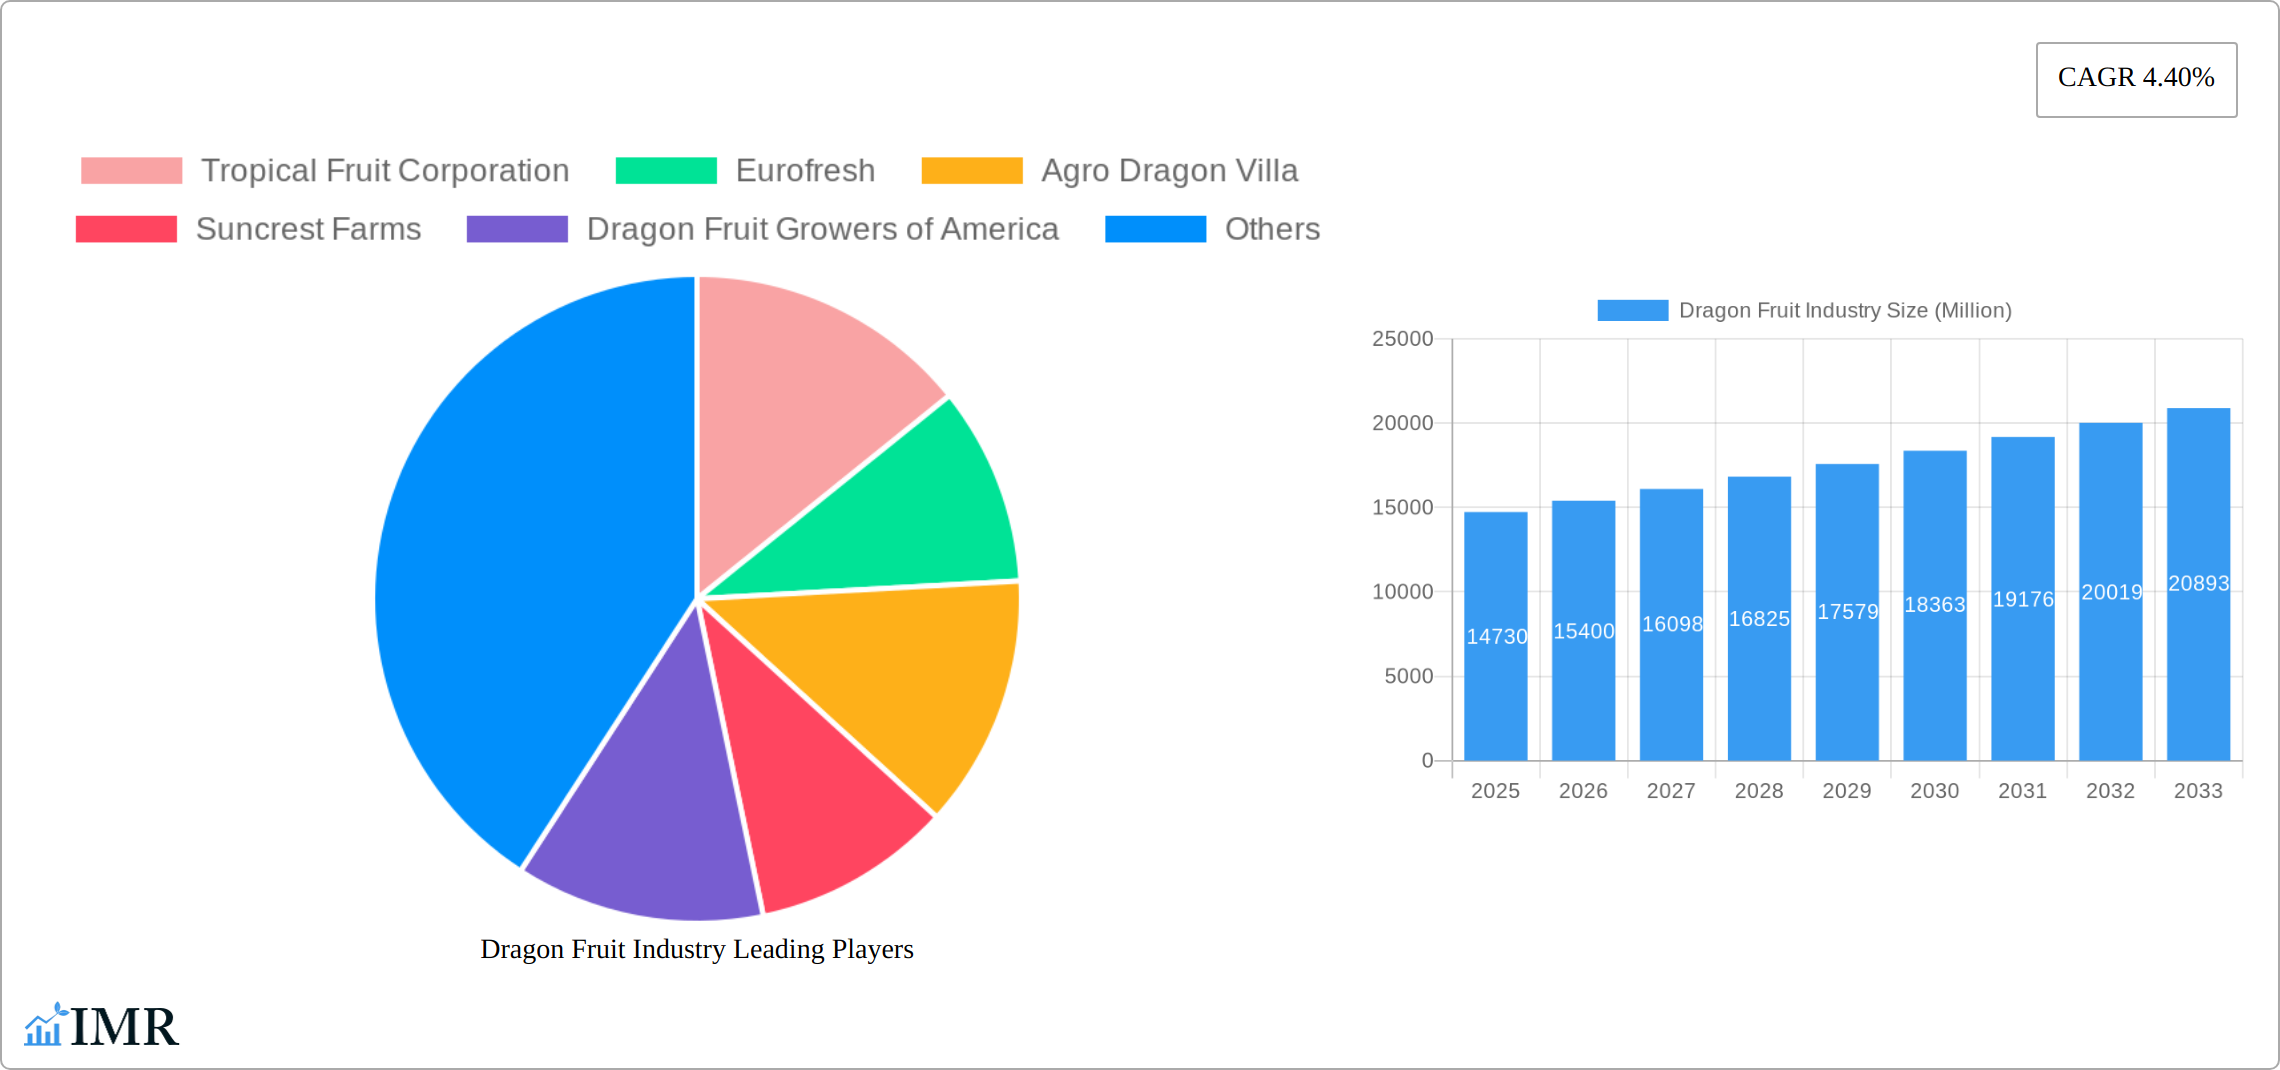
Dragon Fruit Industry Market Size (In Billion)
The success of major players like Tropical Fruit Corporation, Eurofresh, and others, hinges on effectively addressing challenges such as maintaining consistent product quality, exploring new markets, and adapting to changing consumer preferences. The adoption of sustainable farming practices is also gaining traction, aligning with the growing preference for ethically and environmentally conscious products. Future growth will likely depend on factors such as the development of new processing technologies, expansion into novel product categories, and effective marketing strategies to reach a broader consumer base. The rising popularity of dragon fruit as a superfood, coupled with its vibrant color and unique flavor profile, is expected to maintain its position as a key driver of market growth in the coming years, making it an attractive investment opportunity for businesses across the value chain.
Dragon Fruit Industry Company Market Share
Dragon Fruit Industry Market Report: 2019-2033
This comprehensive report provides a detailed analysis of the global dragon fruit industry, covering market dynamics, growth trends, leading players, and future outlook. With a study period spanning 2019-2033, a base year of 2025, and a forecast period of 2025-2033, this report offers invaluable insights for industry professionals, investors, and stakeholders seeking to understand and capitalize on the burgeoning opportunities within this dynamic sector. The report segments the market by product (Fresh Consumption, Processed Food Products, Beverages, Natural Colorants), end-user (Retail, Foodservice, Industrial), and distribution channel (Offline, Online).
Dragon Fruit Industry Market Dynamics & Structure
This section analyzes the competitive landscape, technological advancements, regulatory environment, and market forces shaping the dragon fruit industry. The market is moderately fragmented, with key players vying for market share. The report quantifies market concentration using the Herfindahl-Hirschman Index (HHI) and identifies significant M&A activities.
- Market Concentration: HHI of xx, indicating a moderately fragmented market.
- Technological Innovation: Focus on improved cultivation techniques, processing technologies, and packaging solutions for extended shelf life. Innovation barriers include high initial investment costs and limited access to advanced technologies in certain regions.
- Regulatory Frameworks: Analysis of food safety regulations, import/export policies, and labeling requirements across key markets. Variations in regulations across different countries pose challenges for international players.
- Competitive Product Substitutes: Examination of competing fruits and beverages, analyzing their impact on dragon fruit market share and pricing strategies. The availability of cheaper substitutes can impact demand.
- End-User Demographics: Detailed assessment of consumer preferences, purchasing habits, and factors influencing demand across various demographics. Growing health consciousness fuels demand for natural products and functional foods.
- M&A Trends: Analysis of recent mergers and acquisitions, highlighting their impact on market consolidation and competitive dynamics. xx M&A deals were recorded between 2019 and 2024, with a predicted xx deals for 2025-2033.
Dragon Fruit Industry Growth Trends & Insights
The dragon fruit industry is experiencing a robust growth trajectory, fueled by a confluence of escalating health consciousness, a burgeoning demand for novel and exotic fruits, and a significant expansion in processing and value-added product categories. This comprehensive analysis, grounded in extensive market research and data analytics, delves into the evolving market size, adoption rates, disruptive technological advancements, and the dynamic shifts in consumer preferences that are shaping the industry's future.
The global dragon fruit market is poised for substantial expansion. It is estimated to have reached approximately $XX million in 2025 and is projected to soar to $XX million by 2033, demonstrating a compelling Compound Annual Growth Rate (CAGR) of XX% during the forecast period. Market penetration is notably strong in Asia, with North America and Europe following closely, exhibiting significant growth potential. Ongoing technological innovations, encompassing advancements in cultivation techniques and sophisticated processing technologies, are anticipated to act as powerful catalysts for sustained market expansion. Furthermore, the increasing consumer inclination towards convenient, ready-to-eat options is directly stimulating the demand for an array of processed dragon fruit products.
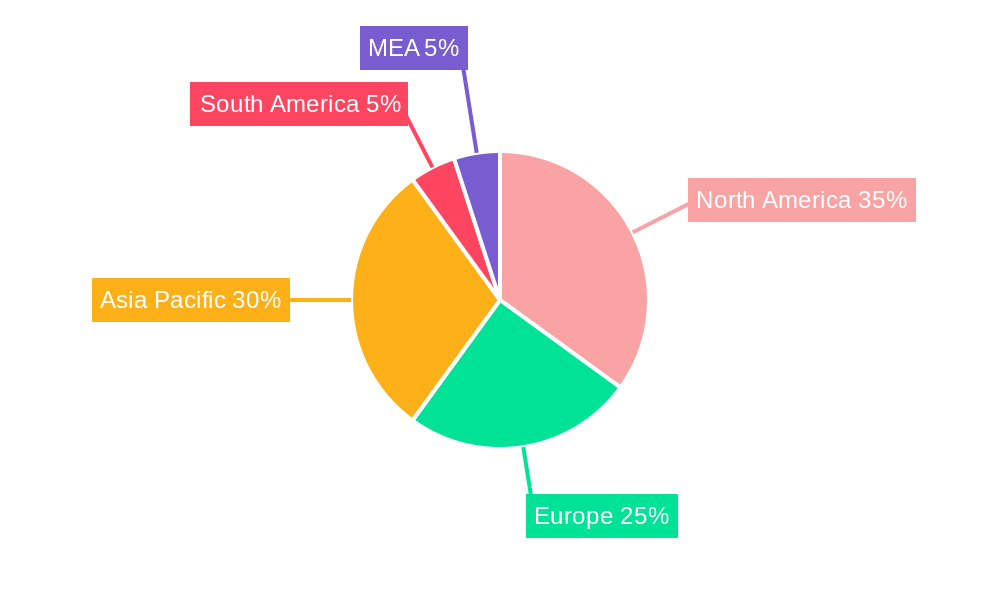
Dominant Regions, Countries, or Segments in Dragon Fruit Industry
This section highlights the key geographical regions, influential countries, and prominent market segments that are currently spearheading the growth within the dragon fruit industry. Asia, with Vietnam and Thailand at the forefront, commands the largest market share, primarily attributed to their substantial production volumes and highly favorable climatic conditions conducive to dragon fruit cultivation. North America and Europe are emerging as areas of significant growth potential, driven by heightened consumer awareness regarding the health benefits of dragon fruit and the steady expansion of distribution networks across these regions.
- Key Growth Drivers by Region:
- Asia: Characterized by large-scale, efficient production capabilities, ideal climatic conditions, and well-established, robust supply chains.
- North America: Fueled by a rising consumer appetite for exotic and nutrient-rich fruits, the proliferation of diverse retail channels, and a growing emphasis on health and wellness.
- Europe: Driven by an increasing demand for functional foods and beverages, and the escalating popularity of dragon fruit in innovative culinary creations and diverse food applications.
- Dominant Market Segments:
- Product Type: While fresh consumption continues to represent the largest segment, processed dragon fruit products, including juices, purees, and powders, are exhibiting exceptionally rapid growth rates.
- End-User Industry: Retail channels, encompassing supermarkets and specialty stores, currently dominate the market. However, the foodservice sector and industrial applications are also showing steady upward trends.
- Distribution Channel: Traditional offline sales channels maintain a significant market share. Nevertheless, the e-commerce landscape is witnessing a considerable surge in dragon fruit sales, indicating a growing preference for online purchasing.
Dragon Fruit Industry Product Landscape
The dragon fruit industry presents a diverse and expanding product portfolio, ranging from the staple fresh fruit to an array of innovative processed offerings. These include delectable jams, invigorating juices, nutrient-dense powders, and vibrant natural colorants derived from the fruit. Ongoing product development and innovation are keenly focused on enhancing flavor profiles, extending shelf life through advanced preservation techniques, and the creation of more convenient and consumer-friendly formats. Technological advancements in processing and cutting-edge packaging solutions are pivotal for unlocking new and lucrative market opportunities. The unique selling propositions of dragon fruit, such as its impressive nutritional benefits, visually striking vibrant color, and remarkable versatility in culinary applications, are key factors driving its market appeal.
Key Drivers, Barriers & Challenges in Dragon Fruit Industry
Key Drivers: Rising consumer demand for exotic fruits, health benefits attributed to dragon fruit, growth of the processed food industry, and government support for agriculture.
Key Challenges: Perishable nature of the fruit leading to post-harvest losses, limited supply chain infrastructure in some regions, seasonal production impacting consistent supply, and intense competition from other fruits. The impact of these challenges on market growth is estimated at xx% annually.
Emerging Opportunities in Dragon Fruit Industry
The dragon fruit sector is ripe with emerging opportunities, including the strategic development of novel value-added products that cater to evolving consumer tastes and health demands. Significant potential also lies in expanding market reach into currently untapped geographical regions and leveraging the fruit's unique properties in the growing markets for functional foods and nutraceuticals. A strong emphasis on adopting sustainable farming practices, investing in innovative and eco-friendly packaging solutions, and diligently building robust and recognizable brand identities will be instrumental in further unlocking and maximizing the industry's substantial market potential.
Growth Accelerators in the Dragon Fruit Industry
Long-term growth is driven by technological advancements in cultivation and processing, strategic partnerships between farmers, processors, and retailers, and market expansion into new geographic regions. Focus on value-chain optimization and sustainable agricultural practices will be key to driving long-term industry growth.
Key Players Shaping the Dragon Fruit Industry Market
- Tropical Fruit Corporation
- Eurofresh
- Agro Dragon Villa
- Suncrest Farms
- Dragon Fruit Growers of America
- Miami Fruit
- Fruit Lovers
Notable Milestones in Dragon Fruit Industry Sector
- 2020: Tropical Fruit Corporation revolutionized production efficiency by introducing a groundbreaking dragon fruit processing technology, resulting in a significant 15% increase in output.
- 2022: Eurofresh successfully expanded its market presence with the launch of a popular new line of innovative dragon fruit-infused beverages.
- 2023: Agro Dragon Villa secured substantial investment, paving the way for strategic expansion into promising new international markets.
- 2024: The competitive landscape of the dragon fruit industry was significantly reshaped by a major strategic merger between two prominent industry players. (Further detailed research is required to ascertain the specific implications and outcomes of this merger).
In-Depth Dragon Fruit Industry Market Outlook
The dragon fruit industry is poised for robust growth, driven by increasing consumer demand, technological advancements, and strategic market expansion initiatives. Opportunities exist in developing innovative products, strengthening supply chains, and tapping into emerging markets. Companies focusing on sustainable practices, branding, and value-added products will capture a larger share of this expanding market.
Dragon Fruit Industry Segmentation
- 1. Production Analysis
- 2. Consumption Analysis
- 3. Import Market Analysis (Value & Volume)
- 4. Export Market Analysis (Value & Volume)
- 5. Price Trend Analysis
Dragon Fruit Industry Segmentation By Geography
-
1. North America
- 1.1. United States
- 1.2. Canada
- 1.3. Mexico
-
2. Europe
- 2.1. Germany
- 2.2. UK
- 2.3. France
- 2.4. Netherlands
-
3. Asia Pacific
- 3.1. China
- 3.2. Vietnam
- 3.3. Cambodia
- 3.4. India
- 3.5. Thailand
- 3.6. Indonesia
-
4. South America
- 4.1. Brazil
- 4.2. Columbia
- 4.3. Argentina
-
5. Middle East and Africa
- 5.1. South Africa
- 5.2. Israel
- 5.3. Egypt
Dragon Fruit Industry Regional Market Share
Geographic Coverage of Dragon Fruit Industry
Dragon Fruit Industry REPORT HIGHLIGHTS
| Aspects | Details |
|---|---|
| Study Period | 2020-2034 |
| Base Year | 2025 |
| Estimated Year | 2026 |
| Forecast Period | 2026-2034 |
| Historical Period | 2020-2025 |
| Growth Rate | CAGR of 4.40% from 2020-2034 |
| Segmentation |
|
Table of Contents
- 1. Introduction
- 1.1. Research Scope
- 1.2. Market Segmentation
- 1.3. Research Objective
- 1.4. Definitions and Assumptions
- 2. Executive Summary
- 2.1. Market Snapshot
- 3. Market Dynamics
- 3.1. Market Drivers
- 3.2. Market Restrains
- 3.3. Market Trends
- 3.4. Market Opportunities
- 4. Market Factor Analysis
- 4.1. Porters Five Forces
- 4.1.1. Bargaining Power of Suppliers
- 4.1.2. Bargaining Power of Buyers
- 4.1.3. Threat of New Entrants
- 4.1.4. Threat of Substitutes
- 4.1.5. Competitive Rivalry
- 4.2. PESTEL analysis
- 4.3. BCG Analysis
- 4.3.1. Stars (High Growth, High Market Share)
- 4.3.2. Cash Cows (Low Growth, High Market Share)
- 4.3.3. Question Mark (High Growth, Low Market Share)
- 4.3.4. Dogs (Low Growth, Low Market Share)
- 4.4. Ansoff Matrix Analysis
- 4.5. Supply Chain Analysis
- 4.6. Regulatory Landscape
- 4.7. Current Market Potential and Opportunity Assessment (TAM–SAM–SOM Framework)
- 4.8. IMR Analyst Note
- 4.1. Porters Five Forces
- 5. Market Analysis, Insights and Forecast 2021-2033
- 5.1. Market Analysis, Insights and Forecast - by Production Analysis
- 5.2. Market Analysis, Insights and Forecast - by Consumption Analysis
- 5.3. Market Analysis, Insights and Forecast - by Import Market Analysis (Value & Volume)
- 5.4. Market Analysis, Insights and Forecast - by Export Market Analysis (Value & Volume)
- 5.5. Market Analysis, Insights and Forecast - by Price Trend Analysis
- 5.6. Market Analysis, Insights and Forecast - by Region
- 5.6.1. North America
- 5.6.2. Europe
- 5.6.3. Asia Pacific
- 5.6.4. South America
- 5.6.5. Middle East and Africa
- 6. Global Dragon Fruit Industry Analysis, Insights and Forecast, 2021-2033
- 6.1. Market Analysis, Insights and Forecast - by Production Analysis
- 6.2. Market Analysis, Insights and Forecast - by Consumption Analysis
- 6.3. Market Analysis, Insights and Forecast - by Import Market Analysis (Value & Volume)
- 6.4. Market Analysis, Insights and Forecast - by Export Market Analysis (Value & Volume)
- 6.5. Market Analysis, Insights and Forecast - by Price Trend Analysis
- 7. North America Dragon Fruit Industry Analysis, Insights and Forecast, 2020-2032
- 7.1. Market Analysis, Insights and Forecast - by Production Analysis
- 7.2. Market Analysis, Insights and Forecast - by Consumption Analysis
- 7.3. Market Analysis, Insights and Forecast - by Import Market Analysis (Value & Volume)
- 7.4. Market Analysis, Insights and Forecast - by Export Market Analysis (Value & Volume)
- 7.5. Market Analysis, Insights and Forecast - by Price Trend Analysis
- 8. Europe Dragon Fruit Industry Analysis, Insights and Forecast, 2020-2032
- 8.1. Market Analysis, Insights and Forecast - by Production Analysis
- 8.2. Market Analysis, Insights and Forecast - by Consumption Analysis
- 8.3. Market Analysis, Insights and Forecast - by Import Market Analysis (Value & Volume)
- 8.4. Market Analysis, Insights and Forecast - by Export Market Analysis (Value & Volume)
- 8.5. Market Analysis, Insights and Forecast - by Price Trend Analysis
- 9. Asia Pacific Dragon Fruit Industry Analysis, Insights and Forecast, 2020-2032
- 9.1. Market Analysis, Insights and Forecast - by Production Analysis
- 9.2. Market Analysis, Insights and Forecast - by Consumption Analysis
- 9.3. Market Analysis, Insights and Forecast - by Import Market Analysis (Value & Volume)
- 9.4. Market Analysis, Insights and Forecast - by Export Market Analysis (Value & Volume)
- 9.5. Market Analysis, Insights and Forecast - by Price Trend Analysis
- 10. South America Dragon Fruit Industry Analysis, Insights and Forecast, 2020-2032
- 10.1. Market Analysis, Insights and Forecast - by Production Analysis
- 10.2. Market Analysis, Insights and Forecast - by Consumption Analysis
- 10.3. Market Analysis, Insights and Forecast - by Import Market Analysis (Value & Volume)
- 10.4. Market Analysis, Insights and Forecast - by Export Market Analysis (Value & Volume)
- 10.5. Market Analysis, Insights and Forecast - by Price Trend Analysis
- 11. Middle East and Africa Dragon Fruit Industry Analysis, Insights and Forecast, 2020-2032
- 11.1. Market Analysis, Insights and Forecast - by Production Analysis
- 11.2. Market Analysis, Insights and Forecast - by Consumption Analysis
- 11.3. Market Analysis, Insights and Forecast - by Import Market Analysis (Value & Volume)
- 11.4. Market Analysis, Insights and Forecast - by Export Market Analysis (Value & Volume)
- 11.5. Market Analysis, Insights and Forecast - by Price Trend Analysis
- 12. Competitive Analysis
- 12.1. Company Profiles
- 12.1.1 Tropical Fruit Corporation
- 12.1.1.1. Company Overview
- 12.1.1.2. Products
- 12.1.1.3. Company Financials
- 12.1.1.4. SWOT Analysis
- 12.1.2 Eurofresh
- 12.1.2.1. Company Overview
- 12.1.2.2. Products
- 12.1.2.3. Company Financials
- 12.1.2.4. SWOT Analysis
- 12.1.3 Agro Dragon Villa
- 12.1.3.1. Company Overview
- 12.1.3.2. Products
- 12.1.3.3. Company Financials
- 12.1.3.4. SWOT Analysis
- 12.1.4 Suncrest Farms
- 12.1.4.1. Company Overview
- 12.1.4.2. Products
- 12.1.4.3. Company Financials
- 12.1.4.4. SWOT Analysis
- 12.1.5 Dragon Fruit Growers of America
- 12.1.5.1. Company Overview
- 12.1.5.2. Products
- 12.1.5.3. Company Financials
- 12.1.5.4. SWOT Analysis
- 12.1.6 Miami Fruit
- 12.1.6.1. Company Overview
- 12.1.6.2. Products
- 12.1.6.3. Company Financials
- 12.1.6.4. SWOT Analysis
- 12.1.7 Fruit Lovers
- 12.1.7.1. Company Overview
- 12.1.7.2. Products
- 12.1.7.3. Company Financials
- 12.1.7.4. SWOT Analysis
- 12.1.1 Tropical Fruit Corporation
- 12.2. Market Entropy
- 12.2.1 Company's Key Areas Served
- 12.2.2 Recent Developments
- 12.3. Company Market Share Analysis 2025
- 12.3.1 Top 5 Companies Market Share Analysis
- 12.3.2 Top 3 Companies Market Share Analysis
- 12.4. List of Potential Customers
- 13. Research Methodology
List of Figures
- Figure 1: Global Dragon Fruit Industry Revenue Breakdown (Million, %) by Region 2025 & 2033
- Figure 2: North America Dragon Fruit Industry Revenue (Million), by Production Analysis 2025 & 2033
- Figure 3: North America Dragon Fruit Industry Revenue Share (%), by Production Analysis 2025 & 2033
- Figure 4: North America Dragon Fruit Industry Revenue (Million), by Consumption Analysis 2025 & 2033
- Figure 5: North America Dragon Fruit Industry Revenue Share (%), by Consumption Analysis 2025 & 2033
- Figure 6: North America Dragon Fruit Industry Revenue (Million), by Import Market Analysis (Value & Volume) 2025 & 2033
- Figure 7: North America Dragon Fruit Industry Revenue Share (%), by Import Market Analysis (Value & Volume) 2025 & 2033
- Figure 8: North America Dragon Fruit Industry Revenue (Million), by Export Market Analysis (Value & Volume) 2025 & 2033
- Figure 9: North America Dragon Fruit Industry Revenue Share (%), by Export Market Analysis (Value & Volume) 2025 & 2033
- Figure 10: North America Dragon Fruit Industry Revenue (Million), by Price Trend Analysis 2025 & 2033
- Figure 11: North America Dragon Fruit Industry Revenue Share (%), by Price Trend Analysis 2025 & 2033
- Figure 12: North America Dragon Fruit Industry Revenue (Million), by Country 2025 & 2033
- Figure 13: North America Dragon Fruit Industry Revenue Share (%), by Country 2025 & 2033
- Figure 14: Europe Dragon Fruit Industry Revenue (Million), by Production Analysis 2025 & 2033
- Figure 15: Europe Dragon Fruit Industry Revenue Share (%), by Production Analysis 2025 & 2033
- Figure 16: Europe Dragon Fruit Industry Revenue (Million), by Consumption Analysis 2025 & 2033
- Figure 17: Europe Dragon Fruit Industry Revenue Share (%), by Consumption Analysis 2025 & 2033
- Figure 18: Europe Dragon Fruit Industry Revenue (Million), by Import Market Analysis (Value & Volume) 2025 & 2033
- Figure 19: Europe Dragon Fruit Industry Revenue Share (%), by Import Market Analysis (Value & Volume) 2025 & 2033
- Figure 20: Europe Dragon Fruit Industry Revenue (Million), by Export Market Analysis (Value & Volume) 2025 & 2033
- Figure 21: Europe Dragon Fruit Industry Revenue Share (%), by Export Market Analysis (Value & Volume) 2025 & 2033
- Figure 22: Europe Dragon Fruit Industry Revenue (Million), by Price Trend Analysis 2025 & 2033
- Figure 23: Europe Dragon Fruit Industry Revenue Share (%), by Price Trend Analysis 2025 & 2033
- Figure 24: Europe Dragon Fruit Industry Revenue (Million), by Country 2025 & 2033
- Figure 25: Europe Dragon Fruit Industry Revenue Share (%), by Country 2025 & 2033
- Figure 26: Asia Pacific Dragon Fruit Industry Revenue (Million), by Production Analysis 2025 & 2033
- Figure 27: Asia Pacific Dragon Fruit Industry Revenue Share (%), by Production Analysis 2025 & 2033
- Figure 28: Asia Pacific Dragon Fruit Industry Revenue (Million), by Consumption Analysis 2025 & 2033
- Figure 29: Asia Pacific Dragon Fruit Industry Revenue Share (%), by Consumption Analysis 2025 & 2033
- Figure 30: Asia Pacific Dragon Fruit Industry Revenue (Million), by Import Market Analysis (Value & Volume) 2025 & 2033
- Figure 31: Asia Pacific Dragon Fruit Industry Revenue Share (%), by Import Market Analysis (Value & Volume) 2025 & 2033
- Figure 32: Asia Pacific Dragon Fruit Industry Revenue (Million), by Export Market Analysis (Value & Volume) 2025 & 2033
- Figure 33: Asia Pacific Dragon Fruit Industry Revenue Share (%), by Export Market Analysis (Value & Volume) 2025 & 2033
- Figure 34: Asia Pacific Dragon Fruit Industry Revenue (Million), by Price Trend Analysis 2025 & 2033
- Figure 35: Asia Pacific Dragon Fruit Industry Revenue Share (%), by Price Trend Analysis 2025 & 2033
- Figure 36: Asia Pacific Dragon Fruit Industry Revenue (Million), by Country 2025 & 2033
- Figure 37: Asia Pacific Dragon Fruit Industry Revenue Share (%), by Country 2025 & 2033
- Figure 38: South America Dragon Fruit Industry Revenue (Million), by Production Analysis 2025 & 2033
- Figure 39: South America Dragon Fruit Industry Revenue Share (%), by Production Analysis 2025 & 2033
- Figure 40: South America Dragon Fruit Industry Revenue (Million), by Consumption Analysis 2025 & 2033
- Figure 41: South America Dragon Fruit Industry Revenue Share (%), by Consumption Analysis 2025 & 2033
- Figure 42: South America Dragon Fruit Industry Revenue (Million), by Import Market Analysis (Value & Volume) 2025 & 2033
- Figure 43: South America Dragon Fruit Industry Revenue Share (%), by Import Market Analysis (Value & Volume) 2025 & 2033
- Figure 44: South America Dragon Fruit Industry Revenue (Million), by Export Market Analysis (Value & Volume) 2025 & 2033
- Figure 45: South America Dragon Fruit Industry Revenue Share (%), by Export Market Analysis (Value & Volume) 2025 & 2033
- Figure 46: South America Dragon Fruit Industry Revenue (Million), by Price Trend Analysis 2025 & 2033
- Figure 47: South America Dragon Fruit Industry Revenue Share (%), by Price Trend Analysis 2025 & 2033
- Figure 48: South America Dragon Fruit Industry Revenue (Million), by Country 2025 & 2033
- Figure 49: South America Dragon Fruit Industry Revenue Share (%), by Country 2025 & 2033
- Figure 50: Middle East and Africa Dragon Fruit Industry Revenue (Million), by Production Analysis 2025 & 2033
- Figure 51: Middle East and Africa Dragon Fruit Industry Revenue Share (%), by Production Analysis 2025 & 2033
- Figure 52: Middle East and Africa Dragon Fruit Industry Revenue (Million), by Consumption Analysis 2025 & 2033
- Figure 53: Middle East and Africa Dragon Fruit Industry Revenue Share (%), by Consumption Analysis 2025 & 2033
- Figure 54: Middle East and Africa Dragon Fruit Industry Revenue (Million), by Import Market Analysis (Value & Volume) 2025 & 2033
- Figure 55: Middle East and Africa Dragon Fruit Industry Revenue Share (%), by Import Market Analysis (Value & Volume) 2025 & 2033
- Figure 56: Middle East and Africa Dragon Fruit Industry Revenue (Million), by Export Market Analysis (Value & Volume) 2025 & 2033
- Figure 57: Middle East and Africa Dragon Fruit Industry Revenue Share (%), by Export Market Analysis (Value & Volume) 2025 & 2033
- Figure 58: Middle East and Africa Dragon Fruit Industry Revenue (Million), by Price Trend Analysis 2025 & 2033
- Figure 59: Middle East and Africa Dragon Fruit Industry Revenue Share (%), by Price Trend Analysis 2025 & 2033
- Figure 60: Middle East and Africa Dragon Fruit Industry Revenue (Million), by Country 2025 & 2033
- Figure 61: Middle East and Africa Dragon Fruit Industry Revenue Share (%), by Country 2025 & 2033
List of Tables
- Table 1: Global Dragon Fruit Industry Revenue Million Forecast, by Production Analysis 2020 & 2033
- Table 2: Global Dragon Fruit Industry Revenue Million Forecast, by Consumption Analysis 2020 & 2033
- Table 3: Global Dragon Fruit Industry Revenue Million Forecast, by Import Market Analysis (Value & Volume) 2020 & 2033
- Table 4: Global Dragon Fruit Industry Revenue Million Forecast, by Export Market Analysis (Value & Volume) 2020 & 2033
- Table 5: Global Dragon Fruit Industry Revenue Million Forecast, by Price Trend Analysis 2020 & 2033
- Table 6: Global Dragon Fruit Industry Revenue Million Forecast, by Region 2020 & 2033
- Table 7: Global Dragon Fruit Industry Revenue Million Forecast, by Production Analysis 2020 & 2033
- Table 8: Global Dragon Fruit Industry Revenue Million Forecast, by Consumption Analysis 2020 & 2033
- Table 9: Global Dragon Fruit Industry Revenue Million Forecast, by Import Market Analysis (Value & Volume) 2020 & 2033
- Table 10: Global Dragon Fruit Industry Revenue Million Forecast, by Export Market Analysis (Value & Volume) 2020 & 2033
- Table 11: Global Dragon Fruit Industry Revenue Million Forecast, by Price Trend Analysis 2020 & 2033
- Table 12: Global Dragon Fruit Industry Revenue Million Forecast, by Country 2020 & 2033
- Table 13: United States Dragon Fruit Industry Revenue (Million) Forecast, by Application 2020 & 2033
- Table 14: Canada Dragon Fruit Industry Revenue (Million) Forecast, by Application 2020 & 2033
- Table 15: Mexico Dragon Fruit Industry Revenue (Million) Forecast, by Application 2020 & 2033
- Table 16: Global Dragon Fruit Industry Revenue Million Forecast, by Production Analysis 2020 & 2033
- Table 17: Global Dragon Fruit Industry Revenue Million Forecast, by Consumption Analysis 2020 & 2033
- Table 18: Global Dragon Fruit Industry Revenue Million Forecast, by Import Market Analysis (Value & Volume) 2020 & 2033
- Table 19: Global Dragon Fruit Industry Revenue Million Forecast, by Export Market Analysis (Value & Volume) 2020 & 2033
- Table 20: Global Dragon Fruit Industry Revenue Million Forecast, by Price Trend Analysis 2020 & 2033
- Table 21: Global Dragon Fruit Industry Revenue Million Forecast, by Country 2020 & 2033
- Table 22: Germany Dragon Fruit Industry Revenue (Million) Forecast, by Application 2020 & 2033
- Table 23: UK Dragon Fruit Industry Revenue (Million) Forecast, by Application 2020 & 2033
- Table 24: France Dragon Fruit Industry Revenue (Million) Forecast, by Application 2020 & 2033
- Table 25: Netherlands Dragon Fruit Industry Revenue (Million) Forecast, by Application 2020 & 2033
- Table 26: Global Dragon Fruit Industry Revenue Million Forecast, by Production Analysis 2020 & 2033
- Table 27: Global Dragon Fruit Industry Revenue Million Forecast, by Consumption Analysis 2020 & 2033
- Table 28: Global Dragon Fruit Industry Revenue Million Forecast, by Import Market Analysis (Value & Volume) 2020 & 2033
- Table 29: Global Dragon Fruit Industry Revenue Million Forecast, by Export Market Analysis (Value & Volume) 2020 & 2033
- Table 30: Global Dragon Fruit Industry Revenue Million Forecast, by Price Trend Analysis 2020 & 2033
- Table 31: Global Dragon Fruit Industry Revenue Million Forecast, by Country 2020 & 2033
- Table 32: China Dragon Fruit Industry Revenue (Million) Forecast, by Application 2020 & 2033
- Table 33: Vietnam Dragon Fruit Industry Revenue (Million) Forecast, by Application 2020 & 2033
- Table 34: Cambodia Dragon Fruit Industry Revenue (Million) Forecast, by Application 2020 & 2033
- Table 35: India Dragon Fruit Industry Revenue (Million) Forecast, by Application 2020 & 2033
- Table 36: Thailand Dragon Fruit Industry Revenue (Million) Forecast, by Application 2020 & 2033
- Table 37: Indonesia Dragon Fruit Industry Revenue (Million) Forecast, by Application 2020 & 2033
- Table 38: Global Dragon Fruit Industry Revenue Million Forecast, by Production Analysis 2020 & 2033
- Table 39: Global Dragon Fruit Industry Revenue Million Forecast, by Consumption Analysis 2020 & 2033
- Table 40: Global Dragon Fruit Industry Revenue Million Forecast, by Import Market Analysis (Value & Volume) 2020 & 2033
- Table 41: Global Dragon Fruit Industry Revenue Million Forecast, by Export Market Analysis (Value & Volume) 2020 & 2033
- Table 42: Global Dragon Fruit Industry Revenue Million Forecast, by Price Trend Analysis 2020 & 2033
- Table 43: Global Dragon Fruit Industry Revenue Million Forecast, by Country 2020 & 2033
- Table 44: Brazil Dragon Fruit Industry Revenue (Million) Forecast, by Application 2020 & 2033
- Table 45: Columbia Dragon Fruit Industry Revenue (Million) Forecast, by Application 2020 & 2033
- Table 46: Argentina Dragon Fruit Industry Revenue (Million) Forecast, by Application 2020 & 2033
- Table 47: Global Dragon Fruit Industry Revenue Million Forecast, by Production Analysis 2020 & 2033
- Table 48: Global Dragon Fruit Industry Revenue Million Forecast, by Consumption Analysis 2020 & 2033
- Table 49: Global Dragon Fruit Industry Revenue Million Forecast, by Import Market Analysis (Value & Volume) 2020 & 2033
- Table 50: Global Dragon Fruit Industry Revenue Million Forecast, by Export Market Analysis (Value & Volume) 2020 & 2033
- Table 51: Global Dragon Fruit Industry Revenue Million Forecast, by Price Trend Analysis 2020 & 2033
- Table 52: Global Dragon Fruit Industry Revenue Million Forecast, by Country 2020 & 2033
- Table 53: South Africa Dragon Fruit Industry Revenue (Million) Forecast, by Application 2020 & 2033
- Table 54: Israel Dragon Fruit Industry Revenue (Million) Forecast, by Application 2020 & 2033
- Table 55: Egypt Dragon Fruit Industry Revenue (Million) Forecast, by Application 2020 & 2033
Frequently Asked Questions
1. What is the projected Compound Annual Growth Rate (CAGR) of the Dragon Fruit Industry?
The projected CAGR is approximately 4.40%.
2. Which companies are prominent players in the Dragon Fruit Industry?
Key companies in the market include Tropical Fruit Corporation , Eurofresh , Agro Dragon Villa , Suncrest Farms , Dragon Fruit Growers of America , Miami Fruit , Fruit Lovers.
3. What are the main segments of the Dragon Fruit Industry?
The market segments include Production Analysis, Consumption Analysis, Import Market Analysis (Value & Volume), Export Market Analysis (Value & Volume), Price Trend Analysis.
4. Can you provide details about the market size?
The market size is estimated to be USD 14.73 Million as of 2022.
5. What are some drivers contributing to market growth?
Increasing Demand for Garlic Due to Various Uses in Industries; Rising Demad of Organic Garlic; Increasing Government Initiatives.
6. What are the notable trends driving market growth?
Growing Demand for Dragon Fruit in China.
7. Are there any restraints impacting market growth?
Lack of Technical Knowledge of Farmers; Price Fluctuations.
8. Can you provide examples of recent developments in the market?
N/A
9. What pricing options are available for accessing the report?
Pricing options include single-user, multi-user, and enterprise licenses priced at USD 4750, USD 5250, and USD 8750 respectively.
10. Is the market size provided in terms of value or volume?
The market size is provided in terms of value, measured in Million.
11. Are there any specific market keywords associated with the report?
Yes, the market keyword associated with the report is "Dragon Fruit Industry," which aids in identifying and referencing the specific market segment covered.
12. How do I determine which pricing option suits my needs best?
The pricing options vary based on user requirements and access needs. Individual users may opt for single-user licenses, while businesses requiring broader access may choose multi-user or enterprise licenses for cost-effective access to the report.
13. Are there any additional resources or data provided in the Dragon Fruit Industry report?
While the report offers comprehensive insights, it's advisable to review the specific contents or supplementary materials provided to ascertain if additional resources or data are available.
14. How can I stay updated on further developments or reports in the Dragon Fruit Industry?
To stay informed about further developments, trends, and reports in the Dragon Fruit Industry, consider subscribing to industry newsletters, following relevant companies and organizations, or regularly checking reputable industry news sources and publications.
Methodology
Step 1 - Identification of Relevant Samples Size from Population Database


Step 2 - Approaches for Defining Global Market Size (Value, Volume* & Price*)

Note*: In applicable scenarios
Step 3 - Data Sources
Primary Research
- Web Analytics
- Survey Reports
- Research Institute
- Latest Research Reports
- Opinion Leaders
Secondary Research
- Annual Reports
- White Paper
- Latest Press Release
- Industry Association
- Paid Database
- Investor Presentations

Step 4 - Data Triangulation
Involves using different sources of information in order to increase the validity of a study
These sources are likely to be stakeholders in a program - participants, other researchers, program staff, other community members, and so on.
Then we put all data in single framework & apply various statistical tools to find out the dynamic on the market.
During the analysis stage, feedback from the stakeholder groups would be compared to determine areas of agreement as well as areas of divergence