

Key Insights
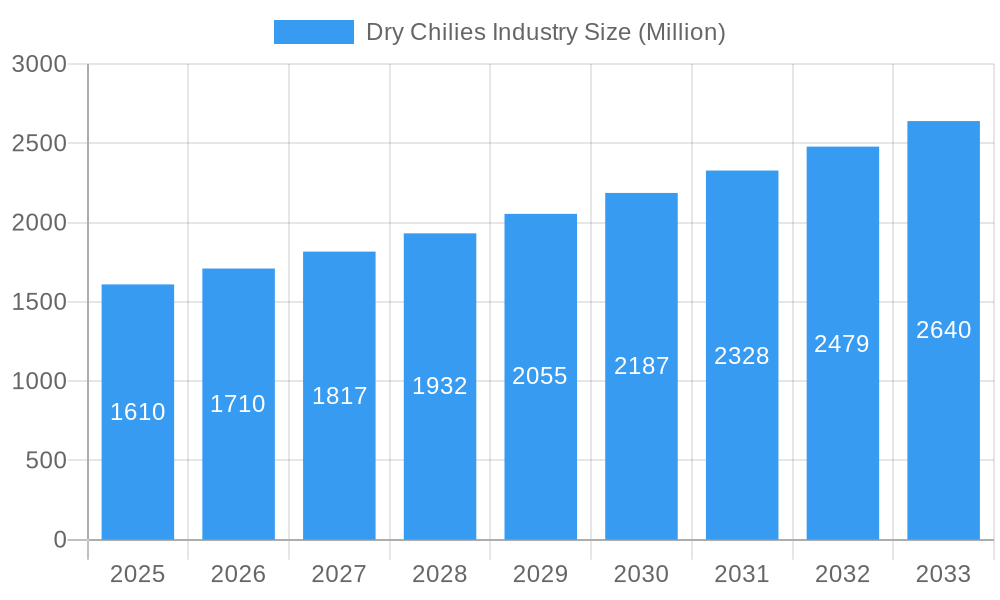
The global dry chilies market, valued at $1.61 billion in 2025, is projected to experience robust growth, driven by a Compound Annual Growth Rate (CAGR) of 6.11% from 2025 to 2033. This expansion is fueled by several key factors. Increasing demand from the food and beverage industry, particularly in developing economies with burgeoning populations and rising disposable incomes, significantly contributes to market growth. The use of dry chilies as a key ingredient in various cuisines worldwide, ranging from traditional dishes to modern culinary innovations, ensures consistent demand. Furthermore, the growing popularity of spicy food globally further propels market expansion. The pharmaceutical and cosmetic industries also represent emerging segments, utilizing chili extracts for their medicinal and cosmetic properties. However, factors such as fluctuating chili prices due to weather patterns and crop yields, and potential supply chain disruptions, pose challenges to consistent market growth. Regional variations in market size are expected, with North America and Asia Pacific likely dominating due to high consumption rates and established production bases. The market is segmented by product type (Guajillo, Ancho, Chipotle, Pasilla, California Chili) and application (food and beverage, pharmaceuticals, cosmetics, pesticides), offering various avenues for market participants. Key players such as Syngenta India, Sunrise Foods, Laxmi Organic Industries, AIC India, and Rico Company are actively shaping the market landscape through innovation and expansion. The forecast period (2025-2033) is expected to witness significant market penetration in regions with growing demand for convenience foods and ready-to-eat meals, which are often incorporated with dry chilies.
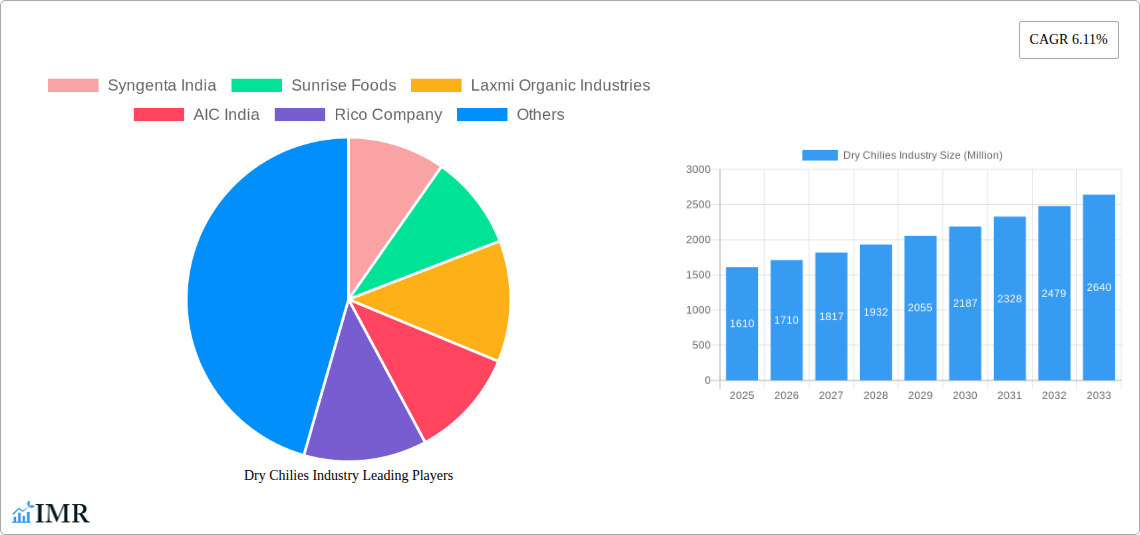
Dry Chilies Industry Market Size (In Billion)
The competitive landscape is characterized by both large multinational corporations and smaller regional players. Larger companies leverage their extensive distribution networks and advanced processing techniques, while smaller players focus on niche markets and specialized chili varieties. Future growth will be influenced by technological advancements in chili processing, packaging, and preservation, as well as increasing consumer awareness of the health benefits associated with chili consumption. Sustainability concerns regarding chili cultivation and environmental impact will also play a significant role in shaping the market in the coming years. Market participants are investing in sustainable farming practices and exploring innovative solutions to address supply chain challenges and ensure consistent product quality. The overall outlook for the dry chilies market remains optimistic, driven by increasing consumption, diversification of applications, and ongoing innovations within the industry.
Dry Chilies Industry Company Market Share
Dry Chilies Industry: A Comprehensive Market Report (2019-2033)
This in-depth report provides a comprehensive analysis of the global dry chilies industry, encompassing market dynamics, growth trends, regional segmentation, product landscape, and key players. The study period covers 2019-2033, with a base year of 2025 and a forecast period of 2025-2033. The report is essential for industry professionals, investors, and researchers seeking a detailed understanding of this dynamic market. The report is presented in Million units.
Dry Chilies Industry Market Dynamics & Structure
This section analyzes the competitive landscape of the dry chilies market, focusing on market concentration, technological innovations, regulatory frameworks, substitute products, end-user demographics, and mergers & acquisitions (M&A) activities. The global dry chilies market is moderately fragmented, with key players holding significant market shares. The market is characterized by both large multinational corporations and smaller regional players. The analysis incorporates quantitative data on market share, M&A deal volumes (xx deals in the historical period), and qualitative factors such as innovation barriers (high initial investment costs for new processing technologies).
- Market Concentration: Moderately fragmented, with top 5 players holding xx% market share in 2024.
- Technological Innovation: Focus on improving yield, quality, and processing efficiency through hybrid seeds and advanced drying techniques.
- Regulatory Framework: Varies across regions, impacting production, trade, and labeling. Stringent food safety regulations are driving adoption of better practices.
- Competitive Substitutes: Other spices and flavorings present a degree of competition, but dry chilies maintain their unique flavor profile and applications.
- End-User Demographics: Primarily driven by the food and beverage industry, with growing demand from pharmaceuticals and cosmetics sectors.
- M&A Trends: Consolidation expected to continue, with larger players acquiring smaller companies to expand their market reach and product portfolio.
Dry Chilies Industry Growth Trends & Insights
This section examines the historical and projected growth of the dry chilies market. Leveraging extensive market research data, the report analyzes the evolution of market size (xx Million units in 2024, projected to reach xx Million units by 2033), adoption rates, technological disruptions (e.g., automation in processing), and evolving consumer preferences (e.g., demand for organic and sustainably sourced chilies). Key metrics like Compound Annual Growth Rate (CAGR) (xx%) and market penetration rates (xx%) are provided for in-depth insights. Specific regional market growth is also addressed, considering factors such as climate change, consumer preference shift toward healthier food, and changing consumer lifestyle.
Dominant Regions, Countries, or Segments in Dry Chilies Industry
This section identifies the leading regions, countries, and segments within the global dry chilies market, with a keen focus on the underlying factors propelling its expansion. Our analysis will encompass key geographical powerhouses, including but not limited to, **India**, **Mexico**, and **China**, which are pivotal to the global supply chain. Furthermore, we will delve into the major product segments, such as **Guajillo**, **Ancho**, **Chipotle**, **Pasilla**, and **California Chili**, and explore their diverse applications across the **Food & Beverage**, **Pharmaceuticals**, **Cosmetics**, and **Pesticides** sectors. Notably, the **Food and Beverage industry** stands out as the dominant segment, and we will dissect the primary contributors to this prominence:
- Food and Beverage Industry Dominance: This segment reigns supreme as the largest application area. Its growth is intrinsically linked to the escalating global appetite for spicy cuisines, a burgeoning trend that sees chilies integrated into a vast array of prepared meals, savory snacks, and innovative culinary creations.
- Key Drivers: The expansion of the global food processing industry, a sustained increase in the demand for convenient and processed food products, and the steady growth of the world's population are significant forces driving this segment forward.
- Growth Potential: The dry chilies market holds substantial growth potential, particularly within emerging economies. This is fueled by rising disposable incomes, evolving dietary preferences towards more flavorful and diverse options, and an increasing awareness of the health benefits associated with chili consumption.
Dry Chilies Industry Product Landscape
The dry chilies market offers a diverse range of product types, each with unique characteristics and applications. Innovations focus on improved processing techniques to enhance quality, consistency, and shelf life. These innovations are primarily centered around processing methods, resulting in products with improved flavor, color, and texture. Unique selling propositions include organic certification, specific flavor profiles, and customized blends for different applications.
Key Drivers, Barriers & Challenges in Dry Chilies Industry
Key Drivers:
- Growing demand from the food and beverage industry.
- Increasing popularity of spicy foods globally.
- Technological advancements in processing and preservation techniques.
Challenges & Restraints:
- Weather-dependent yields and fluctuating prices.
- Supply chain disruptions and logistics challenges.
- Competition from other spices and flavorings.
- xx% of the crop is lost due to post-harvest losses in many developing countries.
Emerging Opportunities in Dry Chilies Industry
Emerging opportunities exist in untapped markets, particularly in developing economies with growing populations and increasing demand for processed foods. The development of innovative products, such as chili-infused oils, extracts, and powders, is creating new avenues for growth. Moreover, the increasing adoption of sustainable farming practices presents significant potential.
Growth Accelerators in the Dry Chilies Industry
The sustained long-term growth of the dry chilies industry is poised to be significantly influenced by **technological breakthroughs** in processing and preservation. Innovations in these areas promise to enhance chili quality, extend shelf life, and reduce post-harvest losses, thereby improving efficiency and market accessibility. Furthermore, fostering **strategic partnerships** between raw material producers and downstream processors is essential. These collaborations can optimize supply chains, ensure consistent quality, and ultimately reduce operational costs. **Geographical market expansion**, especially into regions exhibiting high growth potential and increasing consumer demand for chili-infused products, will be a critical strategy for achieving sustained and robust market growth.
Key Players Shaping the Dry Chilies Industry Market
- Syngenta India: A major player in agricultural solutions, contributing to the production and supply of quality chilies.
- Sunrise Foods: A significant contributor to the processing and distribution of dry chilies.
- Laxmi Organic Industries: Involved in the chemical and specialty ingredients sector, potentially impacting chili derivatives and applications.
- AIC India (Agriculture Insurance Company of India): Plays a role in risk mitigation for farmers, indirectly supporting stable chili production.
- Rico Company: A key entity in the market, likely involved in various aspects of the dry chilies value chain, from sourcing to distribution.
Notable Milestones in Dry Chilies Industry Sector
- June 2022: Syngenta India and the Agriculture Insurance Company of India (AIC) forged a strategic partnership aimed at mitigating price volatility risks for chili farmers, thereby promoting greater stability and predictability in the sector.
- November 2022: The Indonesian government took proactive steps by implementing robust policies designed to stimulate and bolster domestic chili production, with the strategic objective of reducing the nation's reliance on imported chilies and strengthening local supply chains.
In-Depth Dry Chilies Industry Market Outlook
The future trajectory of the dry chilies industry is exceptionally promising, characterized by sustained expansion driven by consistently increasing global demand and the continuous evolution of technological advancements. For companies aiming to maintain and enhance their competitive edge, **strategic investments** in sustainable farming practices, ethical sourcing, and innovative product development will be paramount. Furthermore, **expanding into new and untapped markets** coupled with the cultivation of **strategic partnerships** across the value chain offer significant and lucrative opportunities for achieving long-term market success. The industry is anticipated to witness a robust and accelerated growth phase in the forthcoming forecast period, propelled by the cumulative impact of the aforementioned market dynamics and strategic initiatives.
Dry Chilies Industry Segmentation
- 1. Production Analysis
- 2. Consumption Analysis
- 3. Import Market Analysis (Value & Volume)
- 4. Export Market Analysis (Value & Volume)
- 5. Price Trend Analysis
Dry Chilies Industry Segmentation By Geography
-
1. North America
- 1.1. United States
- 1.2. Canada
- 1.3. Mexico
-
2. Europe
- 2.1. United Kingdom
- 2.2. Germany
- 2.3. France
- 2.4. Spain
-
3. Asia Pacific
- 3.1. China
- 3.2. Australia
- 3.3. India
-
4. South America
- 4.1. Brazil
- 4.2. Argentina
-
5. Africa
- 5.1. South Africa
- 5.2. Egypt
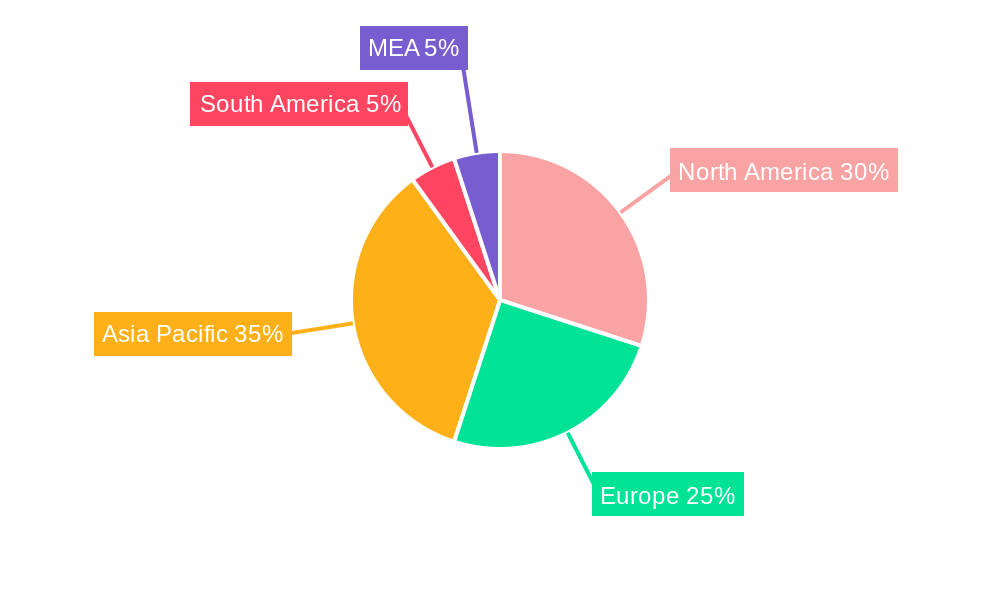
Dry Chilies Industry Regional Market Share
Geographic Coverage of Dry Chilies Industry
Dry Chilies Industry REPORT HIGHLIGHTS
| Aspects | Details |
|---|---|
| Study Period | 2020-2034 |
| Base Year | 2025 |
| Estimated Year | 2026 |
| Forecast Period | 2026-2034 |
| Historical Period | 2020-2025 |
| Growth Rate | CAGR of 6.11% from 2020-2034 |
| Segmentation |
|
Table of Contents
- 1. Introduction
- 1.1. Research Scope
- 1.2. Market Segmentation
- 1.3. Research Objective
- 1.4. Definitions and Assumptions
- 2. Executive Summary
- 2.1. Market Snapshot
- 3. Market Dynamics
- 3.1. Market Drivers
- 3.2. Market Restrains
- 3.3. Market Trends
- 3.4. Market Opportunities
- 4. Market Factor Analysis
- 4.1. Porters Five Forces
- 4.1.1. Bargaining Power of Suppliers
- 4.1.2. Bargaining Power of Buyers
- 4.1.3. Threat of New Entrants
- 4.1.4. Threat of Substitutes
- 4.1.5. Competitive Rivalry
- 4.2. PESTEL analysis
- 4.3. BCG Analysis
- 4.3.1. Stars (High Growth, High Market Share)
- 4.3.2. Cash Cows (Low Growth, High Market Share)
- 4.3.3. Question Mark (High Growth, Low Market Share)
- 4.3.4. Dogs (Low Growth, Low Market Share)
- 4.4. Ansoff Matrix Analysis
- 4.5. Supply Chain Analysis
- 4.6. Regulatory Landscape
- 4.7. Current Market Potential and Opportunity Assessment (TAM–SAM–SOM Framework)
- 4.8. IMR Analyst Note
- 4.1. Porters Five Forces
- 5. Market Analysis, Insights and Forecast 2021-2033
- 5.1. Market Analysis, Insights and Forecast - by Production Analysis
- 5.2. Market Analysis, Insights and Forecast - by Consumption Analysis
- 5.3. Market Analysis, Insights and Forecast - by Import Market Analysis (Value & Volume)
- 5.4. Market Analysis, Insights and Forecast - by Export Market Analysis (Value & Volume)
- 5.5. Market Analysis, Insights and Forecast - by Price Trend Analysis
- 5.6. Market Analysis, Insights and Forecast - by Region
- 5.6.1. North America
- 5.6.2. Europe
- 5.6.3. Asia Pacific
- 5.6.4. South America
- 5.6.5. Africa
- 6. Global Dry Chilies Industry Analysis, Insights and Forecast, 2021-2033
- 6.1. Market Analysis, Insights and Forecast - by Production Analysis
- 6.2. Market Analysis, Insights and Forecast - by Consumption Analysis
- 6.3. Market Analysis, Insights and Forecast - by Import Market Analysis (Value & Volume)
- 6.4. Market Analysis, Insights and Forecast - by Export Market Analysis (Value & Volume)
- 6.5. Market Analysis, Insights and Forecast - by Price Trend Analysis
- 7. North America Dry Chilies Industry Analysis, Insights and Forecast, 2020-2032
- 7.1. Market Analysis, Insights and Forecast - by Production Analysis
- 7.2. Market Analysis, Insights and Forecast - by Consumption Analysis
- 7.3. Market Analysis, Insights and Forecast - by Import Market Analysis (Value & Volume)
- 7.4. Market Analysis, Insights and Forecast - by Export Market Analysis (Value & Volume)
- 7.5. Market Analysis, Insights and Forecast - by Price Trend Analysis
- 8. Europe Dry Chilies Industry Analysis, Insights and Forecast, 2020-2032
- 8.1. Market Analysis, Insights and Forecast - by Production Analysis
- 8.2. Market Analysis, Insights and Forecast - by Consumption Analysis
- 8.3. Market Analysis, Insights and Forecast - by Import Market Analysis (Value & Volume)
- 8.4. Market Analysis, Insights and Forecast - by Export Market Analysis (Value & Volume)
- 8.5. Market Analysis, Insights and Forecast - by Price Trend Analysis
- 9. Asia Pacific Dry Chilies Industry Analysis, Insights and Forecast, 2020-2032
- 9.1. Market Analysis, Insights and Forecast - by Production Analysis
- 9.2. Market Analysis, Insights and Forecast - by Consumption Analysis
- 9.3. Market Analysis, Insights and Forecast - by Import Market Analysis (Value & Volume)
- 9.4. Market Analysis, Insights and Forecast - by Export Market Analysis (Value & Volume)
- 9.5. Market Analysis, Insights and Forecast - by Price Trend Analysis
- 10. South America Dry Chilies Industry Analysis, Insights and Forecast, 2020-2032
- 10.1. Market Analysis, Insights and Forecast - by Production Analysis
- 10.2. Market Analysis, Insights and Forecast - by Consumption Analysis
- 10.3. Market Analysis, Insights and Forecast - by Import Market Analysis (Value & Volume)
- 10.4. Market Analysis, Insights and Forecast - by Export Market Analysis (Value & Volume)
- 10.5. Market Analysis, Insights and Forecast - by Price Trend Analysis
- 11. Africa Dry Chilies Industry Analysis, Insights and Forecast, 2020-2032
- 11.1. Market Analysis, Insights and Forecast - by Production Analysis
- 11.2. Market Analysis, Insights and Forecast - by Consumption Analysis
- 11.3. Market Analysis, Insights and Forecast - by Import Market Analysis (Value & Volume)
- 11.4. Market Analysis, Insights and Forecast - by Export Market Analysis (Value & Volume)
- 11.5. Market Analysis, Insights and Forecast - by Price Trend Analysis
- 12. Competitive Analysis
- 12.1. Company Profiles
- 12.1.1 Syngenta India
- 12.1.1.1. Company Overview
- 12.1.1.2. Products
- 12.1.1.3. Company Financials
- 12.1.1.4. SWOT Analysis
- 12.1.2 Sunrise Foods
- 12.1.2.1. Company Overview
- 12.1.2.2. Products
- 12.1.2.3. Company Financials
- 12.1.2.4. SWOT Analysis
- 12.1.3 Laxmi Organic Industries
- 12.1.3.1. Company Overview
- 12.1.3.2. Products
- 12.1.3.3. Company Financials
- 12.1.3.4. SWOT Analysis
- 12.1.4 AIC India
- 12.1.4.1. Company Overview
- 12.1.4.2. Products
- 12.1.4.3. Company Financials
- 12.1.4.4. SWOT Analysis
- 12.1.5 Rico Company
- 12.1.5.1. Company Overview
- 12.1.5.2. Products
- 12.1.5.3. Company Financials
- 12.1.5.4. SWOT Analysis
- 12.1.1 Syngenta India
- 12.2. Market Entropy
- 12.2.1 Company's Key Areas Served
- 12.2.2 Recent Developments
- 12.3. Company Market Share Analysis 2025
- 12.3.1 Top 5 Companies Market Share Analysis
- 12.3.2 Top 3 Companies Market Share Analysis
- 12.4. List of Potential Customers
- 13. Research Methodology
List of Figures
- Figure 1: Global Dry Chilies Industry Revenue Breakdown (Million, %) by Region 2025 & 2033
- Figure 2: North America Dry Chilies Industry Revenue (Million), by Production Analysis 2025 & 2033
- Figure 3: North America Dry Chilies Industry Revenue Share (%), by Production Analysis 2025 & 2033
- Figure 4: North America Dry Chilies Industry Revenue (Million), by Consumption Analysis 2025 & 2033
- Figure 5: North America Dry Chilies Industry Revenue Share (%), by Consumption Analysis 2025 & 2033
- Figure 6: North America Dry Chilies Industry Revenue (Million), by Import Market Analysis (Value & Volume) 2025 & 2033
- Figure 7: North America Dry Chilies Industry Revenue Share (%), by Import Market Analysis (Value & Volume) 2025 & 2033
- Figure 8: North America Dry Chilies Industry Revenue (Million), by Export Market Analysis (Value & Volume) 2025 & 2033
- Figure 9: North America Dry Chilies Industry Revenue Share (%), by Export Market Analysis (Value & Volume) 2025 & 2033
- Figure 10: North America Dry Chilies Industry Revenue (Million), by Price Trend Analysis 2025 & 2033
- Figure 11: North America Dry Chilies Industry Revenue Share (%), by Price Trend Analysis 2025 & 2033
- Figure 12: North America Dry Chilies Industry Revenue (Million), by Country 2025 & 2033
- Figure 13: North America Dry Chilies Industry Revenue Share (%), by Country 2025 & 2033
- Figure 14: Europe Dry Chilies Industry Revenue (Million), by Production Analysis 2025 & 2033
- Figure 15: Europe Dry Chilies Industry Revenue Share (%), by Production Analysis 2025 & 2033
- Figure 16: Europe Dry Chilies Industry Revenue (Million), by Consumption Analysis 2025 & 2033
- Figure 17: Europe Dry Chilies Industry Revenue Share (%), by Consumption Analysis 2025 & 2033
- Figure 18: Europe Dry Chilies Industry Revenue (Million), by Import Market Analysis (Value & Volume) 2025 & 2033
- Figure 19: Europe Dry Chilies Industry Revenue Share (%), by Import Market Analysis (Value & Volume) 2025 & 2033
- Figure 20: Europe Dry Chilies Industry Revenue (Million), by Export Market Analysis (Value & Volume) 2025 & 2033
- Figure 21: Europe Dry Chilies Industry Revenue Share (%), by Export Market Analysis (Value & Volume) 2025 & 2033
- Figure 22: Europe Dry Chilies Industry Revenue (Million), by Price Trend Analysis 2025 & 2033
- Figure 23: Europe Dry Chilies Industry Revenue Share (%), by Price Trend Analysis 2025 & 2033
- Figure 24: Europe Dry Chilies Industry Revenue (Million), by Country 2025 & 2033
- Figure 25: Europe Dry Chilies Industry Revenue Share (%), by Country 2025 & 2033
- Figure 26: Asia Pacific Dry Chilies Industry Revenue (Million), by Production Analysis 2025 & 2033
- Figure 27: Asia Pacific Dry Chilies Industry Revenue Share (%), by Production Analysis 2025 & 2033
- Figure 28: Asia Pacific Dry Chilies Industry Revenue (Million), by Consumption Analysis 2025 & 2033
- Figure 29: Asia Pacific Dry Chilies Industry Revenue Share (%), by Consumption Analysis 2025 & 2033
- Figure 30: Asia Pacific Dry Chilies Industry Revenue (Million), by Import Market Analysis (Value & Volume) 2025 & 2033
- Figure 31: Asia Pacific Dry Chilies Industry Revenue Share (%), by Import Market Analysis (Value & Volume) 2025 & 2033
- Figure 32: Asia Pacific Dry Chilies Industry Revenue (Million), by Export Market Analysis (Value & Volume) 2025 & 2033
- Figure 33: Asia Pacific Dry Chilies Industry Revenue Share (%), by Export Market Analysis (Value & Volume) 2025 & 2033
- Figure 34: Asia Pacific Dry Chilies Industry Revenue (Million), by Price Trend Analysis 2025 & 2033
- Figure 35: Asia Pacific Dry Chilies Industry Revenue Share (%), by Price Trend Analysis 2025 & 2033
- Figure 36: Asia Pacific Dry Chilies Industry Revenue (Million), by Country 2025 & 2033
- Figure 37: Asia Pacific Dry Chilies Industry Revenue Share (%), by Country 2025 & 2033
- Figure 38: South America Dry Chilies Industry Revenue (Million), by Production Analysis 2025 & 2033
- Figure 39: South America Dry Chilies Industry Revenue Share (%), by Production Analysis 2025 & 2033
- Figure 40: South America Dry Chilies Industry Revenue (Million), by Consumption Analysis 2025 & 2033
- Figure 41: South America Dry Chilies Industry Revenue Share (%), by Consumption Analysis 2025 & 2033
- Figure 42: South America Dry Chilies Industry Revenue (Million), by Import Market Analysis (Value & Volume) 2025 & 2033
- Figure 43: South America Dry Chilies Industry Revenue Share (%), by Import Market Analysis (Value & Volume) 2025 & 2033
- Figure 44: South America Dry Chilies Industry Revenue (Million), by Export Market Analysis (Value & Volume) 2025 & 2033
- Figure 45: South America Dry Chilies Industry Revenue Share (%), by Export Market Analysis (Value & Volume) 2025 & 2033
- Figure 46: South America Dry Chilies Industry Revenue (Million), by Price Trend Analysis 2025 & 2033
- Figure 47: South America Dry Chilies Industry Revenue Share (%), by Price Trend Analysis 2025 & 2033
- Figure 48: South America Dry Chilies Industry Revenue (Million), by Country 2025 & 2033
- Figure 49: South America Dry Chilies Industry Revenue Share (%), by Country 2025 & 2033
- Figure 50: Africa Dry Chilies Industry Revenue (Million), by Production Analysis 2025 & 2033
- Figure 51: Africa Dry Chilies Industry Revenue Share (%), by Production Analysis 2025 & 2033
- Figure 52: Africa Dry Chilies Industry Revenue (Million), by Consumption Analysis 2025 & 2033
- Figure 53: Africa Dry Chilies Industry Revenue Share (%), by Consumption Analysis 2025 & 2033
- Figure 54: Africa Dry Chilies Industry Revenue (Million), by Import Market Analysis (Value & Volume) 2025 & 2033
- Figure 55: Africa Dry Chilies Industry Revenue Share (%), by Import Market Analysis (Value & Volume) 2025 & 2033
- Figure 56: Africa Dry Chilies Industry Revenue (Million), by Export Market Analysis (Value & Volume) 2025 & 2033
- Figure 57: Africa Dry Chilies Industry Revenue Share (%), by Export Market Analysis (Value & Volume) 2025 & 2033
- Figure 58: Africa Dry Chilies Industry Revenue (Million), by Price Trend Analysis 2025 & 2033
- Figure 59: Africa Dry Chilies Industry Revenue Share (%), by Price Trend Analysis 2025 & 2033
- Figure 60: Africa Dry Chilies Industry Revenue (Million), by Country 2025 & 2033
- Figure 61: Africa Dry Chilies Industry Revenue Share (%), by Country 2025 & 2033
List of Tables
- Table 1: Global Dry Chilies Industry Revenue Million Forecast, by Production Analysis 2020 & 2033
- Table 2: Global Dry Chilies Industry Revenue Million Forecast, by Consumption Analysis 2020 & 2033
- Table 3: Global Dry Chilies Industry Revenue Million Forecast, by Import Market Analysis (Value & Volume) 2020 & 2033
- Table 4: Global Dry Chilies Industry Revenue Million Forecast, by Export Market Analysis (Value & Volume) 2020 & 2033
- Table 5: Global Dry Chilies Industry Revenue Million Forecast, by Price Trend Analysis 2020 & 2033
- Table 6: Global Dry Chilies Industry Revenue Million Forecast, by Region 2020 & 2033
- Table 7: Global Dry Chilies Industry Revenue Million Forecast, by Production Analysis 2020 & 2033
- Table 8: Global Dry Chilies Industry Revenue Million Forecast, by Consumption Analysis 2020 & 2033
- Table 9: Global Dry Chilies Industry Revenue Million Forecast, by Import Market Analysis (Value & Volume) 2020 & 2033
- Table 10: Global Dry Chilies Industry Revenue Million Forecast, by Export Market Analysis (Value & Volume) 2020 & 2033
- Table 11: Global Dry Chilies Industry Revenue Million Forecast, by Price Trend Analysis 2020 & 2033
- Table 12: Global Dry Chilies Industry Revenue Million Forecast, by Country 2020 & 2033
- Table 13: United States Dry Chilies Industry Revenue (Million) Forecast, by Application 2020 & 2033
- Table 14: Canada Dry Chilies Industry Revenue (Million) Forecast, by Application 2020 & 2033
- Table 15: Mexico Dry Chilies Industry Revenue (Million) Forecast, by Application 2020 & 2033
- Table 16: Global Dry Chilies Industry Revenue Million Forecast, by Production Analysis 2020 & 2033
- Table 17: Global Dry Chilies Industry Revenue Million Forecast, by Consumption Analysis 2020 & 2033
- Table 18: Global Dry Chilies Industry Revenue Million Forecast, by Import Market Analysis (Value & Volume) 2020 & 2033
- Table 19: Global Dry Chilies Industry Revenue Million Forecast, by Export Market Analysis (Value & Volume) 2020 & 2033
- Table 20: Global Dry Chilies Industry Revenue Million Forecast, by Price Trend Analysis 2020 & 2033
- Table 21: Global Dry Chilies Industry Revenue Million Forecast, by Country 2020 & 2033
- Table 22: United Kingdom Dry Chilies Industry Revenue (Million) Forecast, by Application 2020 & 2033
- Table 23: Germany Dry Chilies Industry Revenue (Million) Forecast, by Application 2020 & 2033
- Table 24: France Dry Chilies Industry Revenue (Million) Forecast, by Application 2020 & 2033
- Table 25: Spain Dry Chilies Industry Revenue (Million) Forecast, by Application 2020 & 2033
- Table 26: Global Dry Chilies Industry Revenue Million Forecast, by Production Analysis 2020 & 2033
- Table 27: Global Dry Chilies Industry Revenue Million Forecast, by Consumption Analysis 2020 & 2033
- Table 28: Global Dry Chilies Industry Revenue Million Forecast, by Import Market Analysis (Value & Volume) 2020 & 2033
- Table 29: Global Dry Chilies Industry Revenue Million Forecast, by Export Market Analysis (Value & Volume) 2020 & 2033
- Table 30: Global Dry Chilies Industry Revenue Million Forecast, by Price Trend Analysis 2020 & 2033
- Table 31: Global Dry Chilies Industry Revenue Million Forecast, by Country 2020 & 2033
- Table 32: China Dry Chilies Industry Revenue (Million) Forecast, by Application 2020 & 2033
- Table 33: Australia Dry Chilies Industry Revenue (Million) Forecast, by Application 2020 & 2033
- Table 34: India Dry Chilies Industry Revenue (Million) Forecast, by Application 2020 & 2033
- Table 35: Global Dry Chilies Industry Revenue Million Forecast, by Production Analysis 2020 & 2033
- Table 36: Global Dry Chilies Industry Revenue Million Forecast, by Consumption Analysis 2020 & 2033
- Table 37: Global Dry Chilies Industry Revenue Million Forecast, by Import Market Analysis (Value & Volume) 2020 & 2033
- Table 38: Global Dry Chilies Industry Revenue Million Forecast, by Export Market Analysis (Value & Volume) 2020 & 2033
- Table 39: Global Dry Chilies Industry Revenue Million Forecast, by Price Trend Analysis 2020 & 2033
- Table 40: Global Dry Chilies Industry Revenue Million Forecast, by Country 2020 & 2033
- Table 41: Brazil Dry Chilies Industry Revenue (Million) Forecast, by Application 2020 & 2033
- Table 42: Argentina Dry Chilies Industry Revenue (Million) Forecast, by Application 2020 & 2033
- Table 43: Global Dry Chilies Industry Revenue Million Forecast, by Production Analysis 2020 & 2033
- Table 44: Global Dry Chilies Industry Revenue Million Forecast, by Consumption Analysis 2020 & 2033
- Table 45: Global Dry Chilies Industry Revenue Million Forecast, by Import Market Analysis (Value & Volume) 2020 & 2033
- Table 46: Global Dry Chilies Industry Revenue Million Forecast, by Export Market Analysis (Value & Volume) 2020 & 2033
- Table 47: Global Dry Chilies Industry Revenue Million Forecast, by Price Trend Analysis 2020 & 2033
- Table 48: Global Dry Chilies Industry Revenue Million Forecast, by Country 2020 & 2033
- Table 49: South Africa Dry Chilies Industry Revenue (Million) Forecast, by Application 2020 & 2033
- Table 50: Egypt Dry Chilies Industry Revenue (Million) Forecast, by Application 2020 & 2033
Frequently Asked Questions
1. What is the projected Compound Annual Growth Rate (CAGR) of the Dry Chilies Industry?
The projected CAGR is approximately 6.11%.
2. Which companies are prominent players in the Dry Chilies Industry?
Key companies in the market include Syngenta India, Sunrise Foods, Laxmi Organic Industries, AIC India, Rico Company.
3. What are the main segments of the Dry Chilies Industry?
The market segments include Production Analysis, Consumption Analysis, Import Market Analysis (Value & Volume), Export Market Analysis (Value & Volume), Price Trend Analysis.
4. Can you provide details about the market size?
The market size is estimated to be USD 1.61 Million as of 2022.
5. What are some drivers contributing to market growth?
Increasing Berry Consumption for Health Benefits; Increasing Adoption of High-Technology Farm Practices; Growing Usage of Berries in the Food and Beverage Industries.
6. What are the notable trends driving market growth?
High Demand for the Exotic and Spicy Oriental Dishes.
7. Are there any restraints impacting market growth?
High Production Cost Involved in Berry Production; Increasing Disease and Pest Infestations.
8. Can you provide examples of recent developments in the market?
November 2022: The Indonesian government increased domestic production of chilies rather than importing them from abroad, and to do this, it implemented strategic policies for chili development using hybrid seeds, complete and balanced fertilization, better irrigation infrastructure and farming roads, increasing the capacity of farmers' resources, and expanding the goals and market segments.
9. What pricing options are available for accessing the report?
Pricing options include single-user, multi-user, and enterprise licenses priced at USD 4750, USD 5250, and USD 8750 respectively.
10. Is the market size provided in terms of value or volume?
The market size is provided in terms of value, measured in Million.
11. Are there any specific market keywords associated with the report?
Yes, the market keyword associated with the report is "Dry Chilies Industry," which aids in identifying and referencing the specific market segment covered.
12. How do I determine which pricing option suits my needs best?
The pricing options vary based on user requirements and access needs. Individual users may opt for single-user licenses, while businesses requiring broader access may choose multi-user or enterprise licenses for cost-effective access to the report.
13. Are there any additional resources or data provided in the Dry Chilies Industry report?
While the report offers comprehensive insights, it's advisable to review the specific contents or supplementary materials provided to ascertain if additional resources or data are available.
14. How can I stay updated on further developments or reports in the Dry Chilies Industry?
To stay informed about further developments, trends, and reports in the Dry Chilies Industry, consider subscribing to industry newsletters, following relevant companies and organizations, or regularly checking reputable industry news sources and publications.
Methodology
Step 1 - Identification of Relevant Samples Size from Population Database


Step 2 - Approaches for Defining Global Market Size (Value, Volume* & Price*)

Note*: In applicable scenarios
Step 3 - Data Sources
Primary Research
- Web Analytics
- Survey Reports
- Research Institute
- Latest Research Reports
- Opinion Leaders
Secondary Research
- Annual Reports
- White Paper
- Latest Press Release
- Industry Association
- Paid Database
- Investor Presentations

Step 4 - Data Triangulation
Involves using different sources of information in order to increase the validity of a study
These sources are likely to be stakeholders in a program - participants, other researchers, program staff, other community members, and so on.
Then we put all data in single framework & apply various statistical tools to find out the dynamic on the market.
During the analysis stage, feedback from the stakeholder groups would be compared to determine areas of agreement as well as areas of divergence