

Key Insights
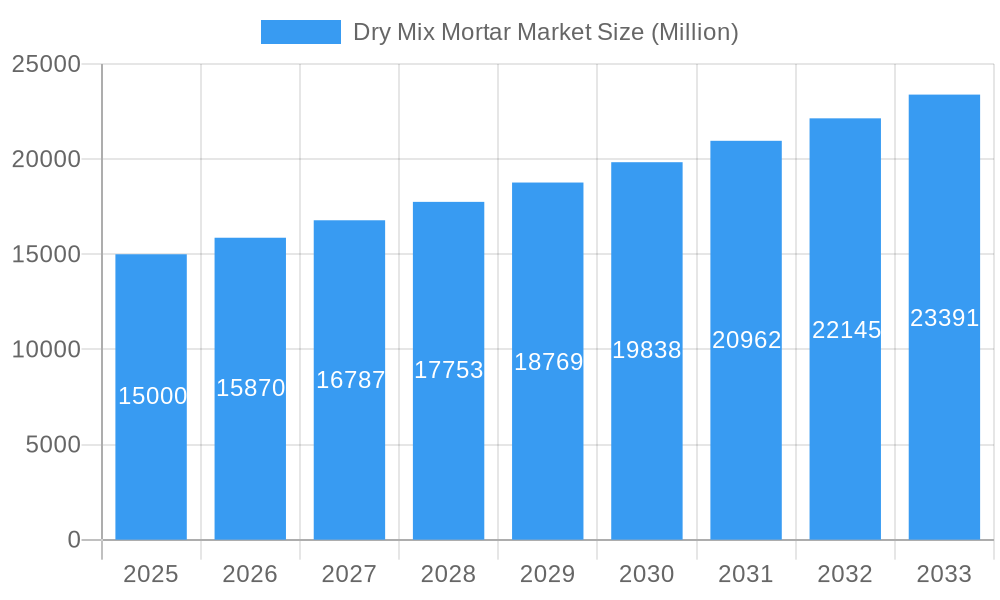
The global dry mix mortar market is poised for substantial expansion, projected to reach significant value by 2033. Driven by a Compound Annual Growth Rate (CAGR) of 4.7% from 2024 to 2033, this growth is underpinned by increasing urbanization and robust infrastructure development worldwide. Dry mix mortars offer superior workability, enhanced durability, and ease of application, making them a preferred choice over traditional on-site mixing. The market also benefits from the growing adoption of sustainable construction practices and the demand for energy-efficient buildings. Key growth segments include concrete protection and renovation, addressing the needs of aging infrastructure. While the residential sector maintains consistent demand, commercial, industrial, and infrastructure projects are significant volume drivers. Market leaders are actively pursuing product innovation and R&D to enhance performance. Potential challenges include raw material price volatility and evolving environmental regulations. The Asia-Pacific and North America regions are expected to lead market growth due to extensive construction activities and infrastructure investments.
Dry Mix Mortar Market Market Size (In Billion)
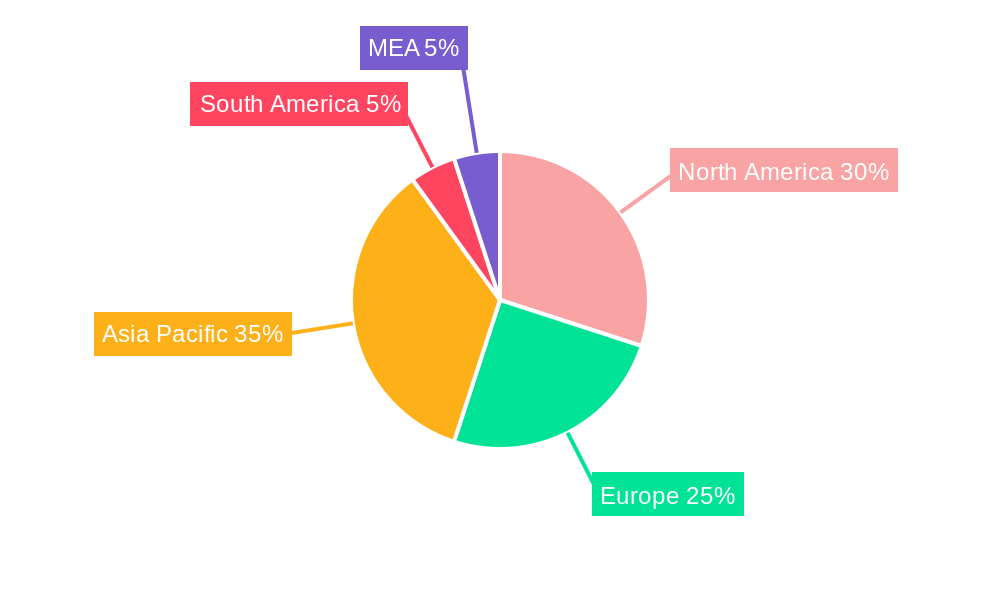
Geographically, North America and Europe currently hold dominant market shares, supported by mature construction industries and stringent building standards. However, the Asia-Pacific region, led by China and India, is experiencing accelerated growth fueled by rapid urbanization and major infrastructure initiatives. South America and the Middle East & Africa are also anticipated to witness considerable expansion. The competitive arena features both global corporations and regional entities focused on innovation, strategic alliances, and mergers and acquisitions. The market's outlook remains positive, supported by ongoing global construction trends and the shift towards sustainable building solutions.
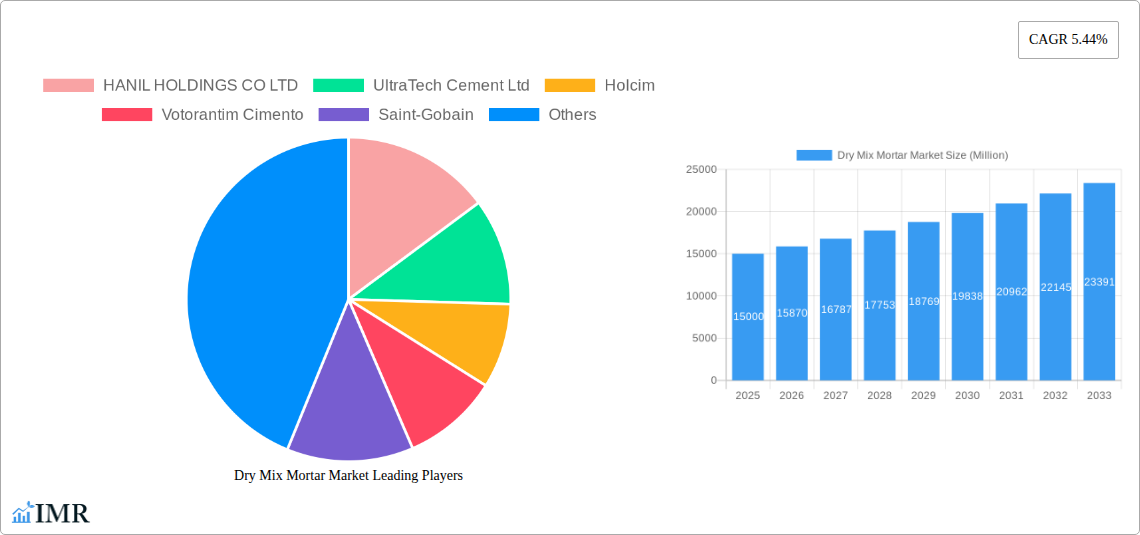
Dry Mix Mortar Market Company Market Share
Global Dry Mix Mortar Market Analysis: 2024-2033
This comprehensive report analyzes the global dry mix mortar market, covering dynamics, trends, regional segmentation, product offerings, key players, and future projections. The analysis spans from 2019 to 2033, with 2024 as the base year and a forecast period extending to 2033. The market is segmented by application, including Concrete Protection and Renovation, Grouts, Insulation and Finishing Systems, Plaster, Render, Tile Adhesive, Waterproofing Slurries, and Other Applications. End-use sectors include Commercial, Industrial and Institutional, Infrastructure, and Residential. The current market size is $8.89 billion.
Dry Mix Mortar Market Market Dynamics & Structure
The global dry mix mortar market is characterized by a moderately consolidated structure, with key players like Holcim, CEMEX S A B de C V, and Sika AG holding significant market share. Market concentration is influenced by factors such as economies of scale, technological advancements, and geographic reach. Technological innovation is a key driver, with ongoing research and development focusing on improving product performance, sustainability, and ease of application. Stringent regulatory frameworks concerning environmental impact and construction safety also shape market dynamics. The market faces competition from alternative materials, but the versatility and superior performance of dry mix mortars continue to secure its position. Mergers and acquisitions (M&A) activity has been moderate in recent years, with a notable example being the 2023 divestment of MBCC Group's construction systems business to Sika AG. This activity reshapes the competitive landscape and consolidates market power.
- Market Concentration: Moderately Consolidated (xx% market share held by top 5 players in 2024).
- Technological Innovation Drivers: Improved performance, sustainability, and ease of application.
- Regulatory Framework: Stringent environmental and safety regulations impacting product formulation.
- Competitive Substitutes: Traditional mortars, alternative construction materials.
- M&A Trends: Moderate activity, leading to consolidation and shifts in market share (xx deals in 2024).
- Innovation Barriers: High R&D costs, stringent regulatory approvals.
Dry Mix Mortar Market Growth Trends & Insights
The global dry mix mortar market exhibited a CAGR of xx% during the historical period (2019-2024) and is projected to maintain a robust CAGR of xx% during the forecast period (2025-2033), reaching a market size of xx million units by 2033. This growth is driven by several factors, including increased construction activity globally, particularly in developing economies, rising demand for sustainable and high-performance building materials, and a growing preference for pre-mixed mortars for improved efficiency and quality control. Market penetration in emerging economies is expected to increase significantly, further fueling market expansion. Technological advancements, including the development of self-leveling mortars and specialized mortars for specific applications, are also accelerating market growth. Shifts in consumer behavior towards eco-friendly and sustainable building practices further support the market’s expansion.
Dominant Regions, Countries, or Segments in Dry Mix Mortar Market
The Asia-Pacific region is expected to dominate the dry mix mortar market during the forecast period, driven by rapid urbanization, robust infrastructure development, and significant growth in the residential and commercial construction sectors. China and India are key growth drivers within this region. The North American market is also expected to exhibit significant growth, fueled by renovation projects and increased investment in infrastructure development. Within the application segments, tile adhesives, plaster, and render dominate the market, primarily due to their widespread use in residential and commercial construction. The infrastructure sector is also a major end-use driver, with significant demand for high-performance grouts and waterproof slurries.
- Key Regional Drivers:
- Asia-Pacific: Rapid urbanization, infrastructure development, and residential construction boom.
- North America: Renovation activities and infrastructure investments.
- Leading Application Segments: Tile adhesives, plaster, render (Market share: xx%, xx%, xx% respectively in 2024)
- Dominant End-Use Sector: Residential and Infrastructure (Market share: xx%, xx% respectively in 2024)
Dry Mix Mortar Market Product Landscape
The dry mix mortar market offers a diverse range of products tailored to specific applications and performance requirements. Recent innovations focus on improved workability, faster setting times, enhanced strength, and reduced environmental impact. Products now incorporate advanced admixtures and polymers to enhance their performance characteristics. Manufacturers are also emphasizing user-friendly packaging and formulations to improve ease of application. The introduction of lightweight, high-performance mortars like LATICRETE's 254 Platinum Plus exemplifies the trend toward innovative products addressing specific market needs. Unique selling propositions often center on superior performance, sustainability, and ease of use.
Key Drivers, Barriers & Challenges in Dry Mix Mortar Market
Key Drivers:
- Increasing construction activity globally.
- Growing demand for sustainable building materials.
- Technological advancements resulting in improved product performance.
- Favorable government policies promoting infrastructure development.
Key Challenges and Restraints:
- Fluctuations in raw material prices impacting production costs.
- Stringent environmental regulations requiring compliance.
- Intense competition among established players and the emergence of new entrants.
- Supply chain disruptions causing production delays and impacting availability. This was notably felt in 2024, resulting in a xx% decrease in production for some key players.
Emerging Opportunities in Dry Mix Mortar Market
- Untapped markets: Expanding into developing economies with substantial growth potential.
- Innovative applications: Development of specialized mortars for niche applications (e.g., 3D printing).
- Sustainable products: Growing demand for eco-friendly, low-carbon mortars.
Growth Accelerators in the Dry Mix Mortar Market Industry
Technological advancements are key growth drivers. The focus on developing high-performance, sustainable, and user-friendly mortars, along with strategic partnerships and acquisitions, enhances market penetration and expansion into new geographical areas. Companies are employing digital marketing and e-commerce strategies to improve market reach and enhance brand visibility.
Key Players Shaping the Dry Mix Mortar Market Market
- HANIL HOLDINGS CO LTD
- UltraTech Cement Ltd
- Holcim
- Votorantim Cimento
- Saint-Gobain
- MBCC Group
- LATICRETE International Inc
- CEMEX S A B de C V
- Ardex Group
- MAPEI S p A
- Sika AG
- SCG
- SAMPYO GROUP
- SIG
- Grupo Puma
Notable Milestones in Dry Mix Mortar Market Sector
- May 2023: MBCC group divested its construction systems business to Sika AG, significantly altering the market landscape.
- May 2023: PCI (MBCC Group) launched PCI Novoment Flow, a ready-mixed flowable screed mortar.
- August 2023: LATICRETE International, Inc. launched 254 Platinum Plus, a high-performance, lightweight, thin-set mortar.
In-Depth Dry Mix Mortar Market Market Outlook
The future of the dry mix mortar market is bright, fueled by sustained growth in the construction sector, technological innovations focused on sustainability and performance, and expanding market penetration in developing regions. Strategic partnerships, acquisitions, and product diversification will be crucial for companies to maintain a competitive edge. The market anticipates further consolidation, with leading players focusing on value-added products and expansion into niche segments. The overall outlook suggests strong and sustained growth through 2033.
Dry Mix Mortar Market Segmentation
-
1. End Use Sector
- 1.1. Commercial
- 1.2. Industrial and Institutional
- 1.3. Infrastructure
- 1.4. Residential
-
2. Application
- 2.1. Concrete Protection and Renovation
- 2.2. Grouts
- 2.3. Insulation and Finishing Systems
- 2.4. Plaster
- 2.5. Render
- 2.6. Tile Adhesive
- 2.7. Water Proofing Slurries
- 2.8. Other Applications
Dry Mix Mortar Market Segmentation By Geography
-
1. North America
- 1.1. United States
- 1.2. Canada
- 1.3. Mexico
-
2. South America
- 2.1. Brazil
- 2.2. Argentina
- 2.3. Rest of South America
-
3. Europe
- 3.1. United Kingdom
- 3.2. Germany
- 3.3. France
- 3.4. Italy
- 3.5. Spain
- 3.6. Russia
- 3.7. Benelux
- 3.8. Nordics
- 3.9. Rest of Europe
-
4. Middle East & Africa
- 4.1. Turkey
- 4.2. Israel
- 4.3. GCC
- 4.4. North Africa
- 4.5. South Africa
- 4.6. Rest of Middle East & Africa
-
5. Asia Pacific
- 5.1. China
- 5.2. India
- 5.3. Japan
- 5.4. South Korea
- 5.5. ASEAN
- 5.6. Oceania
- 5.7. Rest of Asia Pacific
Dry Mix Mortar Market Regional Market Share
Geographic Coverage of Dry Mix Mortar Market
Dry Mix Mortar Market REPORT HIGHLIGHTS
| Aspects | Details |
|---|---|
| Study Period | 2020-2034 |
| Base Year | 2025 |
| Estimated Year | 2026 |
| Forecast Period | 2026-2034 |
| Historical Period | 2020-2025 |
| Growth Rate | CAGR of 4.7% from 2020-2034 |
| Segmentation |
|
Table of Contents
- 1. Introduction
- 1.1. Research Scope
- 1.2. Market Segmentation
- 1.3. Research Objective
- 1.4. Definitions and Assumptions
- 2. Executive Summary
- 2.1. Market Snapshot
- 3. Market Dynamics
- 3.1. Market Drivers
- 3.2. Market Restrains
- 3.3. Market Trends
- 3.4. Market Opportunities
- 4. Market Factor Analysis
- 4.1. Porters Five Forces
- 4.1.1. Bargaining Power of Suppliers
- 4.1.2. Bargaining Power of Buyers
- 4.1.3. Threat of New Entrants
- 4.1.4. Threat of Substitutes
- 4.1.5. Competitive Rivalry
- 4.2. PESTEL analysis
- 4.3. BCG Analysis
- 4.3.1. Stars (High Growth, High Market Share)
- 4.3.2. Cash Cows (Low Growth, High Market Share)
- 4.3.3. Question Mark (High Growth, Low Market Share)
- 4.3.4. Dogs (Low Growth, Low Market Share)
- 4.4. Ansoff Matrix Analysis
- 4.5. Supply Chain Analysis
- 4.6. Regulatory Landscape
- 4.7. Current Market Potential and Opportunity Assessment (TAM–SAM–SOM Framework)
- 4.8. IMR Analyst Note
- 4.1. Porters Five Forces
- 5. Market Analysis, Insights and Forecast 2021-2033
- 5.1. Market Analysis, Insights and Forecast - by End Use Sector
- 5.1.1. Commercial
- 5.1.2. Industrial and Institutional
- 5.1.3. Infrastructure
- 5.1.4. Residential
- 5.2. Market Analysis, Insights and Forecast - by Application
- 5.2.1. Concrete Protection and Renovation
- 5.2.2. Grouts
- 5.2.3. Insulation and Finishing Systems
- 5.2.4. Plaster
- 5.2.5. Render
- 5.2.6. Tile Adhesive
- 5.2.7. Water Proofing Slurries
- 5.2.8. Other Applications
- 5.3. Market Analysis, Insights and Forecast - by Region
- 5.3.1. North America
- 5.3.2. South America
- 5.3.3. Europe
- 5.3.4. Middle East & Africa
- 5.3.5. Asia Pacific
- 5.1. Market Analysis, Insights and Forecast - by End Use Sector
- 6. Global Dry Mix Mortar Market Analysis, Insights and Forecast, 2021-2033
- 6.1. Market Analysis, Insights and Forecast - by End Use Sector
- 6.1.1. Commercial
- 6.1.2. Industrial and Institutional
- 6.1.3. Infrastructure
- 6.1.4. Residential
- 6.2. Market Analysis, Insights and Forecast - by Application
- 6.2.1. Concrete Protection and Renovation
- 6.2.2. Grouts
- 6.2.3. Insulation and Finishing Systems
- 6.2.4. Plaster
- 6.2.5. Render
- 6.2.6. Tile Adhesive
- 6.2.7. Water Proofing Slurries
- 6.2.8. Other Applications
- 6.1. Market Analysis, Insights and Forecast - by End Use Sector
- 7. North America Dry Mix Mortar Market Analysis, Insights and Forecast, 2020-2032
- 7.1. Market Analysis, Insights and Forecast - by End Use Sector
- 7.1.1. Commercial
- 7.1.2. Industrial and Institutional
- 7.1.3. Infrastructure
- 7.1.4. Residential
- 7.2. Market Analysis, Insights and Forecast - by Application
- 7.2.1. Concrete Protection and Renovation
- 7.2.2. Grouts
- 7.2.3. Insulation and Finishing Systems
- 7.2.4. Plaster
- 7.2.5. Render
- 7.2.6. Tile Adhesive
- 7.2.7. Water Proofing Slurries
- 7.2.8. Other Applications
- 7.1. Market Analysis, Insights and Forecast - by End Use Sector
- 8. South America Dry Mix Mortar Market Analysis, Insights and Forecast, 2020-2032
- 8.1. Market Analysis, Insights and Forecast - by End Use Sector
- 8.1.1. Commercial
- 8.1.2. Industrial and Institutional
- 8.1.3. Infrastructure
- 8.1.4. Residential
- 8.2. Market Analysis, Insights and Forecast - by Application
- 8.2.1. Concrete Protection and Renovation
- 8.2.2. Grouts
- 8.2.3. Insulation and Finishing Systems
- 8.2.4. Plaster
- 8.2.5. Render
- 8.2.6. Tile Adhesive
- 8.2.7. Water Proofing Slurries
- 8.2.8. Other Applications
- 8.1. Market Analysis, Insights and Forecast - by End Use Sector
- 9. Europe Dry Mix Mortar Market Analysis, Insights and Forecast, 2020-2032
- 9.1. Market Analysis, Insights and Forecast - by End Use Sector
- 9.1.1. Commercial
- 9.1.2. Industrial and Institutional
- 9.1.3. Infrastructure
- 9.1.4. Residential
- 9.2. Market Analysis, Insights and Forecast - by Application
- 9.2.1. Concrete Protection and Renovation
- 9.2.2. Grouts
- 9.2.3. Insulation and Finishing Systems
- 9.2.4. Plaster
- 9.2.5. Render
- 9.2.6. Tile Adhesive
- 9.2.7. Water Proofing Slurries
- 9.2.8. Other Applications
- 9.1. Market Analysis, Insights and Forecast - by End Use Sector
- 10. Middle East & Africa Dry Mix Mortar Market Analysis, Insights and Forecast, 2020-2032
- 10.1. Market Analysis, Insights and Forecast - by End Use Sector
- 10.1.1. Commercial
- 10.1.2. Industrial and Institutional
- 10.1.3. Infrastructure
- 10.1.4. Residential
- 10.2. Market Analysis, Insights and Forecast - by Application
- 10.2.1. Concrete Protection and Renovation
- 10.2.2. Grouts
- 10.2.3. Insulation and Finishing Systems
- 10.2.4. Plaster
- 10.2.5. Render
- 10.2.6. Tile Adhesive
- 10.2.7. Water Proofing Slurries
- 10.2.8. Other Applications
- 10.1. Market Analysis, Insights and Forecast - by End Use Sector
- 11. Asia Pacific Dry Mix Mortar Market Analysis, Insights and Forecast, 2020-2032
- 11.1. Market Analysis, Insights and Forecast - by End Use Sector
- 11.1.1. Commercial
- 11.1.2. Industrial and Institutional
- 11.1.3. Infrastructure
- 11.1.4. Residential
- 11.2. Market Analysis, Insights and Forecast - by Application
- 11.2.1. Concrete Protection and Renovation
- 11.2.2. Grouts
- 11.2.3. Insulation and Finishing Systems
- 11.2.4. Plaster
- 11.2.5. Render
- 11.2.6. Tile Adhesive
- 11.2.7. Water Proofing Slurries
- 11.2.8. Other Applications
- 11.1. Market Analysis, Insights and Forecast - by End Use Sector
- 12. Competitive Analysis
- 12.1. Company Profiles
- 12.1.1 HANIL HOLDINGS CO LTD
- 12.1.1.1. Company Overview
- 12.1.1.2. Products
- 12.1.1.3. Company Financials
- 12.1.1.4. SWOT Analysis
- 12.1.2 UltraTech Cement Ltd
- 12.1.2.1. Company Overview
- 12.1.2.2. Products
- 12.1.2.3. Company Financials
- 12.1.2.4. SWOT Analysis
- 12.1.3 Holcim
- 12.1.3.1. Company Overview
- 12.1.3.2. Products
- 12.1.3.3. Company Financials
- 12.1.3.4. SWOT Analysis
- 12.1.4 Votorantim Cimento
- 12.1.4.1. Company Overview
- 12.1.4.2. Products
- 12.1.4.3. Company Financials
- 12.1.4.4. SWOT Analysis
- 12.1.5 Saint-Gobain
- 12.1.5.1. Company Overview
- 12.1.5.2. Products
- 12.1.5.3. Company Financials
- 12.1.5.4. SWOT Analysis
- 12.1.6 MBCC Group
- 12.1.6.1. Company Overview
- 12.1.6.2. Products
- 12.1.6.3. Company Financials
- 12.1.6.4. SWOT Analysis
- 12.1.7 LATICRETE International Inc
- 12.1.7.1. Company Overview
- 12.1.7.2. Products
- 12.1.7.3. Company Financials
- 12.1.7.4. SWOT Analysis
- 12.1.8 CEMEX S A B de C V
- 12.1.8.1. Company Overview
- 12.1.8.2. Products
- 12.1.8.3. Company Financials
- 12.1.8.4. SWOT Analysis
- 12.1.9 Ardex Group
- 12.1.9.1. Company Overview
- 12.1.9.2. Products
- 12.1.9.3. Company Financials
- 12.1.9.4. SWOT Analysis
- 12.1.10 MAPEI S p A
- 12.1.10.1. Company Overview
- 12.1.10.2. Products
- 12.1.10.3. Company Financials
- 12.1.10.4. SWOT Analysis
- 12.1.11 Sika AG
- 12.1.11.1. Company Overview
- 12.1.11.2. Products
- 12.1.11.3. Company Financials
- 12.1.11.4. SWOT Analysis
- 12.1.12 SCG
- 12.1.12.1. Company Overview
- 12.1.12.2. Products
- 12.1.12.3. Company Financials
- 12.1.12.4. SWOT Analysis
- 12.1.13 SAMPYO GROUP
- 12.1.13.1. Company Overview
- 12.1.13.2. Products
- 12.1.13.3. Company Financials
- 12.1.13.4. SWOT Analysis
- 12.1.14 SIG
- 12.1.14.1. Company Overview
- 12.1.14.2. Products
- 12.1.14.3. Company Financials
- 12.1.14.4. SWOT Analysis
- 12.1.15 Grupo Puma
- 12.1.15.1. Company Overview
- 12.1.15.2. Products
- 12.1.15.3. Company Financials
- 12.1.15.4. SWOT Analysis
- 12.1.1 HANIL HOLDINGS CO LTD
- 12.2. Market Entropy
- 12.2.1 Company's Key Areas Served
- 12.2.2 Recent Developments
- 12.3. Company Market Share Analysis 2025
- 12.3.1 Top 5 Companies Market Share Analysis
- 12.3.2 Top 3 Companies Market Share Analysis
- 12.4. List of Potential Customers
- 13. Research Methodology
List of Figures
- Figure 1: Global Dry Mix Mortar Market Revenue Breakdown (billion, %) by Region 2025 & 2033
- Figure 2: Global Dry Mix Mortar Market Volume Breakdown (K Tons, %) by Region 2025 & 2033
- Figure 3: North America Dry Mix Mortar Market Revenue (billion), by End Use Sector 2025 & 2033
- Figure 4: North America Dry Mix Mortar Market Volume (K Tons), by End Use Sector 2025 & 2033
- Figure 5: North America Dry Mix Mortar Market Revenue Share (%), by End Use Sector 2025 & 2033
- Figure 6: North America Dry Mix Mortar Market Volume Share (%), by End Use Sector 2025 & 2033
- Figure 7: North America Dry Mix Mortar Market Revenue (billion), by Application 2025 & 2033
- Figure 8: North America Dry Mix Mortar Market Volume (K Tons), by Application 2025 & 2033
- Figure 9: North America Dry Mix Mortar Market Revenue Share (%), by Application 2025 & 2033
- Figure 10: North America Dry Mix Mortar Market Volume Share (%), by Application 2025 & 2033
- Figure 11: North America Dry Mix Mortar Market Revenue (billion), by Country 2025 & 2033
- Figure 12: North America Dry Mix Mortar Market Volume (K Tons), by Country 2025 & 2033
- Figure 13: North America Dry Mix Mortar Market Revenue Share (%), by Country 2025 & 2033
- Figure 14: North America Dry Mix Mortar Market Volume Share (%), by Country 2025 & 2033
- Figure 15: South America Dry Mix Mortar Market Revenue (billion), by End Use Sector 2025 & 2033
- Figure 16: South America Dry Mix Mortar Market Volume (K Tons), by End Use Sector 2025 & 2033
- Figure 17: South America Dry Mix Mortar Market Revenue Share (%), by End Use Sector 2025 & 2033
- Figure 18: South America Dry Mix Mortar Market Volume Share (%), by End Use Sector 2025 & 2033
- Figure 19: South America Dry Mix Mortar Market Revenue (billion), by Application 2025 & 2033
- Figure 20: South America Dry Mix Mortar Market Volume (K Tons), by Application 2025 & 2033
- Figure 21: South America Dry Mix Mortar Market Revenue Share (%), by Application 2025 & 2033
- Figure 22: South America Dry Mix Mortar Market Volume Share (%), by Application 2025 & 2033
- Figure 23: South America Dry Mix Mortar Market Revenue (billion), by Country 2025 & 2033
- Figure 24: South America Dry Mix Mortar Market Volume (K Tons), by Country 2025 & 2033
- Figure 25: South America Dry Mix Mortar Market Revenue Share (%), by Country 2025 & 2033
- Figure 26: South America Dry Mix Mortar Market Volume Share (%), by Country 2025 & 2033
- Figure 27: Europe Dry Mix Mortar Market Revenue (billion), by End Use Sector 2025 & 2033
- Figure 28: Europe Dry Mix Mortar Market Volume (K Tons), by End Use Sector 2025 & 2033
- Figure 29: Europe Dry Mix Mortar Market Revenue Share (%), by End Use Sector 2025 & 2033
- Figure 30: Europe Dry Mix Mortar Market Volume Share (%), by End Use Sector 2025 & 2033
- Figure 31: Europe Dry Mix Mortar Market Revenue (billion), by Application 2025 & 2033
- Figure 32: Europe Dry Mix Mortar Market Volume (K Tons), by Application 2025 & 2033
- Figure 33: Europe Dry Mix Mortar Market Revenue Share (%), by Application 2025 & 2033
- Figure 34: Europe Dry Mix Mortar Market Volume Share (%), by Application 2025 & 2033
- Figure 35: Europe Dry Mix Mortar Market Revenue (billion), by Country 2025 & 2033
- Figure 36: Europe Dry Mix Mortar Market Volume (K Tons), by Country 2025 & 2033
- Figure 37: Europe Dry Mix Mortar Market Revenue Share (%), by Country 2025 & 2033
- Figure 38: Europe Dry Mix Mortar Market Volume Share (%), by Country 2025 & 2033
- Figure 39: Middle East & Africa Dry Mix Mortar Market Revenue (billion), by End Use Sector 2025 & 2033
- Figure 40: Middle East & Africa Dry Mix Mortar Market Volume (K Tons), by End Use Sector 2025 & 2033
- Figure 41: Middle East & Africa Dry Mix Mortar Market Revenue Share (%), by End Use Sector 2025 & 2033
- Figure 42: Middle East & Africa Dry Mix Mortar Market Volume Share (%), by End Use Sector 2025 & 2033
- Figure 43: Middle East & Africa Dry Mix Mortar Market Revenue (billion), by Application 2025 & 2033
- Figure 44: Middle East & Africa Dry Mix Mortar Market Volume (K Tons), by Application 2025 & 2033
- Figure 45: Middle East & Africa Dry Mix Mortar Market Revenue Share (%), by Application 2025 & 2033
- Figure 46: Middle East & Africa Dry Mix Mortar Market Volume Share (%), by Application 2025 & 2033
- Figure 47: Middle East & Africa Dry Mix Mortar Market Revenue (billion), by Country 2025 & 2033
- Figure 48: Middle East & Africa Dry Mix Mortar Market Volume (K Tons), by Country 2025 & 2033
- Figure 49: Middle East & Africa Dry Mix Mortar Market Revenue Share (%), by Country 2025 & 2033
- Figure 50: Middle East & Africa Dry Mix Mortar Market Volume Share (%), by Country 2025 & 2033
- Figure 51: Asia Pacific Dry Mix Mortar Market Revenue (billion), by End Use Sector 2025 & 2033
- Figure 52: Asia Pacific Dry Mix Mortar Market Volume (K Tons), by End Use Sector 2025 & 2033
- Figure 53: Asia Pacific Dry Mix Mortar Market Revenue Share (%), by End Use Sector 2025 & 2033
- Figure 54: Asia Pacific Dry Mix Mortar Market Volume Share (%), by End Use Sector 2025 & 2033
- Figure 55: Asia Pacific Dry Mix Mortar Market Revenue (billion), by Application 2025 & 2033
- Figure 56: Asia Pacific Dry Mix Mortar Market Volume (K Tons), by Application 2025 & 2033
- Figure 57: Asia Pacific Dry Mix Mortar Market Revenue Share (%), by Application 2025 & 2033
- Figure 58: Asia Pacific Dry Mix Mortar Market Volume Share (%), by Application 2025 & 2033
- Figure 59: Asia Pacific Dry Mix Mortar Market Revenue (billion), by Country 2025 & 2033
- Figure 60: Asia Pacific Dry Mix Mortar Market Volume (K Tons), by Country 2025 & 2033
- Figure 61: Asia Pacific Dry Mix Mortar Market Revenue Share (%), by Country 2025 & 2033
- Figure 62: Asia Pacific Dry Mix Mortar Market Volume Share (%), by Country 2025 & 2033
List of Tables
- Table 1: Global Dry Mix Mortar Market Revenue billion Forecast, by End Use Sector 2020 & 2033
- Table 2: Global Dry Mix Mortar Market Volume K Tons Forecast, by End Use Sector 2020 & 2033
- Table 3: Global Dry Mix Mortar Market Revenue billion Forecast, by Application 2020 & 2033
- Table 4: Global Dry Mix Mortar Market Volume K Tons Forecast, by Application 2020 & 2033
- Table 5: Global Dry Mix Mortar Market Revenue billion Forecast, by Region 2020 & 2033
- Table 6: Global Dry Mix Mortar Market Volume K Tons Forecast, by Region 2020 & 2033
- Table 7: Global Dry Mix Mortar Market Revenue billion Forecast, by End Use Sector 2020 & 2033
- Table 8: Global Dry Mix Mortar Market Volume K Tons Forecast, by End Use Sector 2020 & 2033
- Table 9: Global Dry Mix Mortar Market Revenue billion Forecast, by Application 2020 & 2033
- Table 10: Global Dry Mix Mortar Market Volume K Tons Forecast, by Application 2020 & 2033
- Table 11: Global Dry Mix Mortar Market Revenue billion Forecast, by Country 2020 & 2033
- Table 12: Global Dry Mix Mortar Market Volume K Tons Forecast, by Country 2020 & 2033
- Table 13: United States Dry Mix Mortar Market Revenue (billion) Forecast, by Application 2020 & 2033
- Table 14: United States Dry Mix Mortar Market Volume (K Tons) Forecast, by Application 2020 & 2033
- Table 15: Canada Dry Mix Mortar Market Revenue (billion) Forecast, by Application 2020 & 2033
- Table 16: Canada Dry Mix Mortar Market Volume (K Tons) Forecast, by Application 2020 & 2033
- Table 17: Mexico Dry Mix Mortar Market Revenue (billion) Forecast, by Application 2020 & 2033
- Table 18: Mexico Dry Mix Mortar Market Volume (K Tons) Forecast, by Application 2020 & 2033
- Table 19: Global Dry Mix Mortar Market Revenue billion Forecast, by End Use Sector 2020 & 2033
- Table 20: Global Dry Mix Mortar Market Volume K Tons Forecast, by End Use Sector 2020 & 2033
- Table 21: Global Dry Mix Mortar Market Revenue billion Forecast, by Application 2020 & 2033
- Table 22: Global Dry Mix Mortar Market Volume K Tons Forecast, by Application 2020 & 2033
- Table 23: Global Dry Mix Mortar Market Revenue billion Forecast, by Country 2020 & 2033
- Table 24: Global Dry Mix Mortar Market Volume K Tons Forecast, by Country 2020 & 2033
- Table 25: Brazil Dry Mix Mortar Market Revenue (billion) Forecast, by Application 2020 & 2033
- Table 26: Brazil Dry Mix Mortar Market Volume (K Tons) Forecast, by Application 2020 & 2033
- Table 27: Argentina Dry Mix Mortar Market Revenue (billion) Forecast, by Application 2020 & 2033
- Table 28: Argentina Dry Mix Mortar Market Volume (K Tons) Forecast, by Application 2020 & 2033
- Table 29: Rest of South America Dry Mix Mortar Market Revenue (billion) Forecast, by Application 2020 & 2033
- Table 30: Rest of South America Dry Mix Mortar Market Volume (K Tons) Forecast, by Application 2020 & 2033
- Table 31: Global Dry Mix Mortar Market Revenue billion Forecast, by End Use Sector 2020 & 2033
- Table 32: Global Dry Mix Mortar Market Volume K Tons Forecast, by End Use Sector 2020 & 2033
- Table 33: Global Dry Mix Mortar Market Revenue billion Forecast, by Application 2020 & 2033
- Table 34: Global Dry Mix Mortar Market Volume K Tons Forecast, by Application 2020 & 2033
- Table 35: Global Dry Mix Mortar Market Revenue billion Forecast, by Country 2020 & 2033
- Table 36: Global Dry Mix Mortar Market Volume K Tons Forecast, by Country 2020 & 2033
- Table 37: United Kingdom Dry Mix Mortar Market Revenue (billion) Forecast, by Application 2020 & 2033
- Table 38: United Kingdom Dry Mix Mortar Market Volume (K Tons) Forecast, by Application 2020 & 2033
- Table 39: Germany Dry Mix Mortar Market Revenue (billion) Forecast, by Application 2020 & 2033
- Table 40: Germany Dry Mix Mortar Market Volume (K Tons) Forecast, by Application 2020 & 2033
- Table 41: France Dry Mix Mortar Market Revenue (billion) Forecast, by Application 2020 & 2033
- Table 42: France Dry Mix Mortar Market Volume (K Tons) Forecast, by Application 2020 & 2033
- Table 43: Italy Dry Mix Mortar Market Revenue (billion) Forecast, by Application 2020 & 2033
- Table 44: Italy Dry Mix Mortar Market Volume (K Tons) Forecast, by Application 2020 & 2033
- Table 45: Spain Dry Mix Mortar Market Revenue (billion) Forecast, by Application 2020 & 2033
- Table 46: Spain Dry Mix Mortar Market Volume (K Tons) Forecast, by Application 2020 & 2033
- Table 47: Russia Dry Mix Mortar Market Revenue (billion) Forecast, by Application 2020 & 2033
- Table 48: Russia Dry Mix Mortar Market Volume (K Tons) Forecast, by Application 2020 & 2033
- Table 49: Benelux Dry Mix Mortar Market Revenue (billion) Forecast, by Application 2020 & 2033
- Table 50: Benelux Dry Mix Mortar Market Volume (K Tons) Forecast, by Application 2020 & 2033
- Table 51: Nordics Dry Mix Mortar Market Revenue (billion) Forecast, by Application 2020 & 2033
- Table 52: Nordics Dry Mix Mortar Market Volume (K Tons) Forecast, by Application 2020 & 2033
- Table 53: Rest of Europe Dry Mix Mortar Market Revenue (billion) Forecast, by Application 2020 & 2033
- Table 54: Rest of Europe Dry Mix Mortar Market Volume (K Tons) Forecast, by Application 2020 & 2033
- Table 55: Global Dry Mix Mortar Market Revenue billion Forecast, by End Use Sector 2020 & 2033
- Table 56: Global Dry Mix Mortar Market Volume K Tons Forecast, by End Use Sector 2020 & 2033
- Table 57: Global Dry Mix Mortar Market Revenue billion Forecast, by Application 2020 & 2033
- Table 58: Global Dry Mix Mortar Market Volume K Tons Forecast, by Application 2020 & 2033
- Table 59: Global Dry Mix Mortar Market Revenue billion Forecast, by Country 2020 & 2033
- Table 60: Global Dry Mix Mortar Market Volume K Tons Forecast, by Country 2020 & 2033
- Table 61: Turkey Dry Mix Mortar Market Revenue (billion) Forecast, by Application 2020 & 2033
- Table 62: Turkey Dry Mix Mortar Market Volume (K Tons) Forecast, by Application 2020 & 2033
- Table 63: Israel Dry Mix Mortar Market Revenue (billion) Forecast, by Application 2020 & 2033
- Table 64: Israel Dry Mix Mortar Market Volume (K Tons) Forecast, by Application 2020 & 2033
- Table 65: GCC Dry Mix Mortar Market Revenue (billion) Forecast, by Application 2020 & 2033
- Table 66: GCC Dry Mix Mortar Market Volume (K Tons) Forecast, by Application 2020 & 2033
- Table 67: North Africa Dry Mix Mortar Market Revenue (billion) Forecast, by Application 2020 & 2033
- Table 68: North Africa Dry Mix Mortar Market Volume (K Tons) Forecast, by Application 2020 & 2033
- Table 69: South Africa Dry Mix Mortar Market Revenue (billion) Forecast, by Application 2020 & 2033
- Table 70: South Africa Dry Mix Mortar Market Volume (K Tons) Forecast, by Application 2020 & 2033
- Table 71: Rest of Middle East & Africa Dry Mix Mortar Market Revenue (billion) Forecast, by Application 2020 & 2033
- Table 72: Rest of Middle East & Africa Dry Mix Mortar Market Volume (K Tons) Forecast, by Application 2020 & 2033
- Table 73: Global Dry Mix Mortar Market Revenue billion Forecast, by End Use Sector 2020 & 2033
- Table 74: Global Dry Mix Mortar Market Volume K Tons Forecast, by End Use Sector 2020 & 2033
- Table 75: Global Dry Mix Mortar Market Revenue billion Forecast, by Application 2020 & 2033
- Table 76: Global Dry Mix Mortar Market Volume K Tons Forecast, by Application 2020 & 2033
- Table 77: Global Dry Mix Mortar Market Revenue billion Forecast, by Country 2020 & 2033
- Table 78: Global Dry Mix Mortar Market Volume K Tons Forecast, by Country 2020 & 2033
- Table 79: China Dry Mix Mortar Market Revenue (billion) Forecast, by Application 2020 & 2033
- Table 80: China Dry Mix Mortar Market Volume (K Tons) Forecast, by Application 2020 & 2033
- Table 81: India Dry Mix Mortar Market Revenue (billion) Forecast, by Application 2020 & 2033
- Table 82: India Dry Mix Mortar Market Volume (K Tons) Forecast, by Application 2020 & 2033
- Table 83: Japan Dry Mix Mortar Market Revenue (billion) Forecast, by Application 2020 & 2033
- Table 84: Japan Dry Mix Mortar Market Volume (K Tons) Forecast, by Application 2020 & 2033
- Table 85: South Korea Dry Mix Mortar Market Revenue (billion) Forecast, by Application 2020 & 2033
- Table 86: South Korea Dry Mix Mortar Market Volume (K Tons) Forecast, by Application 2020 & 2033
- Table 87: ASEAN Dry Mix Mortar Market Revenue (billion) Forecast, by Application 2020 & 2033
- Table 88: ASEAN Dry Mix Mortar Market Volume (K Tons) Forecast, by Application 2020 & 2033
- Table 89: Oceania Dry Mix Mortar Market Revenue (billion) Forecast, by Application 2020 & 2033
- Table 90: Oceania Dry Mix Mortar Market Volume (K Tons) Forecast, by Application 2020 & 2033
- Table 91: Rest of Asia Pacific Dry Mix Mortar Market Revenue (billion) Forecast, by Application 2020 & 2033
- Table 92: Rest of Asia Pacific Dry Mix Mortar Market Volume (K Tons) Forecast, by Application 2020 & 2033
Frequently Asked Questions
1. What is the projected Compound Annual Growth Rate (CAGR) of the Dry Mix Mortar Market?
The projected CAGR is approximately 4.7%.
2. Which companies are prominent players in the Dry Mix Mortar Market?
Key companies in the market include HANIL HOLDINGS CO LTD, UltraTech Cement Ltd, Holcim, Votorantim Cimento, Saint-Gobain, MBCC Group, LATICRETE International Inc, CEMEX S A B de C V, Ardex Group, MAPEI S p A, Sika AG, SCG, SAMPYO GROUP, SIG, Grupo Puma.
3. What are the main segments of the Dry Mix Mortar Market?
The market segments include End Use Sector, Application.
4. Can you provide details about the market size?
The market size is estimated to be USD 8.89 billion as of 2022.
5. What are some drivers contributing to market growth?
; Banning/ Limiting Use of Plastics used in packaging applications.
6. What are the notable trends driving market growth?
OTHER KEY INDUSTRY TRENDS COVERED IN THE REPORT.
7. Are there any restraints impacting market growth?
; Harmful Amines in Dyes; Paperless Green Initiatives.
8. Can you provide examples of recent developments in the market?
August 2023: LATICRETE International, Inc. formulated a high-performance, lightweight, thin-set mortar, 254 Platinum Plus, for tile adhesive applications.May 2023: PCI, an affiliate of MBCC Group, formulated a ready-mixed flowable screed mortar, PCI Novoment Flow, offering multiple benefits like quick setting and curing.May 2023: MBCC group divested its construction systems business, including its subsidiaries, product portfolio, and advanced technologies, to Sika AG.
9. What pricing options are available for accessing the report?
Pricing options include single-user, multi-user, and enterprise licenses priced at USD 3800, USD 4500, and USD 5800 respectively.
10. Is the market size provided in terms of value or volume?
The market size is provided in terms of value, measured in billion and volume, measured in K Tons.
11. Are there any specific market keywords associated with the report?
Yes, the market keyword associated with the report is "Dry Mix Mortar Market," which aids in identifying and referencing the specific market segment covered.
12. How do I determine which pricing option suits my needs best?
The pricing options vary based on user requirements and access needs. Individual users may opt for single-user licenses, while businesses requiring broader access may choose multi-user or enterprise licenses for cost-effective access to the report.
13. Are there any additional resources or data provided in the Dry Mix Mortar Market report?
While the report offers comprehensive insights, it's advisable to review the specific contents or supplementary materials provided to ascertain if additional resources or data are available.
14. How can I stay updated on further developments or reports in the Dry Mix Mortar Market?
To stay informed about further developments, trends, and reports in the Dry Mix Mortar Market, consider subscribing to industry newsletters, following relevant companies and organizations, or regularly checking reputable industry news sources and publications.
Methodology
Step 1 - Identification of Relevant Samples Size from Population Database


Step 2 - Approaches for Defining Global Market Size (Value, Volume* & Price*)

Note*: In applicable scenarios
Step 3 - Data Sources
Primary Research
- Web Analytics
- Survey Reports
- Research Institute
- Latest Research Reports
- Opinion Leaders
Secondary Research
- Annual Reports
- White Paper
- Latest Press Release
- Industry Association
- Paid Database
- Investor Presentations

Step 4 - Data Triangulation
Involves using different sources of information in order to increase the validity of a study
These sources are likely to be stakeholders in a program - participants, other researchers, program staff, other community members, and so on.
Then we put all data in single framework & apply various statistical tools to find out the dynamic on the market.
During the analysis stage, feedback from the stakeholder groups would be compared to determine areas of agreement as well as areas of divergence