

Key Insights
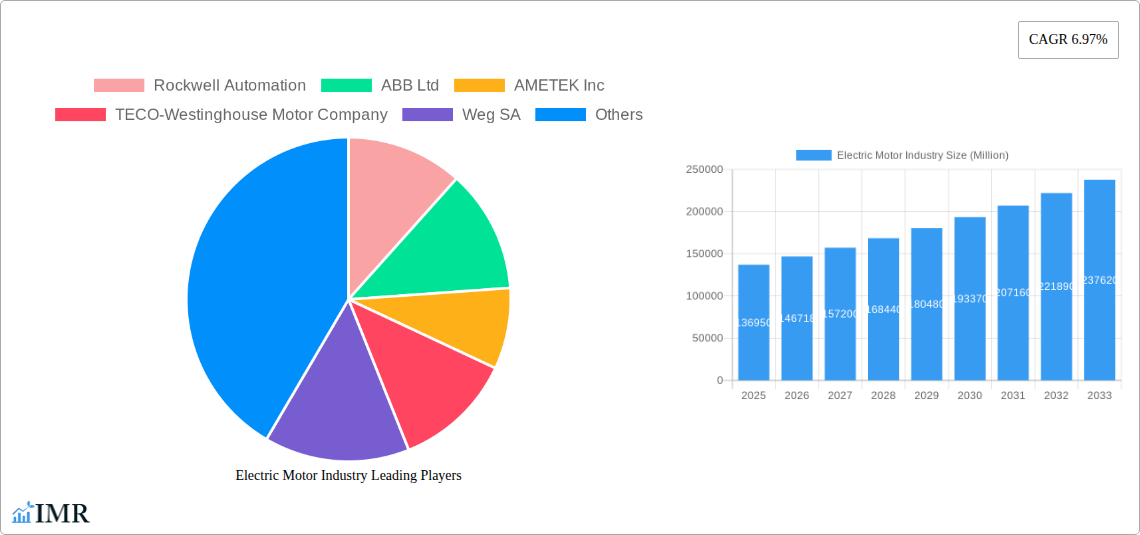
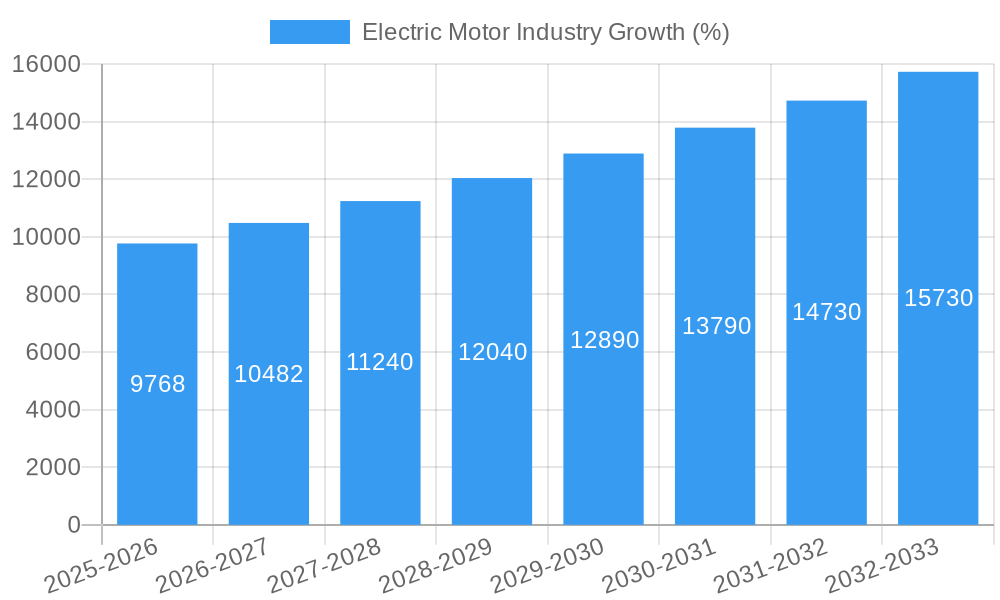
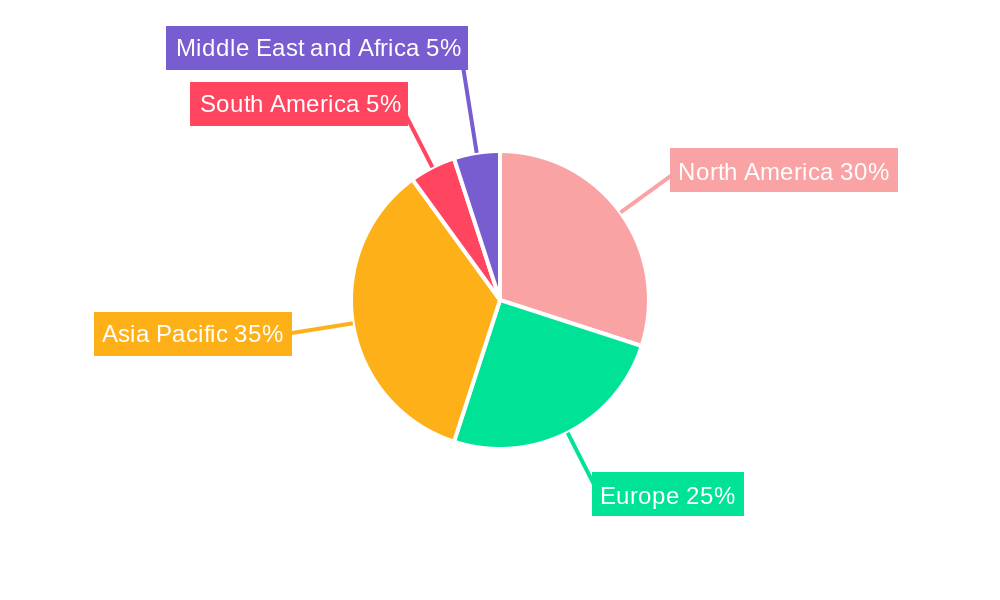
The global electric motor market, valued at $136.95 billion in 2025, is projected to experience robust growth, driven by the increasing adoption of electric vehicles (EVs), automation across industries, and the global push towards energy efficiency. A Compound Annual Growth Rate (CAGR) of 6.97% from 2025 to 2033 indicates a significant market expansion, with the demand for energy-efficient motors in industrial applications (such as robotics and manufacturing) and the burgeoning residential and commercial sectors fueling this growth. The market segmentation reveals strong performance across diverse motor types (AC and DC), voltage classes (covering low, medium, and high voltage applications), and end-use sectors, including automotive, industrial, residential, and commercial applications. Key players like Rockwell Automation, ABB Ltd, and Siemens AG are leading the innovation drive, focusing on developing high-efficiency, smart motors integrated with advanced control systems and digital technologies. The increasing demand for smaller, lighter, and more efficient motors in consumer electronics and automotive applications is a noteworthy trend, alongside the growing importance of sustainable manufacturing practices and the incorporation of renewable energy sources. Geographical distribution shows strong performance in North America and Asia Pacific, driven by mature markets in the US and Japan, as well as rapid industrialization and economic growth in countries like China and India.
While the market's growth trajectory is positive, challenges exist. Supply chain disruptions, rising raw material costs, and the need for advanced technological developments to meet the stringent efficiency standards are crucial factors to consider. Nevertheless, the long-term outlook remains optimistic, considering the consistent global demand for energy-efficient solutions, technological advancements leading to enhanced motor performance, and governmental policies promoting sustainable energy consumption and industrial automation across various regions. The continued focus on research and development in areas like rare-earth-free permanent magnets and advanced control systems promises further innovation and market expansion in the coming years.
Electric Motor Industry Market Report: 2019-2033
This comprehensive report provides a detailed analysis of the electric motor industry, encompassing market dynamics, growth trends, regional dominance, product landscape, key players, and future outlook. The study period covers 2019-2033, with 2025 as the base and estimated year. This report is essential for industry professionals, investors, and strategists seeking to understand and capitalize on the opportunities within this dynamic market.
Parent Market: Power Transmission Equipment Market Child Market: Electric Motor Industry
Electric Motor Industry Market Dynamics & Structure
The electric motor market is characterized by a moderately consolidated structure with several major players holding significant market share. Technological innovation, driven by increasing demand for energy efficiency and automation, is a key market driver. Stringent environmental regulations and the global push towards sustainable energy solutions further propel growth. However, the market faces challenges from the availability of substitute technologies and intense competition. Mergers and acquisitions (M&A) activity is prominent, reflecting consolidation efforts and strategic expansions.
- Market Concentration: The top 10 players hold an estimated xx% market share in 2025.
- Technological Innovation: Focus on energy efficiency (permanent magnet motors, high-efficiency motors), advanced control systems (variable speed drives), and miniaturization.
- Regulatory Framework: Stringent energy efficiency standards (e.g., EU Ecodesign Directive) and environmental regulations influence product development and adoption.
- Competitive Product Substitutes: Hydraulic and pneumatic systems pose some competition, particularly in specific niche applications.
- End-User Demographics: The industrial sector dominates the market, followed by automotive and commercial applications. Residential segment growth is expected to be slower.
- M&A Trends: Significant M&A activity observed in the past 5 years, with an estimated xx deals finalized, primarily focused on expanding product portfolios and geographical reach. This consolidation trend is expected to continue.
Electric Motor Industry Growth Trends & Insights
The global electric motor market is experiencing robust growth, driven by rising industrial automation, the proliferation of electric vehicles, and the increasing demand for energy-efficient solutions across diverse sectors. The market size, valued at xx million units in 2025, is projected to reach xx million units by 2033, exhibiting a compound annual growth rate (CAGR) of xx%. This growth is fueled by significant technological advancements, changing consumer preferences towards energy-efficient appliances, and supportive government policies.
Market penetration is increasing across various sectors, particularly in automotive and industrial applications, while residential penetration remains relatively lower. Disruptive technologies, such as the development of high-efficiency motors and advanced control systems, are accelerating this adoption. Consumer behavior shifts towards energy conservation and environmental sustainability further bolster market expansion.
Dominant Regions, Countries, or Segments in Electric Motor Industry
The industrial segment holds the largest market share, driven by high demand from manufacturing, process industries and automation. Within motor types, AC motors dominate, accounting for approximately xx% of the market, followed by DC motors at xx%. The "less than 1 kV" voltage segment is the largest, comprising xx% of the market. Geographically, Asia-Pacific is the leading region, with China and India as significant contributors due to rapid industrialization and manufacturing growth. Europe and North America also hold substantial market share.
- Key Drivers (Asia-Pacific): Rapid industrialization, robust manufacturing sector, government initiatives promoting electric vehicle adoption.
- Key Drivers (Europe): Stringent environmental regulations, investments in renewable energy infrastructure, strong presence of industrial automation.
- Key Drivers (North America): Growth in automotive sector (EV adoption), increasing focus on energy efficiency, robust industrial base.
Electric Motor Industry Product Landscape
The electric motor market offers a diverse product landscape, encompassing various motor types (AC, DC), voltage levels (low, medium, high), and applications (residential, commercial, industrial, automotive). Recent innovations focus on high efficiency, reduced size and weight, improved durability, and enhanced control capabilities. Key selling propositions include energy savings, improved performance, and reduced maintenance costs. Technological advancements like the integration of advanced sensors and AI-powered control systems are transforming the product landscape.
Key Drivers, Barriers & Challenges in Electric Motor Industry
Key Drivers:
- Increasing demand for automation across industries
- Growth of the electric vehicle market
- Stringent regulations promoting energy efficiency
- Advancements in power electronics and control systems
Challenges & Restraints:
- Intense competition from established players and new entrants.
- Supply chain disruptions affecting raw material availability and cost.
- Regulatory hurdles and compliance costs associated with safety and environmental standards.
- The high initial investment required for advanced motor technologies can be a barrier for some businesses.
Emerging Opportunities in Electric Motor Industry
- Growing demand for electric motors in renewable energy applications (wind turbines, solar power systems)
- Expanding use of electric motors in robotics and automation systems.
- Development of high-efficiency motors for data centers and other high-power applications.
- Increasing demand for energy-efficient motors in developing countries.
Growth Accelerators in the Electric Motor Industry
Long-term growth is driven by technological breakthroughs in motor design and materials, strategic partnerships to expand market reach, and expansion into new applications like electric aviation and marine technologies. These factors, combined with ongoing government support for energy efficiency and sustainable development, contribute to the industry's positive outlook.
Key Players Shaping the Electric Motor Industry Market
- Rockwell Automation
- ABB Ltd
- AMETEK Inc
- TECO-Westinghouse Motor Company
- Weg SA
- Toshiba Corp
- Nidec Corporation
- Johnson Electric Holdings Limited
- Siemens AG
- Hitachi Ltd
- Robert Bosch GmbH
- Regal Rexnord Corporation
Notable Milestones in Electric Motor Industry Sector
- November 2022: Nidec Corporation announced a USD 715 million investment in Mexico to manufacture electric motors and e-axle drives for electric vehicles, with an anticipated annual production capacity of 1 million units.
- February 2023: Flash, an electronic component maker, partnered with Slovenia-based GEM motors to develop electric motors for various electric vehicle segments (1 kW to 15 kW).
In-Depth Electric Motor Industry Market Outlook
The future of the electric motor industry is bright, with continued growth driven by technological innovation, increasing demand from diverse sectors, and supportive regulatory frameworks. Strategic investments in research and development, strategic partnerships, and expansion into emerging markets present lucrative opportunities for market players. The focus on high-efficiency, smart, and sustainable motors will be key to success in this ever-evolving landscape.
Electric Motor Industry Segmentation
-
1. Motor Type
- 1.1. AC
- 1.2. DC
-
2. Voltage
- 2.1. Less than 1 kV
- 2.2. Between 1kV-6kV
- 2.3. Higher than 6 kV
-
3. Application
- 3.1. Residential
- 3.2. Commercial
- 3.3. Automotive
- 3.4. Industrial
Electric Motor Industry Segmentation By Geography
-
1. North America
- 1.1. United States
- 1.2. Canada
- 1.3. Rest of North America
-
2. Europe
- 2.1. Germany
- 2.2. France
- 2.3. United Kingdom
- 2.4. Rest of Europe
-
3. Asia Pacific
- 3.1. China
- 3.2. India
- 3.3. Japan
- 3.4. South Korea
- 3.5. Rest of Asia Pacific
-
4. South America
- 4.1. Brazil
- 4.2. Argentina
- 4.3. Rest of South America
-
5. Middle East and Africa
- 5.1. Saudi Arabia
- 5.2. United Arab Emirates
- 5.3. South Africa
- 5.4. Rest of Middle East and Africa
Electric Motor Industry REPORT HIGHLIGHTS
| Aspects | Details |
|---|---|
| Study Period | 2019-2033 |
| Base Year | 2024 |
| Estimated Year | 2025 |
| Forecast Period | 2025-2033 |
| Historical Period | 2019-2024 |
| Growth Rate | CAGR of 6.97% from 2019-2033 |
| Segmentation |
|
Table of Contents
- 1. Introduction
- 1.1. Research Scope
- 1.2. Market Segmentation
- 1.3. Research Methodology
- 1.4. Definitions and Assumptions
- 2. Executive Summary
- 2.1. Introduction
- 3. Market Dynamics
- 3.1. Introduction
- 3.2. Market Drivers
- 3.2.1. 4Increasing Residential Usage of the Electric Motor. Rising Adoption of Electric Vehicles
- 3.3. Market Restrains
- 3.3.1. Fluctuating Prices of Raw Materials
- 3.4. Market Trends
- 3.4.1. Automotive Segment to Witness Growth
- 4. Market Factor Analysis
- 4.1. Porters Five Forces
- 4.2. Supply/Value Chain
- 4.3. PESTEL analysis
- 4.4. Market Entropy
- 4.5. Patent/Trademark Analysis
- 5. Global Electric Motor Industry Analysis, Insights and Forecast, 2019-2031
- 5.1. Market Analysis, Insights and Forecast - by Motor Type
- 5.1.1. AC
- 5.1.2. DC
- 5.2. Market Analysis, Insights and Forecast - by Voltage
- 5.2.1. Less than 1 kV
- 5.2.2. Between 1kV-6kV
- 5.2.3. Higher than 6 kV
- 5.3. Market Analysis, Insights and Forecast - by Application
- 5.3.1. Residential
- 5.3.2. Commercial
- 5.3.3. Automotive
- 5.3.4. Industrial
- 5.4. Market Analysis, Insights and Forecast - by Region
- 5.4.1. North America
- 5.4.2. Europe
- 5.4.3. Asia Pacific
- 5.4.4. South America
- 5.4.5. Middle East and Africa
- 5.1. Market Analysis, Insights and Forecast - by Motor Type
- 6. North America Electric Motor Industry Analysis, Insights and Forecast, 2019-2031
- 6.1. Market Analysis, Insights and Forecast - by Motor Type
- 6.1.1. AC
- 6.1.2. DC
- 6.2. Market Analysis, Insights and Forecast - by Voltage
- 6.2.1. Less than 1 kV
- 6.2.2. Between 1kV-6kV
- 6.2.3. Higher than 6 kV
- 6.3. Market Analysis, Insights and Forecast - by Application
- 6.3.1. Residential
- 6.3.2. Commercial
- 6.3.3. Automotive
- 6.3.4. Industrial
- 6.1. Market Analysis, Insights and Forecast - by Motor Type
- 7. Europe Electric Motor Industry Analysis, Insights and Forecast, 2019-2031
- 7.1. Market Analysis, Insights and Forecast - by Motor Type
- 7.1.1. AC
- 7.1.2. DC
- 7.2. Market Analysis, Insights and Forecast - by Voltage
- 7.2.1. Less than 1 kV
- 7.2.2. Between 1kV-6kV
- 7.2.3. Higher than 6 kV
- 7.3. Market Analysis, Insights and Forecast - by Application
- 7.3.1. Residential
- 7.3.2. Commercial
- 7.3.3. Automotive
- 7.3.4. Industrial
- 7.1. Market Analysis, Insights and Forecast - by Motor Type
- 8. Asia Pacific Electric Motor Industry Analysis, Insights and Forecast, 2019-2031
- 8.1. Market Analysis, Insights and Forecast - by Motor Type
- 8.1.1. AC
- 8.1.2. DC
- 8.2. Market Analysis, Insights and Forecast - by Voltage
- 8.2.1. Less than 1 kV
- 8.2.2. Between 1kV-6kV
- 8.2.3. Higher than 6 kV
- 8.3. Market Analysis, Insights and Forecast - by Application
- 8.3.1. Residential
- 8.3.2. Commercial
- 8.3.3. Automotive
- 8.3.4. Industrial
- 8.1. Market Analysis, Insights and Forecast - by Motor Type
- 9. South America Electric Motor Industry Analysis, Insights and Forecast, 2019-2031
- 9.1. Market Analysis, Insights and Forecast - by Motor Type
- 9.1.1. AC
- 9.1.2. DC
- 9.2. Market Analysis, Insights and Forecast - by Voltage
- 9.2.1. Less than 1 kV
- 9.2.2. Between 1kV-6kV
- 9.2.3. Higher than 6 kV
- 9.3. Market Analysis, Insights and Forecast - by Application
- 9.3.1. Residential
- 9.3.2. Commercial
- 9.3.3. Automotive
- 9.3.4. Industrial
- 9.1. Market Analysis, Insights and Forecast - by Motor Type
- 10. Middle East and Africa Electric Motor Industry Analysis, Insights and Forecast, 2019-2031
- 10.1. Market Analysis, Insights and Forecast - by Motor Type
- 10.1.1. AC
- 10.1.2. DC
- 10.2. Market Analysis, Insights and Forecast - by Voltage
- 10.2.1. Less than 1 kV
- 10.2.2. Between 1kV-6kV
- 10.2.3. Higher than 6 kV
- 10.3. Market Analysis, Insights and Forecast - by Application
- 10.3.1. Residential
- 10.3.2. Commercial
- 10.3.3. Automotive
- 10.3.4. Industrial
- 10.1. Market Analysis, Insights and Forecast - by Motor Type
- 11. North America Electric Motor Industry Analysis, Insights and Forecast, 2019-2031
- 11.1. Market Analysis, Insights and Forecast - By Country/Sub-region
- 11.1.1 United States
- 11.1.2 Canada
- 11.1.3 Rest of North America
- 12. Europe Electric Motor Industry Analysis, Insights and Forecast, 2019-2031
- 12.1. Market Analysis, Insights and Forecast - By Country/Sub-region
- 12.1.1 Germany
- 12.1.2 France
- 12.1.3 United Kingdom
- 12.1.4 Rest of Europe
- 13. Asia Pacific Electric Motor Industry Analysis, Insights and Forecast, 2019-2031
- 13.1. Market Analysis, Insights and Forecast - By Country/Sub-region
- 13.1.1 China
- 13.1.2 India
- 13.1.3 Japan
- 13.1.4 South Korea
- 13.1.5 Rest of Asia Pacific
- 14. South America Electric Motor Industry Analysis, Insights and Forecast, 2019-2031
- 14.1. Market Analysis, Insights and Forecast - By Country/Sub-region
- 14.1.1 Brazil
- 14.1.2 Argentina
- 14.1.3 Rest of South America
- 15. Middle East and Africa Electric Motor Industry Analysis, Insights and Forecast, 2019-2031
- 15.1. Market Analysis, Insights and Forecast - By Country/Sub-region
- 15.1.1 Saudi Arabia
- 15.1.2 United Arab Emirates
- 15.1.3 South Africa
- 15.1.4 Rest of Middle East and Africa
- 16. Competitive Analysis
- 16.1. Global Market Share Analysis 2024
- 16.2. Company Profiles
- 16.2.1 Rockwell Automation
- 16.2.1.1. Overview
- 16.2.1.2. Products
- 16.2.1.3. SWOT Analysis
- 16.2.1.4. Recent Developments
- 16.2.1.5. Financials (Based on Availability)
- 16.2.2 ABB Ltd
- 16.2.2.1. Overview
- 16.2.2.2. Products
- 16.2.2.3. SWOT Analysis
- 16.2.2.4. Recent Developments
- 16.2.2.5. Financials (Based on Availability)
- 16.2.3 AMETEK Inc
- 16.2.3.1. Overview
- 16.2.3.2. Products
- 16.2.3.3. SWOT Analysis
- 16.2.3.4. Recent Developments
- 16.2.3.5. Financials (Based on Availability)
- 16.2.4 TECO-Westinghouse Motor Company
- 16.2.4.1. Overview
- 16.2.4.2. Products
- 16.2.4.3. SWOT Analysis
- 16.2.4.4. Recent Developments
- 16.2.4.5. Financials (Based on Availability)
- 16.2.5 Weg SA
- 16.2.5.1. Overview
- 16.2.5.2. Products
- 16.2.5.3. SWOT Analysis
- 16.2.5.4. Recent Developments
- 16.2.5.5. Financials (Based on Availability)
- 16.2.6 Toshiba Corp
- 16.2.6.1. Overview
- 16.2.6.2. Products
- 16.2.6.3. SWOT Analysis
- 16.2.6.4. Recent Developments
- 16.2.6.5. Financials (Based on Availability)
- 16.2.7 Nidec Corporation
- 16.2.7.1. Overview
- 16.2.7.2. Products
- 16.2.7.3. SWOT Analysis
- 16.2.7.4. Recent Developments
- 16.2.7.5. Financials (Based on Availability)
- 16.2.8 Johnson Electric Holdings Limited
- 16.2.8.1. Overview
- 16.2.8.2. Products
- 16.2.8.3. SWOT Analysis
- 16.2.8.4. Recent Developments
- 16.2.8.5. Financials (Based on Availability)
- 16.2.9 Siemens AG
- 16.2.9.1. Overview
- 16.2.9.2. Products
- 16.2.9.3. SWOT Analysis
- 16.2.9.4. Recent Developments
- 16.2.9.5. Financials (Based on Availability)
- 16.2.10 Hitachi Ltd
- 16.2.10.1. Overview
- 16.2.10.2. Products
- 16.2.10.3. SWOT Analysis
- 16.2.10.4. Recent Developments
- 16.2.10.5. Financials (Based on Availability)
- 16.2.11 Robert Bosch GmbH
- 16.2.11.1. Overview
- 16.2.11.2. Products
- 16.2.11.3. SWOT Analysis
- 16.2.11.4. Recent Developments
- 16.2.11.5. Financials (Based on Availability)
- 16.2.12 Regal Rexnord Corporation
- 16.2.12.1. Overview
- 16.2.12.2. Products
- 16.2.12.3. SWOT Analysis
- 16.2.12.4. Recent Developments
- 16.2.12.5. Financials (Based on Availability)
- 16.2.1 Rockwell Automation
List of Figures
- Figure 1: Global Electric Motor Industry Revenue Breakdown (Million, %) by Region 2024 & 2032
- Figure 2: North America Electric Motor Industry Revenue (Million), by Country 2024 & 2032
- Figure 3: North America Electric Motor Industry Revenue Share (%), by Country 2024 & 2032
- Figure 4: Europe Electric Motor Industry Revenue (Million), by Country 2024 & 2032
- Figure 5: Europe Electric Motor Industry Revenue Share (%), by Country 2024 & 2032
- Figure 6: Asia Pacific Electric Motor Industry Revenue (Million), by Country 2024 & 2032
- Figure 7: Asia Pacific Electric Motor Industry Revenue Share (%), by Country 2024 & 2032
- Figure 8: South America Electric Motor Industry Revenue (Million), by Country 2024 & 2032
- Figure 9: South America Electric Motor Industry Revenue Share (%), by Country 2024 & 2032
- Figure 10: Middle East and Africa Electric Motor Industry Revenue (Million), by Country 2024 & 2032
- Figure 11: Middle East and Africa Electric Motor Industry Revenue Share (%), by Country 2024 & 2032
- Figure 12: North America Electric Motor Industry Revenue (Million), by Motor Type 2024 & 2032
- Figure 13: North America Electric Motor Industry Revenue Share (%), by Motor Type 2024 & 2032
- Figure 14: North America Electric Motor Industry Revenue (Million), by Voltage 2024 & 2032
- Figure 15: North America Electric Motor Industry Revenue Share (%), by Voltage 2024 & 2032
- Figure 16: North America Electric Motor Industry Revenue (Million), by Application 2024 & 2032
- Figure 17: North America Electric Motor Industry Revenue Share (%), by Application 2024 & 2032
- Figure 18: North America Electric Motor Industry Revenue (Million), by Country 2024 & 2032
- Figure 19: North America Electric Motor Industry Revenue Share (%), by Country 2024 & 2032
- Figure 20: Europe Electric Motor Industry Revenue (Million), by Motor Type 2024 & 2032
- Figure 21: Europe Electric Motor Industry Revenue Share (%), by Motor Type 2024 & 2032
- Figure 22: Europe Electric Motor Industry Revenue (Million), by Voltage 2024 & 2032
- Figure 23: Europe Electric Motor Industry Revenue Share (%), by Voltage 2024 & 2032
- Figure 24: Europe Electric Motor Industry Revenue (Million), by Application 2024 & 2032
- Figure 25: Europe Electric Motor Industry Revenue Share (%), by Application 2024 & 2032
- Figure 26: Europe Electric Motor Industry Revenue (Million), by Country 2024 & 2032
- Figure 27: Europe Electric Motor Industry Revenue Share (%), by Country 2024 & 2032
- Figure 28: Asia Pacific Electric Motor Industry Revenue (Million), by Motor Type 2024 & 2032
- Figure 29: Asia Pacific Electric Motor Industry Revenue Share (%), by Motor Type 2024 & 2032
- Figure 30: Asia Pacific Electric Motor Industry Revenue (Million), by Voltage 2024 & 2032
- Figure 31: Asia Pacific Electric Motor Industry Revenue Share (%), by Voltage 2024 & 2032
- Figure 32: Asia Pacific Electric Motor Industry Revenue (Million), by Application 2024 & 2032
- Figure 33: Asia Pacific Electric Motor Industry Revenue Share (%), by Application 2024 & 2032
- Figure 34: Asia Pacific Electric Motor Industry Revenue (Million), by Country 2024 & 2032
- Figure 35: Asia Pacific Electric Motor Industry Revenue Share (%), by Country 2024 & 2032
- Figure 36: South America Electric Motor Industry Revenue (Million), by Motor Type 2024 & 2032
- Figure 37: South America Electric Motor Industry Revenue Share (%), by Motor Type 2024 & 2032
- Figure 38: South America Electric Motor Industry Revenue (Million), by Voltage 2024 & 2032
- Figure 39: South America Electric Motor Industry Revenue Share (%), by Voltage 2024 & 2032
- Figure 40: South America Electric Motor Industry Revenue (Million), by Application 2024 & 2032
- Figure 41: South America Electric Motor Industry Revenue Share (%), by Application 2024 & 2032
- Figure 42: South America Electric Motor Industry Revenue (Million), by Country 2024 & 2032
- Figure 43: South America Electric Motor Industry Revenue Share (%), by Country 2024 & 2032
- Figure 44: Middle East and Africa Electric Motor Industry Revenue (Million), by Motor Type 2024 & 2032
- Figure 45: Middle East and Africa Electric Motor Industry Revenue Share (%), by Motor Type 2024 & 2032
- Figure 46: Middle East and Africa Electric Motor Industry Revenue (Million), by Voltage 2024 & 2032
- Figure 47: Middle East and Africa Electric Motor Industry Revenue Share (%), by Voltage 2024 & 2032
- Figure 48: Middle East and Africa Electric Motor Industry Revenue (Million), by Application 2024 & 2032
- Figure 49: Middle East and Africa Electric Motor Industry Revenue Share (%), by Application 2024 & 2032
- Figure 50: Middle East and Africa Electric Motor Industry Revenue (Million), by Country 2024 & 2032
- Figure 51: Middle East and Africa Electric Motor Industry Revenue Share (%), by Country 2024 & 2032
List of Tables
- Table 1: Global Electric Motor Industry Revenue Million Forecast, by Region 2019 & 2032
- Table 2: Global Electric Motor Industry Revenue Million Forecast, by Motor Type 2019 & 2032
- Table 3: Global Electric Motor Industry Revenue Million Forecast, by Voltage 2019 & 2032
- Table 4: Global Electric Motor Industry Revenue Million Forecast, by Application 2019 & 2032
- Table 5: Global Electric Motor Industry Revenue Million Forecast, by Region 2019 & 2032
- Table 6: Global Electric Motor Industry Revenue Million Forecast, by Country 2019 & 2032
- Table 7: United States Electric Motor Industry Revenue (Million) Forecast, by Application 2019 & 2032
- Table 8: Canada Electric Motor Industry Revenue (Million) Forecast, by Application 2019 & 2032
- Table 9: Rest of North America Electric Motor Industry Revenue (Million) Forecast, by Application 2019 & 2032
- Table 10: Global Electric Motor Industry Revenue Million Forecast, by Country 2019 & 2032
- Table 11: Germany Electric Motor Industry Revenue (Million) Forecast, by Application 2019 & 2032
- Table 12: France Electric Motor Industry Revenue (Million) Forecast, by Application 2019 & 2032
- Table 13: United Kingdom Electric Motor Industry Revenue (Million) Forecast, by Application 2019 & 2032
- Table 14: Rest of Europe Electric Motor Industry Revenue (Million) Forecast, by Application 2019 & 2032
- Table 15: Global Electric Motor Industry Revenue Million Forecast, by Country 2019 & 2032
- Table 16: China Electric Motor Industry Revenue (Million) Forecast, by Application 2019 & 2032
- Table 17: India Electric Motor Industry Revenue (Million) Forecast, by Application 2019 & 2032
- Table 18: Japan Electric Motor Industry Revenue (Million) Forecast, by Application 2019 & 2032
- Table 19: South Korea Electric Motor Industry Revenue (Million) Forecast, by Application 2019 & 2032
- Table 20: Rest of Asia Pacific Electric Motor Industry Revenue (Million) Forecast, by Application 2019 & 2032
- Table 21: Global Electric Motor Industry Revenue Million Forecast, by Country 2019 & 2032
- Table 22: Brazil Electric Motor Industry Revenue (Million) Forecast, by Application 2019 & 2032
- Table 23: Argentina Electric Motor Industry Revenue (Million) Forecast, by Application 2019 & 2032
- Table 24: Rest of South America Electric Motor Industry Revenue (Million) Forecast, by Application 2019 & 2032
- Table 25: Global Electric Motor Industry Revenue Million Forecast, by Country 2019 & 2032
- Table 26: Saudi Arabia Electric Motor Industry Revenue (Million) Forecast, by Application 2019 & 2032
- Table 27: United Arab Emirates Electric Motor Industry Revenue (Million) Forecast, by Application 2019 & 2032
- Table 28: South Africa Electric Motor Industry Revenue (Million) Forecast, by Application 2019 & 2032
- Table 29: Rest of Middle East and Africa Electric Motor Industry Revenue (Million) Forecast, by Application 2019 & 2032
- Table 30: Global Electric Motor Industry Revenue Million Forecast, by Motor Type 2019 & 2032
- Table 31: Global Electric Motor Industry Revenue Million Forecast, by Voltage 2019 & 2032
- Table 32: Global Electric Motor Industry Revenue Million Forecast, by Application 2019 & 2032
- Table 33: Global Electric Motor Industry Revenue Million Forecast, by Country 2019 & 2032
- Table 34: United States Electric Motor Industry Revenue (Million) Forecast, by Application 2019 & 2032
- Table 35: Canada Electric Motor Industry Revenue (Million) Forecast, by Application 2019 & 2032
- Table 36: Rest of North America Electric Motor Industry Revenue (Million) Forecast, by Application 2019 & 2032
- Table 37: Global Electric Motor Industry Revenue Million Forecast, by Motor Type 2019 & 2032
- Table 38: Global Electric Motor Industry Revenue Million Forecast, by Voltage 2019 & 2032
- Table 39: Global Electric Motor Industry Revenue Million Forecast, by Application 2019 & 2032
- Table 40: Global Electric Motor Industry Revenue Million Forecast, by Country 2019 & 2032
- Table 41: Germany Electric Motor Industry Revenue (Million) Forecast, by Application 2019 & 2032
- Table 42: France Electric Motor Industry Revenue (Million) Forecast, by Application 2019 & 2032
- Table 43: United Kingdom Electric Motor Industry Revenue (Million) Forecast, by Application 2019 & 2032
- Table 44: Rest of Europe Electric Motor Industry Revenue (Million) Forecast, by Application 2019 & 2032
- Table 45: Global Electric Motor Industry Revenue Million Forecast, by Motor Type 2019 & 2032
- Table 46: Global Electric Motor Industry Revenue Million Forecast, by Voltage 2019 & 2032
- Table 47: Global Electric Motor Industry Revenue Million Forecast, by Application 2019 & 2032
- Table 48: Global Electric Motor Industry Revenue Million Forecast, by Country 2019 & 2032
- Table 49: China Electric Motor Industry Revenue (Million) Forecast, by Application 2019 & 2032
- Table 50: India Electric Motor Industry Revenue (Million) Forecast, by Application 2019 & 2032
- Table 51: Japan Electric Motor Industry Revenue (Million) Forecast, by Application 2019 & 2032
- Table 52: South Korea Electric Motor Industry Revenue (Million) Forecast, by Application 2019 & 2032
- Table 53: Rest of Asia Pacific Electric Motor Industry Revenue (Million) Forecast, by Application 2019 & 2032
- Table 54: Global Electric Motor Industry Revenue Million Forecast, by Motor Type 2019 & 2032
- Table 55: Global Electric Motor Industry Revenue Million Forecast, by Voltage 2019 & 2032
- Table 56: Global Electric Motor Industry Revenue Million Forecast, by Application 2019 & 2032
- Table 57: Global Electric Motor Industry Revenue Million Forecast, by Country 2019 & 2032
- Table 58: Brazil Electric Motor Industry Revenue (Million) Forecast, by Application 2019 & 2032
- Table 59: Argentina Electric Motor Industry Revenue (Million) Forecast, by Application 2019 & 2032
- Table 60: Rest of South America Electric Motor Industry Revenue (Million) Forecast, by Application 2019 & 2032
- Table 61: Global Electric Motor Industry Revenue Million Forecast, by Motor Type 2019 & 2032
- Table 62: Global Electric Motor Industry Revenue Million Forecast, by Voltage 2019 & 2032
- Table 63: Global Electric Motor Industry Revenue Million Forecast, by Application 2019 & 2032
- Table 64: Global Electric Motor Industry Revenue Million Forecast, by Country 2019 & 2032
- Table 65: Saudi Arabia Electric Motor Industry Revenue (Million) Forecast, by Application 2019 & 2032
- Table 66: United Arab Emirates Electric Motor Industry Revenue (Million) Forecast, by Application 2019 & 2032
- Table 67: South Africa Electric Motor Industry Revenue (Million) Forecast, by Application 2019 & 2032
- Table 68: Rest of Middle East and Africa Electric Motor Industry Revenue (Million) Forecast, by Application 2019 & 2032
Frequently Asked Questions
1. What is the projected Compound Annual Growth Rate (CAGR) of the Electric Motor Industry?
The projected CAGR is approximately 6.97%.
2. Which companies are prominent players in the Electric Motor Industry?
Key companies in the market include Rockwell Automation, ABB Ltd, AMETEK Inc, TECO-Westinghouse Motor Company, Weg SA, Toshiba Corp, Nidec Corporation, Johnson Electric Holdings Limited, Siemens AG, Hitachi Ltd, Robert Bosch GmbH, Regal Rexnord Corporation.
3. What are the main segments of the Electric Motor Industry?
The market segments include Motor Type, Voltage, Application.
4. Can you provide details about the market size?
The market size is estimated to be USD 136.95 Million as of 2022.
5. What are some drivers contributing to market growth?
4Increasing Residential Usage of the Electric Motor. Rising Adoption of Electric Vehicles.
6. What are the notable trends driving market growth?
Automotive Segment to Witness Growth.
7. Are there any restraints impacting market growth?
Fluctuating Prices of Raw Materials.
8. Can you provide examples of recent developments in the market?
February 2023: Electronic component maker Flash announced a technical collaboration with Slovenia-based GEM motors to develop electric motors. Under the partnership, both brands will manufacture hub motors for various electric vehicle segments in the range of 1 kW to 15 kW.
9. What pricing options are available for accessing the report?
Pricing options include single-user, multi-user, and enterprise licenses priced at USD 4750, USD 5250, and USD 8750 respectively.
10. Is the market size provided in terms of value or volume?
The market size is provided in terms of value, measured in Million.
11. Are there any specific market keywords associated with the report?
Yes, the market keyword associated with the report is "Electric Motor Industry," which aids in identifying and referencing the specific market segment covered.
12. How do I determine which pricing option suits my needs best?
The pricing options vary based on user requirements and access needs. Individual users may opt for single-user licenses, while businesses requiring broader access may choose multi-user or enterprise licenses for cost-effective access to the report.
13. Are there any additional resources or data provided in the Electric Motor Industry report?
While the report offers comprehensive insights, it's advisable to review the specific contents or supplementary materials provided to ascertain if additional resources or data are available.
14. How can I stay updated on further developments or reports in the Electric Motor Industry?
To stay informed about further developments, trends, and reports in the Electric Motor Industry, consider subscribing to industry newsletters, following relevant companies and organizations, or regularly checking reputable industry news sources and publications.
Methodology
Step 1 - Identification of Relevant Samples Size from Population Database


Step 2 - Approaches for Defining Global Market Size (Value, Volume* & Price*)

Note*: In applicable scenarios
Step 3 - Data Sources
Primary Research
- Web Analytics
- Survey Reports
- Research Institute
- Latest Research Reports
- Opinion Leaders
Secondary Research
- Annual Reports
- White Paper
- Latest Press Release
- Industry Association
- Paid Database
- Investor Presentations

Step 4 - Data Triangulation
Involves using different sources of information in order to increase the validity of a study
These sources are likely to be stakeholders in a program - participants, other researchers, program staff, other community members, and so on.
Then we put all data in single framework & apply various statistical tools to find out the dynamic on the market.
During the analysis stage, feedback from the stakeholder groups would be compared to determine areas of agreement as well as areas of divergence
