

Key Insights
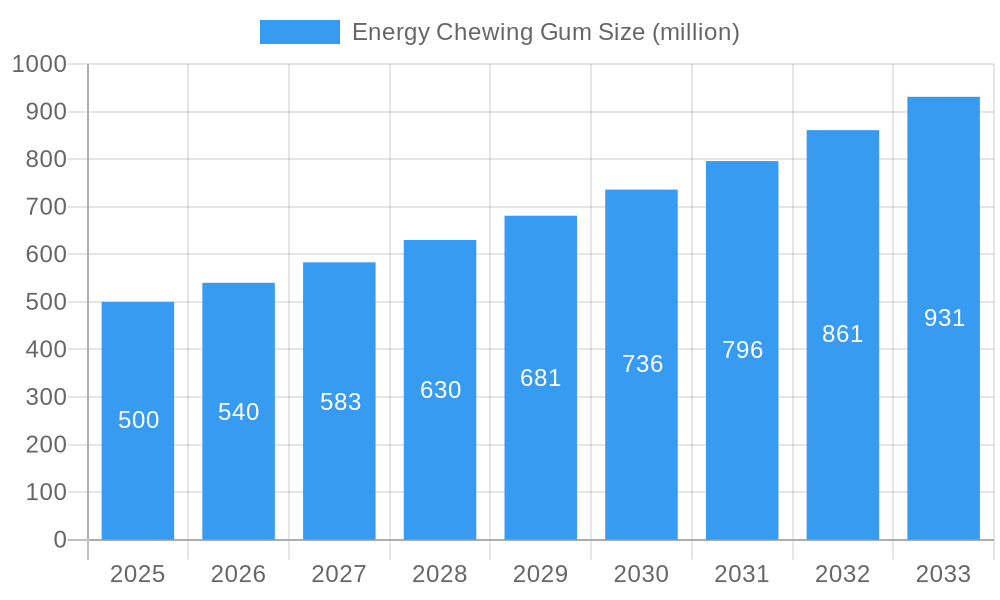
The energy chewing gum market, while still niche, exhibits strong growth potential fueled by increasing consumer demand for convenient and effective energy boosts. The market's value is estimated at $500 million in 2025, projecting a compound annual growth rate (CAGR) of 8% between 2025 and 2033, reaching approximately $1 billion by 2033. This growth is primarily driven by the rising popularity of functional foods and beverages, health-conscious consumers seeking alternatives to sugary drinks and energy shots, and the convenience factor offered by chewing gum. Key trends include the incorporation of natural and organic ingredients, the development of specialized formulations targeting specific needs (e.g., focus, endurance), and an expansion into diverse flavor profiles to broaden consumer appeal. Market restraints include the relatively high price point compared to traditional chewing gum, potential concerns about artificial ingredients, and the need for increased consumer awareness regarding the efficacy of energy chewing gum. Major players like Mars, Mondelez, and Lotte are actively involved, while smaller, specialized companies are focusing on innovative formulations and ingredients to capture market share. The market segmentation is likely based on ingredient type (natural vs. artificial), energy source (caffeine, guarana, etc.), and distribution channels (online, retail). Regional differences in consumer preferences and regulatory landscapes will also influence market growth, with North America and Europe currently dominating the market.
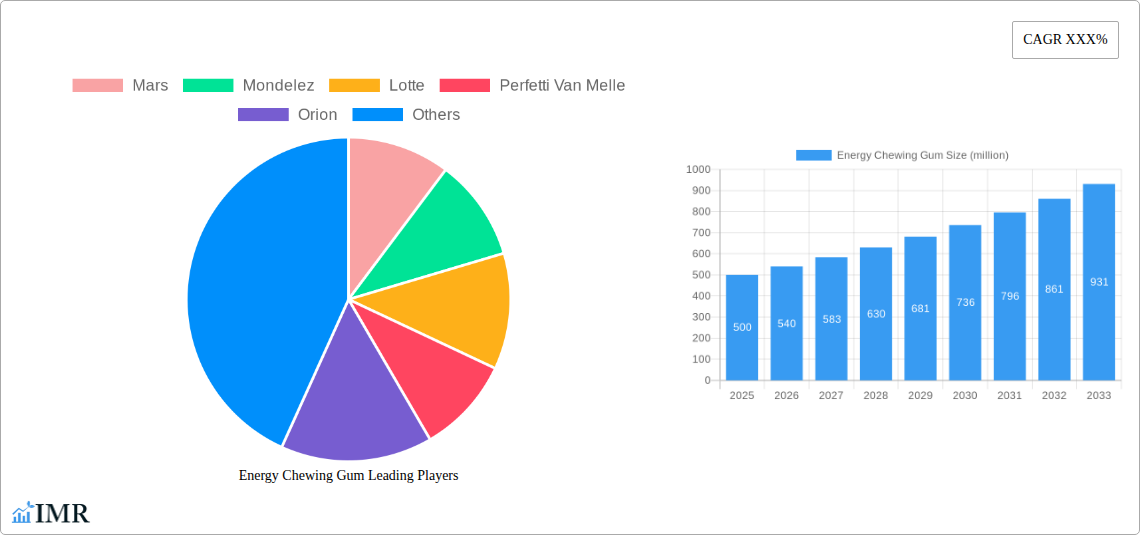
Energy Chewing Gum Market Size (In Million)
The competitive landscape is dynamic, with established confectionery giants competing with smaller, more agile companies specializing in functional foods. This dynamic is leading to product innovation and diversification. Future growth will depend on continued product development focusing on health and wellness benefits, expansion into new geographical markets, and effective marketing campaigns highlighting the convenience and effectiveness of energy chewing gum as a healthy energy alternative. Successfully navigating regulatory hurdles and maintaining transparency around ingredients will be crucial for long-term market success. The increasing focus on natural and sustainable ingredients offers opportunities for businesses committed to environmentally conscious practices. Strategic partnerships and acquisitions could also reshape the market landscape in the coming years.
Energy Chewing Gum Company Market Share
Energy Chewing Gum Market Report: 2019-2033
This comprehensive report provides a detailed analysis of the global energy chewing gum market, encompassing market dynamics, growth trends, regional segmentation, product landscape, key players, and future outlook. The study period covers 2019-2033, with 2025 as the base and estimated year. The forecast period is 2025-2033, and the historical period is 2019-2024. This report is invaluable for industry professionals, investors, and market researchers seeking to understand and capitalize on opportunities within this rapidly evolving sector. The parent market is the confectionery market (valued at xx million units in 2025), and the child market is the functional food and beverage market (valued at xx million units in 2025).
Energy Chewing Gum Market Dynamics & Structure
The energy chewing gum market is characterized by moderate concentration, with key players like Mars, Mondelez, and Lotte holding significant market share (estimated at xx% combined in 2025). Technological innovation, particularly in natural energy source integration and improved flavor profiles, is a major driver. Regulatory frameworks concerning labeling and ingredient safety are evolving and impact market dynamics. Competitive substitutes include energy drinks and bars, impacting market penetration. The primary end-users are young adults and athletes seeking convenient energy boosts. M&A activity in the sector has been moderate (xx deals in the last 5 years), with larger players focusing on acquiring smaller, specialized brands.
- Market Concentration: Moderately concentrated, with top 3 players holding xx% market share in 2025.
- Technological Innovation: Focus on natural ingredients, enhanced flavor profiles, and functional benefits.
- Regulatory Framework: Stringent labeling and ingredient regulations are shaping product development.
- Competitive Substitutes: Energy drinks and bars pose a significant competitive threat.
- End-User Demographics: Primarily young adults (18-35 years) and athletes.
- M&A Activity: Moderate activity, driven by acquisition of specialized brands by larger players.
Energy Chewing Gum Growth Trends & Insights
The global energy chewing gum market exhibited a CAGR of xx% during 2019-2024, reaching xx million units in 2024. The market is projected to maintain a steady growth trajectory, reaching xx million units by 2033, with a forecasted CAGR of xx% during 2025-2033. This growth is driven by increasing consumer awareness of functional foods and beverages, along with the growing preference for convenient and portable energy sources. Technological advancements in natural energy ingredients and improved formulations are further fueling adoption rates. Changing consumer lifestyles and increased demand for on-the-go energy solutions contribute to market expansion. Market penetration is estimated at xx% in 2025, indicating significant untapped potential.
Dominant Regions, Countries, or Segments in Energy Chewing Gum
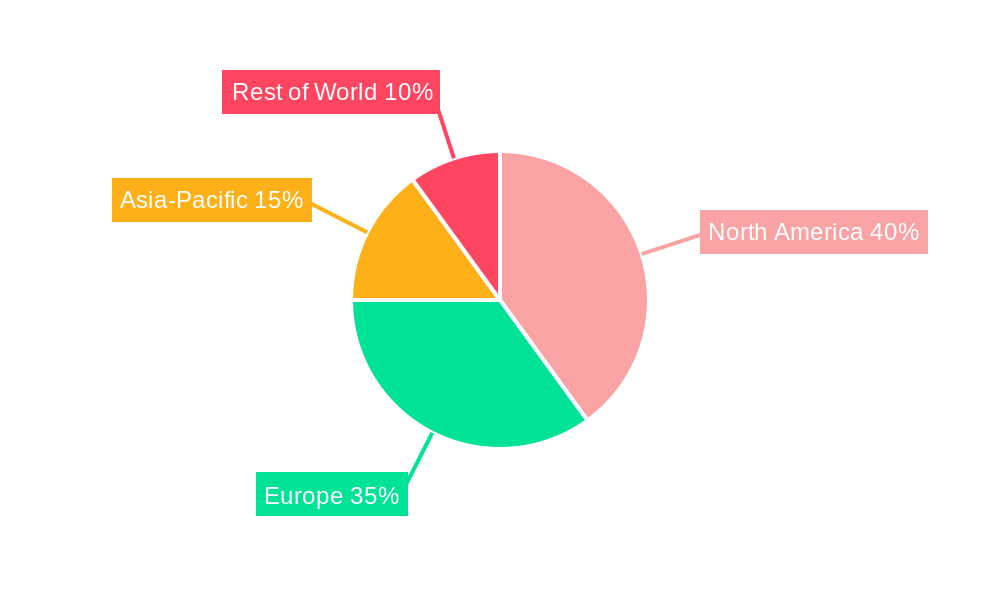
North America currently dominates the energy chewing gum market, driven by high consumer disposable income, strong demand for convenient energy options, and established distribution channels. The region holds an estimated xx% market share in 2025. Europe follows as a significant market, with steady growth projected due to rising health consciousness and increasing demand for natural energy alternatives. Asia-Pacific is expected to witness considerable growth over the forecast period, driven by factors such as increasing disposable incomes, changing lifestyles, and the growing popularity of functional foods.
- Key Drivers in North America: High consumer spending, established distribution networks, strong demand for convenient energy solutions.
- Key Drivers in Europe: Growing health consciousness, increasing demand for natural energy alternatives, strong regulatory frameworks.
- Key Drivers in Asia-Pacific: Rising disposable incomes, changing lifestyles, and growing popularity of functional foods.
Energy Chewing Gum Product Landscape
The energy chewing gum market offers a diverse range of products, categorized by energy source (e.g., caffeine, guarana, ginseng), flavor profiles, and added functional benefits (e.g., improved focus, enhanced endurance). Innovation focuses on incorporating natural energy sources, reducing sugar content, and offering customized blends to cater to specific consumer needs. These products leverage unique selling propositions such as long-lasting energy release, improved taste, and enhanced portability compared to traditional energy supplements. Technological advancements involve utilizing microencapsulation techniques for controlled release of energy components and enhanced flavor stabilization.
Key Drivers, Barriers & Challenges in Energy Chewing Gum
Key Drivers:
- Growing consumer demand for convenient and portable energy sources.
- Increasing health consciousness and preference for natural energy alternatives.
- Technological advancements leading to improved product formulations and enhanced functionality.
- Strategic partnerships and product diversification strategies by key players.
Key Challenges & Restraints:
- Intense competition from established players and emerging brands.
- Concerns regarding the long-term health effects of excessive caffeine or other stimulants.
- Stringent regulatory requirements regarding labeling and ingredient safety.
- Fluctuations in raw material prices and supply chain disruptions. This resulted in a xx% increase in production costs in 2024.
Emerging Opportunities in Energy Chewing Gum
- Expansion into untapped markets in developing economies.
- Development of customized energy gum formulations for specific consumer segments (e.g., athletes, students).
- Incorporation of innovative ingredients and functional benefits (e.g., nootropics, probiotics).
- Leveraging e-commerce and direct-to-consumer channels for wider reach and enhanced brand building.
Growth Accelerators in the Energy Chewing Gum Industry
Technological breakthroughs in ingredient delivery systems and flavor enhancement are key growth accelerators. Strategic partnerships between energy gum manufacturers and health and wellness brands enhance market reach and credibility. Market expansion into new geographical regions with growing demand for functional foods is crucial for long-term growth. These strategies, combined with increased marketing and promotional activities, significantly contribute to market expansion.
Key Players Shaping the Energy Chewing Gum Market
Notable Milestones in Energy Chewing Gum Sector
- 2020: Xlear launched a new line of sugar-free energy chewing gum.
- 2021: Mars introduced a new energy gum with natural caffeine sources.
- 2022: Mondelez acquired a smaller energy gum brand, expanding its product portfolio.
- 2023: Several new energy gum brands entered the market, increasing competition.
- 2024: Regulations concerning caffeine content in energy gums were tightened in certain regions.
In-Depth Energy Chewing Gum Market Outlook
The energy chewing gum market is poised for significant growth over the next decade, driven by sustained consumer demand for convenient and healthy energy alternatives. Strategic partnerships, product innovation, and market expansion into new geographical regions will be critical for success. The focus on natural ingredients and tailored formulations will be key differentiators. The market's future potential is substantial, presenting attractive opportunities for both established players and emerging brands.
Energy Chewing Gum Segmentation
-
1. Application
- 1.1. Supermarkets
- 1.2. Online Stores
- 1.3. Grocery Stores
- 1.4. Others
-
2. Type
- 2.1. Tooth Protection Gum
- 2.2. Quit Smoking Gum
- 2.3. Weight Loss Gum
- 2.4. Others
Energy Chewing Gum Segmentation By Geography
-
1. North America
- 1.1. United States
- 1.2. Canada
- 1.3. Mexico
-
2. South America
- 2.1. Brazil
- 2.2. Argentina
- 2.3. Rest of South America
-
3. Europe
- 3.1. United Kingdom
- 3.2. Germany
- 3.3. France
- 3.4. Italy
- 3.5. Spain
- 3.6. Russia
- 3.7. Benelux
- 3.8. Nordics
- 3.9. Rest of Europe
-
4. Middle East & Africa
- 4.1. Turkey
- 4.2. Israel
- 4.3. GCC
- 4.4. North Africa
- 4.5. South Africa
- 4.6. Rest of Middle East & Africa
-
5. Asia Pacific
- 5.1. China
- 5.2. India
- 5.3. Japan
- 5.4. South Korea
- 5.5. ASEAN
- 5.6. Oceania
- 5.7. Rest of Asia Pacific
Energy Chewing Gum Regional Market Share
Geographic Coverage of Energy Chewing Gum
Energy Chewing Gum REPORT HIGHLIGHTS
| Aspects | Details |
|---|---|
| Study Period | 2020-2034 |
| Base Year | 2025 |
| Estimated Year | 2026 |
| Forecast Period | 2026-2034 |
| Historical Period | 2020-2025 |
| Growth Rate | CAGR of 7.85% from 2020-2034 |
| Segmentation |
|
Table of Contents
- 1. Introduction
- 1.1. Research Scope
- 1.2. Market Segmentation
- 1.3. Research Objective
- 1.4. Definitions and Assumptions
- 2. Executive Summary
- 2.1. Market Snapshot
- 3. Market Dynamics
- 3.1. Market Drivers
- 3.2. Market Restrains
- 3.3. Market Trends
- 3.4. Market Opportunities
- 4. Market Factor Analysis
- 4.1. Porters Five Forces
- 4.1.1. Bargaining Power of Suppliers
- 4.1.2. Bargaining Power of Buyers
- 4.1.3. Threat of New Entrants
- 4.1.4. Threat of Substitutes
- 4.1.5. Competitive Rivalry
- 4.2. PESTEL analysis
- 4.3. BCG Analysis
- 4.3.1. Stars (High Growth, High Market Share)
- 4.3.2. Cash Cows (Low Growth, High Market Share)
- 4.3.3. Question Mark (High Growth, Low Market Share)
- 4.3.4. Dogs (Low Growth, Low Market Share)
- 4.4. Ansoff Matrix Analysis
- 4.5. Supply Chain Analysis
- 4.6. Regulatory Landscape
- 4.7. Current Market Potential and Opportunity Assessment (TAM–SAM–SOM Framework)
- 4.8. IMR Analyst Note
- 4.1. Porters Five Forces
- 5. Market Analysis, Insights and Forecast 2021-2033
- 5.1. Market Analysis, Insights and Forecast - by Application
- 5.1.1. Supermarkets
- 5.1.2. Online Stores
- 5.1.3. Grocery Stores
- 5.1.4. Others
- 5.2. Market Analysis, Insights and Forecast - by Type
- 5.2.1. Tooth Protection Gum
- 5.2.2. Quit Smoking Gum
- 5.2.3. Weight Loss Gum
- 5.2.4. Others
- 5.3. Market Analysis, Insights and Forecast - by Region
- 5.3.1. North America
- 5.3.2. South America
- 5.3.3. Europe
- 5.3.4. Middle East & Africa
- 5.3.5. Asia Pacific
- 5.1. Market Analysis, Insights and Forecast - by Application
- 6. Global Energy Chewing Gum Analysis, Insights and Forecast, 2021-2033
- 6.1. Market Analysis, Insights and Forecast - by Application
- 6.1.1. Supermarkets
- 6.1.2. Online Stores
- 6.1.3. Grocery Stores
- 6.1.4. Others
- 6.2. Market Analysis, Insights and Forecast - by Type
- 6.2.1. Tooth Protection Gum
- 6.2.2. Quit Smoking Gum
- 6.2.3. Weight Loss Gum
- 6.2.4. Others
- 6.1. Market Analysis, Insights and Forecast - by Application
- 7. North America Energy Chewing Gum Analysis, Insights and Forecast, 2020-2032
- 7.1. Market Analysis, Insights and Forecast - by Application
- 7.1.1. Supermarkets
- 7.1.2. Online Stores
- 7.1.3. Grocery Stores
- 7.1.4. Others
- 7.2. Market Analysis, Insights and Forecast - by Type
- 7.2.1. Tooth Protection Gum
- 7.2.2. Quit Smoking Gum
- 7.2.3. Weight Loss Gum
- 7.2.4. Others
- 7.1. Market Analysis, Insights and Forecast - by Application
- 8. South America Energy Chewing Gum Analysis, Insights and Forecast, 2020-2032
- 8.1. Market Analysis, Insights and Forecast - by Application
- 8.1.1. Supermarkets
- 8.1.2. Online Stores
- 8.1.3. Grocery Stores
- 8.1.4. Others
- 8.2. Market Analysis, Insights and Forecast - by Type
- 8.2.1. Tooth Protection Gum
- 8.2.2. Quit Smoking Gum
- 8.2.3. Weight Loss Gum
- 8.2.4. Others
- 8.1. Market Analysis, Insights and Forecast - by Application
- 9. Europe Energy Chewing Gum Analysis, Insights and Forecast, 2020-2032
- 9.1. Market Analysis, Insights and Forecast - by Application
- 9.1.1. Supermarkets
- 9.1.2. Online Stores
- 9.1.3. Grocery Stores
- 9.1.4. Others
- 9.2. Market Analysis, Insights and Forecast - by Type
- 9.2.1. Tooth Protection Gum
- 9.2.2. Quit Smoking Gum
- 9.2.3. Weight Loss Gum
- 9.2.4. Others
- 9.1. Market Analysis, Insights and Forecast - by Application
- 10. Middle East & Africa Energy Chewing Gum Analysis, Insights and Forecast, 2020-2032
- 10.1. Market Analysis, Insights and Forecast - by Application
- 10.1.1. Supermarkets
- 10.1.2. Online Stores
- 10.1.3. Grocery Stores
- 10.1.4. Others
- 10.2. Market Analysis, Insights and Forecast - by Type
- 10.2.1. Tooth Protection Gum
- 10.2.2. Quit Smoking Gum
- 10.2.3. Weight Loss Gum
- 10.2.4. Others
- 10.1. Market Analysis, Insights and Forecast - by Application
- 11. Asia Pacific Energy Chewing Gum Analysis, Insights and Forecast, 2020-2032
- 11.1. Market Analysis, Insights and Forecast - by Application
- 11.1.1. Supermarkets
- 11.1.2. Online Stores
- 11.1.3. Grocery Stores
- 11.1.4. Others
- 11.2. Market Analysis, Insights and Forecast - by Type
- 11.2.1. Tooth Protection Gum
- 11.2.2. Quit Smoking Gum
- 11.2.3. Weight Loss Gum
- 11.2.4. Others
- 11.1. Market Analysis, Insights and Forecast - by Application
- 12. Competitive Analysis
- 12.1. Company Profiles
- 12.1.1 Mars
- 12.1.1.1. Company Overview
- 12.1.1.2. Products
- 12.1.1.3. Company Financials
- 12.1.1.4. SWOT Analysis
- 12.1.2 Mondelez
- 12.1.2.1. Company Overview
- 12.1.2.2. Products
- 12.1.2.3. Company Financials
- 12.1.2.4. SWOT Analysis
- 12.1.3 Lotte
- 12.1.3.1. Company Overview
- 12.1.3.2. Products
- 12.1.3.3. Company Financials
- 12.1.3.4. SWOT Analysis
- 12.1.4 Perfetti Van Melle
- 12.1.4.1. Company Overview
- 12.1.4.2. Products
- 12.1.4.3. Company Financials
- 12.1.4.4. SWOT Analysis
- 12.1.5 Orion
- 12.1.5.1. Company Overview
- 12.1.5.2. Products
- 12.1.5.3. Company Financials
- 12.1.5.4. SWOT Analysis
- 12.1.6 Cloetta
- 12.1.6.1. Company Overview
- 12.1.6.2. Products
- 12.1.6.3. Company Financials
- 12.1.6.4. SWOT Analysis
- 12.1.7 Hager & Werken (Miradent)
- 12.1.7.1. Company Overview
- 12.1.7.2. Products
- 12.1.7.3. Company Financials
- 12.1.7.4. SWOT Analysis
- 12.1.8 GSK (Nicotinell)
- 12.1.8.1. Company Overview
- 12.1.8.2. Products
- 12.1.8.3. Company Financials
- 12.1.8.4. SWOT Analysis
- 12.1.9 Military Energy Gum
- 12.1.9.1. Company Overview
- 12.1.9.2. Products
- 12.1.9.3. Company Financials
- 12.1.9.4. SWOT Analysis
- 12.1.10 Xlear
- 12.1.10.1. Company Overview
- 12.1.10.2. Products
- 12.1.10.3. Company Financials
- 12.1.10.4. SWOT Analysis
- 12.1.11 GelStat Corporation (GSAC)
- 12.1.11.1. Company Overview
- 12.1.11.2. Products
- 12.1.11.3. Company Financials
- 12.1.11.4. SWOT Analysis
- 12.1.12 ZOFT Gum
- 12.1.12.1. Company Overview
- 12.1.12.2. Products
- 12.1.12.3. Company Financials
- 12.1.12.4. SWOT Analysis
- 12.1.13 Lemon Pharma
- 12.1.13.1. Company Overview
- 12.1.13.2. Products
- 12.1.13.3. Company Financials
- 12.1.13.4. SWOT Analysis
- 12.1.14 Think Gum LLC
- 12.1.14.1. Company Overview
- 12.1.14.2. Products
- 12.1.14.3. Company Financials
- 12.1.14.4. SWOT Analysis
- 12.1.15 Meiji Holdings
- 12.1.15.1. Company Overview
- 12.1.15.2. Products
- 12.1.15.3. Company Financials
- 12.1.15.4. SWOT Analysis
- 12.1.16 Peppersmith
- 12.1.16.1. Company Overview
- 12.1.16.2. Products
- 12.1.16.3. Company Financials
- 12.1.16.4. SWOT Analysis
- 12.1.17 WUG Functional Gums
- 12.1.17.1. Company Overview
- 12.1.17.2. Products
- 12.1.17.3. Company Financials
- 12.1.17.4. SWOT Analysis
- 12.1.18 Khloros (Chewpod)
- 12.1.18.1. Company Overview
- 12.1.18.2. Products
- 12.1.18.3. Company Financials
- 12.1.18.4. SWOT Analysis
- 12.1.19 Saludbox Labs
- 12.1.19.1. Company Overview
- 12.1.19.2. Products
- 12.1.19.3. Company Financials
- 12.1.19.4. SWOT Analysis
- 12.1.20 Yake
- 12.1.20.1. Company Overview
- 12.1.20.2. Products
- 12.1.20.3. Company Financials
- 12.1.20.4. SWOT Analysis
- 12.1.1 Mars
- 12.2. Market Entropy
- 12.2.1 Company's Key Areas Served
- 12.2.2 Recent Developments
- 12.3. Company Market Share Analysis 2025
- 12.3.1 Top 5 Companies Market Share Analysis
- 12.3.2 Top 3 Companies Market Share Analysis
- 12.4. List of Potential Customers
- 13. Research Methodology
List of Figures
- Figure 1: Global Energy Chewing Gum Revenue Breakdown (undefined, %) by Region 2025 & 2033
- Figure 2: North America Energy Chewing Gum Revenue (undefined), by Application 2025 & 2033
- Figure 3: North America Energy Chewing Gum Revenue Share (%), by Application 2025 & 2033
- Figure 4: North America Energy Chewing Gum Revenue (undefined), by Type 2025 & 2033
- Figure 5: North America Energy Chewing Gum Revenue Share (%), by Type 2025 & 2033
- Figure 6: North America Energy Chewing Gum Revenue (undefined), by Country 2025 & 2033
- Figure 7: North America Energy Chewing Gum Revenue Share (%), by Country 2025 & 2033
- Figure 8: South America Energy Chewing Gum Revenue (undefined), by Application 2025 & 2033
- Figure 9: South America Energy Chewing Gum Revenue Share (%), by Application 2025 & 2033
- Figure 10: South America Energy Chewing Gum Revenue (undefined), by Type 2025 & 2033
- Figure 11: South America Energy Chewing Gum Revenue Share (%), by Type 2025 & 2033
- Figure 12: South America Energy Chewing Gum Revenue (undefined), by Country 2025 & 2033
- Figure 13: South America Energy Chewing Gum Revenue Share (%), by Country 2025 & 2033
- Figure 14: Europe Energy Chewing Gum Revenue (undefined), by Application 2025 & 2033
- Figure 15: Europe Energy Chewing Gum Revenue Share (%), by Application 2025 & 2033
- Figure 16: Europe Energy Chewing Gum Revenue (undefined), by Type 2025 & 2033
- Figure 17: Europe Energy Chewing Gum Revenue Share (%), by Type 2025 & 2033
- Figure 18: Europe Energy Chewing Gum Revenue (undefined), by Country 2025 & 2033
- Figure 19: Europe Energy Chewing Gum Revenue Share (%), by Country 2025 & 2033
- Figure 20: Middle East & Africa Energy Chewing Gum Revenue (undefined), by Application 2025 & 2033
- Figure 21: Middle East & Africa Energy Chewing Gum Revenue Share (%), by Application 2025 & 2033
- Figure 22: Middle East & Africa Energy Chewing Gum Revenue (undefined), by Type 2025 & 2033
- Figure 23: Middle East & Africa Energy Chewing Gum Revenue Share (%), by Type 2025 & 2033
- Figure 24: Middle East & Africa Energy Chewing Gum Revenue (undefined), by Country 2025 & 2033
- Figure 25: Middle East & Africa Energy Chewing Gum Revenue Share (%), by Country 2025 & 2033
- Figure 26: Asia Pacific Energy Chewing Gum Revenue (undefined), by Application 2025 & 2033
- Figure 27: Asia Pacific Energy Chewing Gum Revenue Share (%), by Application 2025 & 2033
- Figure 28: Asia Pacific Energy Chewing Gum Revenue (undefined), by Type 2025 & 2033
- Figure 29: Asia Pacific Energy Chewing Gum Revenue Share (%), by Type 2025 & 2033
- Figure 30: Asia Pacific Energy Chewing Gum Revenue (undefined), by Country 2025 & 2033
- Figure 31: Asia Pacific Energy Chewing Gum Revenue Share (%), by Country 2025 & 2033
List of Tables
- Table 1: Global Energy Chewing Gum Revenue undefined Forecast, by Application 2020 & 2033
- Table 2: Global Energy Chewing Gum Revenue undefined Forecast, by Type 2020 & 2033
- Table 3: Global Energy Chewing Gum Revenue undefined Forecast, by Region 2020 & 2033
- Table 4: Global Energy Chewing Gum Revenue undefined Forecast, by Application 2020 & 2033
- Table 5: Global Energy Chewing Gum Revenue undefined Forecast, by Type 2020 & 2033
- Table 6: Global Energy Chewing Gum Revenue undefined Forecast, by Country 2020 & 2033
- Table 7: United States Energy Chewing Gum Revenue (undefined) Forecast, by Application 2020 & 2033
- Table 8: Canada Energy Chewing Gum Revenue (undefined) Forecast, by Application 2020 & 2033
- Table 9: Mexico Energy Chewing Gum Revenue (undefined) Forecast, by Application 2020 & 2033
- Table 10: Global Energy Chewing Gum Revenue undefined Forecast, by Application 2020 & 2033
- Table 11: Global Energy Chewing Gum Revenue undefined Forecast, by Type 2020 & 2033
- Table 12: Global Energy Chewing Gum Revenue undefined Forecast, by Country 2020 & 2033
- Table 13: Brazil Energy Chewing Gum Revenue (undefined) Forecast, by Application 2020 & 2033
- Table 14: Argentina Energy Chewing Gum Revenue (undefined) Forecast, by Application 2020 & 2033
- Table 15: Rest of South America Energy Chewing Gum Revenue (undefined) Forecast, by Application 2020 & 2033
- Table 16: Global Energy Chewing Gum Revenue undefined Forecast, by Application 2020 & 2033
- Table 17: Global Energy Chewing Gum Revenue undefined Forecast, by Type 2020 & 2033
- Table 18: Global Energy Chewing Gum Revenue undefined Forecast, by Country 2020 & 2033
- Table 19: United Kingdom Energy Chewing Gum Revenue (undefined) Forecast, by Application 2020 & 2033
- Table 20: Germany Energy Chewing Gum Revenue (undefined) Forecast, by Application 2020 & 2033
- Table 21: France Energy Chewing Gum Revenue (undefined) Forecast, by Application 2020 & 2033
- Table 22: Italy Energy Chewing Gum Revenue (undefined) Forecast, by Application 2020 & 2033
- Table 23: Spain Energy Chewing Gum Revenue (undefined) Forecast, by Application 2020 & 2033
- Table 24: Russia Energy Chewing Gum Revenue (undefined) Forecast, by Application 2020 & 2033
- Table 25: Benelux Energy Chewing Gum Revenue (undefined) Forecast, by Application 2020 & 2033
- Table 26: Nordics Energy Chewing Gum Revenue (undefined) Forecast, by Application 2020 & 2033
- Table 27: Rest of Europe Energy Chewing Gum Revenue (undefined) Forecast, by Application 2020 & 2033
- Table 28: Global Energy Chewing Gum Revenue undefined Forecast, by Application 2020 & 2033
- Table 29: Global Energy Chewing Gum Revenue undefined Forecast, by Type 2020 & 2033
- Table 30: Global Energy Chewing Gum Revenue undefined Forecast, by Country 2020 & 2033
- Table 31: Turkey Energy Chewing Gum Revenue (undefined) Forecast, by Application 2020 & 2033
- Table 32: Israel Energy Chewing Gum Revenue (undefined) Forecast, by Application 2020 & 2033
- Table 33: GCC Energy Chewing Gum Revenue (undefined) Forecast, by Application 2020 & 2033
- Table 34: North Africa Energy Chewing Gum Revenue (undefined) Forecast, by Application 2020 & 2033
- Table 35: South Africa Energy Chewing Gum Revenue (undefined) Forecast, by Application 2020 & 2033
- Table 36: Rest of Middle East & Africa Energy Chewing Gum Revenue (undefined) Forecast, by Application 2020 & 2033
- Table 37: Global Energy Chewing Gum Revenue undefined Forecast, by Application 2020 & 2033
- Table 38: Global Energy Chewing Gum Revenue undefined Forecast, by Type 2020 & 2033
- Table 39: Global Energy Chewing Gum Revenue undefined Forecast, by Country 2020 & 2033
- Table 40: China Energy Chewing Gum Revenue (undefined) Forecast, by Application 2020 & 2033
- Table 41: India Energy Chewing Gum Revenue (undefined) Forecast, by Application 2020 & 2033
- Table 42: Japan Energy Chewing Gum Revenue (undefined) Forecast, by Application 2020 & 2033
- Table 43: South Korea Energy Chewing Gum Revenue (undefined) Forecast, by Application 2020 & 2033
- Table 44: ASEAN Energy Chewing Gum Revenue (undefined) Forecast, by Application 2020 & 2033
- Table 45: Oceania Energy Chewing Gum Revenue (undefined) Forecast, by Application 2020 & 2033
- Table 46: Rest of Asia Pacific Energy Chewing Gum Revenue (undefined) Forecast, by Application 2020 & 2033
Frequently Asked Questions
1. What is the projected Compound Annual Growth Rate (CAGR) of the Energy Chewing Gum?
The projected CAGR is approximately 7.85%.
2. Which companies are prominent players in the Energy Chewing Gum?
Key companies in the market include Mars, Mondelez, Lotte, Perfetti Van Melle, Orion, Cloetta, Hager & Werken (Miradent), GSK (Nicotinell), Military Energy Gum, Xlear, GelStat Corporation (GSAC), ZOFT Gum, Lemon Pharma, Think Gum LLC, Meiji Holdings, Peppersmith, WUG Functional Gums, Khloros (Chewpod), Saludbox Labs, Yake.
3. What are the main segments of the Energy Chewing Gum?
The market segments include Application, Type.
4. Can you provide details about the market size?
The market size is estimated to be USD XXX N/A as of 2022.
5. What are some drivers contributing to market growth?
N/A
6. What are the notable trends driving market growth?
N/A
7. Are there any restraints impacting market growth?
N/A
8. Can you provide examples of recent developments in the market?
N/A
9. What pricing options are available for accessing the report?
Pricing options include single-user, multi-user, and enterprise licenses priced at USD 4250.00, USD 6375.00, and USD 8500.00 respectively.
10. Is the market size provided in terms of value or volume?
The market size is provided in terms of value, measured in N/A.
11. Are there any specific market keywords associated with the report?
Yes, the market keyword associated with the report is "Energy Chewing Gum," which aids in identifying and referencing the specific market segment covered.
12. How do I determine which pricing option suits my needs best?
The pricing options vary based on user requirements and access needs. Individual users may opt for single-user licenses, while businesses requiring broader access may choose multi-user or enterprise licenses for cost-effective access to the report.
13. Are there any additional resources or data provided in the Energy Chewing Gum report?
While the report offers comprehensive insights, it's advisable to review the specific contents or supplementary materials provided to ascertain if additional resources or data are available.
14. How can I stay updated on further developments or reports in the Energy Chewing Gum?
To stay informed about further developments, trends, and reports in the Energy Chewing Gum, consider subscribing to industry newsletters, following relevant companies and organizations, or regularly checking reputable industry news sources and publications.
Methodology
Step 1 - Identification of Relevant Samples Size from Population Database


Step 2 - Approaches for Defining Global Market Size (Value, Volume* & Price*)

Note*: In applicable scenarios
Step 3 - Data Sources
Primary Research
- Web Analytics
- Survey Reports
- Research Institute
- Latest Research Reports
- Opinion Leaders
Secondary Research
- Annual Reports
- White Paper
- Latest Press Release
- Industry Association
- Paid Database
- Investor Presentations

Step 4 - Data Triangulation
Involves using different sources of information in order to increase the validity of a study
These sources are likely to be stakeholders in a program - participants, other researchers, program staff, other community members, and so on.
Then we put all data in single framework & apply various statistical tools to find out the dynamic on the market.
During the analysis stage, feedback from the stakeholder groups would be compared to determine areas of agreement as well as areas of divergence