

Key Insights
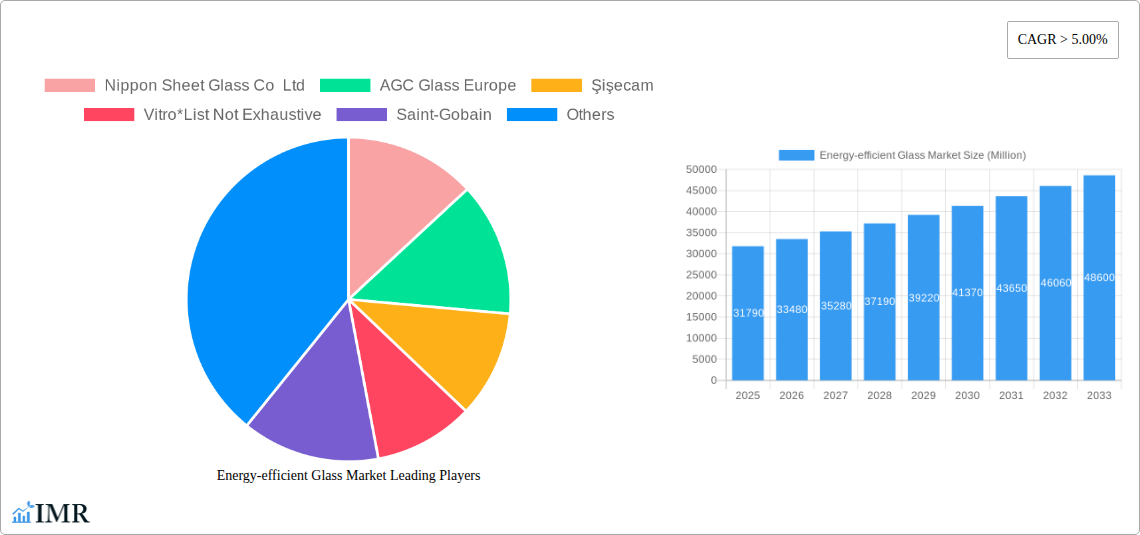
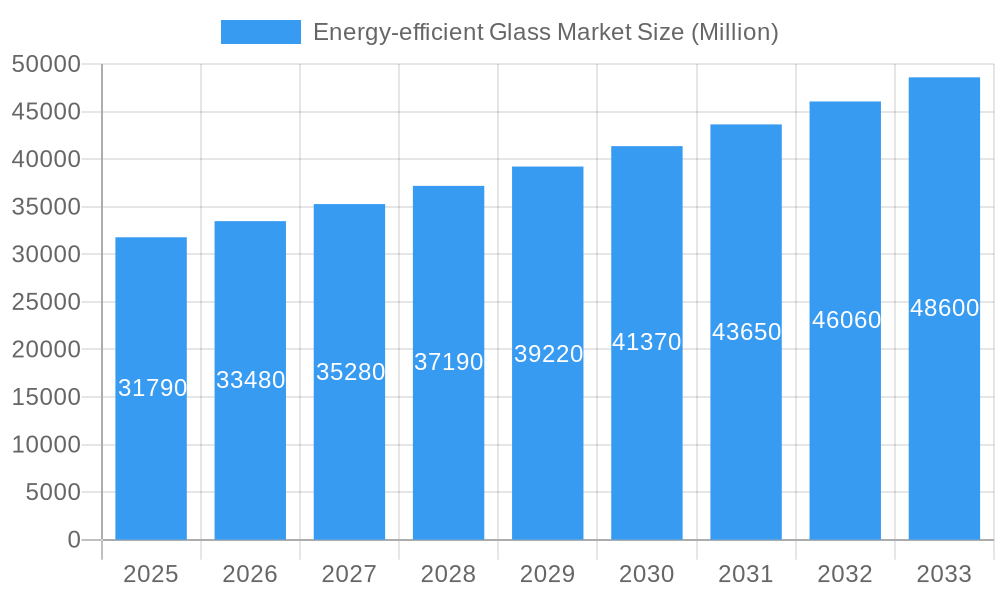
The energy-efficient glass market, valued at $31.79 billion in 2025, is poised for robust growth, exhibiting a compound annual growth rate (CAGR) exceeding 5% from 2025 to 2033. This expansion is driven by several key factors. Firstly, increasing awareness of energy conservation and sustainability is fueling demand for energy-efficient buildings and vehicles. Governments worldwide are implementing stricter building codes and emission regulations, further accelerating market adoption. Technological advancements in glazing technologies, such as the development of more sophisticated coatings (hard and soft) and multi-pane glazing (single, double, and triple), are leading to improved energy performance and enhanced product appeal. The construction industry, a major end-user segment, is witnessing significant growth in both residential and commercial construction, directly impacting energy-efficient glass demand. The automotive and solar panel sectors also contribute significantly, with the automotive industry increasingly incorporating energy-efficient glass for improved fuel efficiency and passenger comfort, and the solar panel industry relying on specialized glass for optimal light transmission and energy conversion. Competition among major players like Nippon Sheet Glass, AGC Glass Europe, and Saint-Gobain, is driving innovation and price competitiveness, benefiting consumers and fostering market growth.
Energy-efficient Glass Market Market Size (In Billion)
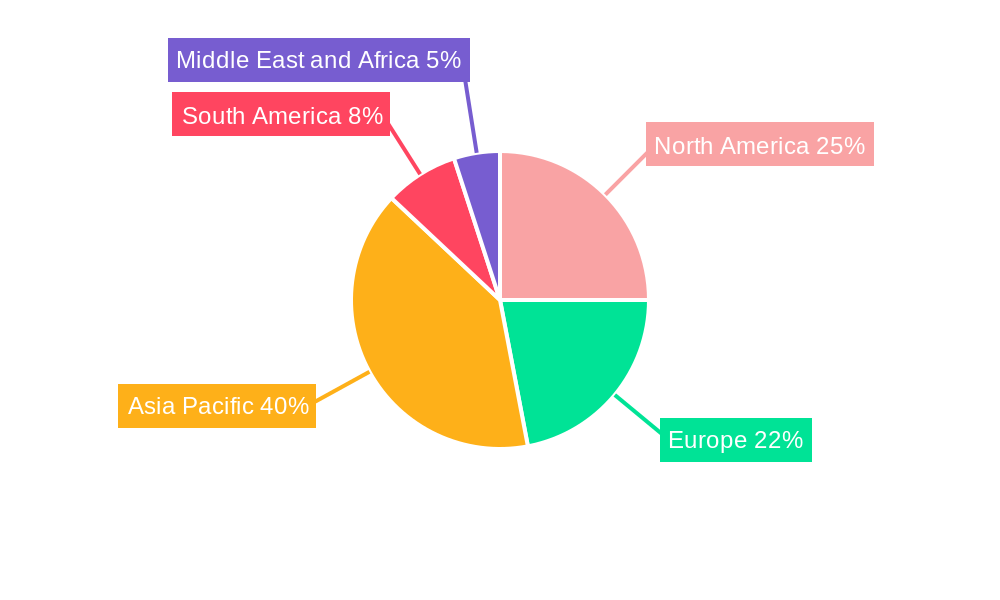
Regional variations in market share are anticipated, with Asia Pacific, particularly China and India, experiencing substantial growth due to rapid urbanization and infrastructure development. North America and Europe, while mature markets, will continue to show steady growth fueled by renovation projects and new construction emphasizing sustainable practices. While the market faces some restraints, such as initial higher costs compared to traditional glass and the need for specialized installation, these are outweighed by the long-term cost savings from reduced energy consumption and the increasing focus on environmental sustainability. The market segmentation, encompassing diverse coating types, glazing options, and end-user industries, allows manufacturers to tailor products to specific needs, further boosting overall market growth and creating diverse opportunities for innovation and expansion throughout the forecast period.
Energy-efficient Glass Market Company Market Share
Energy-Efficient Glass Market Report: 2019-2033
This comprehensive report provides an in-depth analysis of the energy-efficient glass market, encompassing market dynamics, growth trends, regional dominance, product landscape, key players, and future outlook. The study period spans from 2019 to 2033, with 2025 serving as the base and estimated year. This report is crucial for industry professionals, investors, and strategists seeking to navigate this rapidly evolving sector. The market is segmented by coating type (hard, soft), glazing type (single, double, triple), and end-user industry (building and construction, automotive, solar panel, others).
Energy-efficient Glass Market Market Dynamics & Structure
The energy-efficient glass market is characterized by moderate concentration, with key players like Nippon Sheet Glass Co Ltd, AGC Glass Europe, Şişecam, Vitro, Saint-Gobain, and others vying for market share. Technological innovation, particularly in coating technologies and glazing configurations, is a primary driver. Stringent energy efficiency regulations globally are further boosting demand. Competitive substitutes, such as traditional glazing materials, face increasing pressure due to energy cost concerns and environmental regulations. The market exhibits a strong correlation with construction activity and automotive production, rendering it sensitive to macroeconomic fluctuations.
- Market Concentration: Moderately concentrated, with top 5 players holding approximately xx% of the market share in 2024.
- Technological Innovation: Focus on Low-E coatings, self-cleaning glass, and smart glass technologies.
- Regulatory Framework: Stringent building codes and energy efficiency standards drive market growth.
- Competitive Substitutes: Traditional glass faces declining market share due to inferior energy performance.
- M&A Activity: The past five years have witnessed xx M&A deals, primarily focused on expanding production capacity and technological capabilities. A significant portion of these deals focus on securing supply chains. This trend shows a significant consolidation within the market.
- Innovation Barriers: High R&D costs and complexities associated with advanced coating technologies.
Energy-efficient Glass Market Growth Trends & Insights
The energy-efficient glass market experienced robust growth during the historical period (2019-2024), expanding from xx million units in 2019 to xx million units in 2024, registering a CAGR of xx%. This growth is primarily attributed to increasing energy costs, rising environmental awareness, and supportive government policies. The forecast period (2025-2033) projects continued expansion, with a projected CAGR of xx%, reaching xx million units by 2033. The adoption rate of energy-efficient glass is accelerating in both new construction and renovation projects, driven by consumer preference for energy savings and improved comfort. Technological advancements, such as the integration of smart glass technologies and improved coating performance, are further fueling market growth. Consumer behavior is shifting towards energy-efficient and sustainable products, further boosting market demand. The market penetration rate is expected to increase from xx% in 2024 to xx% in 2033.
Dominant Regions, Countries, or Segments in Energy-efficient Glass Market
North America and Europe currently spearhead the global energy-efficient glass market. This leadership is underpinned by a confluence of factors: robust regulatory frameworks mandating higher energy performance in buildings, persistently high energy costs that incentivize efficiency investments, and a substantial, continually evolving building and construction sector. Within these leading regions, countries championing ambitious green building initiatives and offering financial incentives are witnessing particularly accelerated growth. The market is increasingly segmented by product type, with double and triple glazing segments demonstrating significantly higher growth trajectories compared to traditional single glazing, reflecting a clear industry shift towards enhanced thermal insulation.
- Leading Regions: North America and Europe remain the dominant forces, driven by proactive policy and strong market demand.
- Key Market Drivers: Stringent building codes and energy performance standards, escalating energy expenses, heightened public and corporate environmental awareness, and a consistent pipeline of new construction and renovation projects.
- Factors Contributing to Dominance: Well-established infrastructure for manufacturing and distribution, higher disposable incomes enabling investment in premium building materials, and strong government support through subsidies and green building certifications.
- Significant Growth Potential: Emerging economies in Asia Pacific and Latin America are poised for substantial expansion, fueled by rapid urbanization, extensive infrastructure development, and a growing middle class increasingly prioritizing comfort and sustainability. The automotive sector, particularly in rapidly developing markets like China and India, is also presenting exciting opportunities as manufacturers integrate advanced glazing for improved vehicle efficiency and passenger experience.
- Market Share Insights: While North America historically holds a significant market share (estimated at xx%), and Europe also commands a substantial portion (estimated at xx%), the Asia Pacific region is emerging as a dynamic growth engine, steadily increasing its market share and influencing global market trends.
Energy-efficient Glass Market Product Landscape
The energy-efficient glass market offers a diverse range of products, including Low-E coated glass, self-cleaning glass, and smart glass. These products are designed to optimize energy performance, improve thermal comfort, and enhance aesthetic appeal. Key performance metrics include U-value (heat transfer coefficient), solar heat gain coefficient (SHGC), and visible light transmittance (VLT). Unique selling propositions focus on energy savings, improved insulation, reduced carbon footprint, enhanced comfort, and advanced features like self-cleaning functionality and light control.
Key Drivers, Barriers & Challenges in Energy-efficient Glass Market
Key Drivers:
- Rising energy prices are incentivizing energy-efficient solutions.
- Stringent building codes and environmental regulations mandate the use of energy-efficient materials.
- Increasing awareness of climate change fuels demand for sustainable products.
- Technological advancements improve product performance and expand application possibilities.
Key Barriers & Challenges:
- High initial investment costs for energy-efficient glass compared to traditional glass options can be a deterrent for some.
- Supply chain disruptions can impact production and delivery times, leading to price fluctuations.
- The complexity of advanced coating technologies presents challenges for smaller players.
- Competition from established glass manufacturers can create price pressure and limit profitability.
Emerging Opportunities in Energy-Efficient Glass Market
- Growing demand for energy-efficient solutions in developing economies presents significant opportunities.
- Integration of smart glass technologies and Internet of Things (IoT) capabilities expands product applications.
- Development of innovative coating technologies focusing on solar energy harvesting can further enhance product value.
- Customized solutions for specific climate zones and building designs cater to diverse market needs.
Growth Accelerators in the Energy-efficient Glass Market Industry
The energy-efficient glass market is experiencing dynamic growth, propelled by continuous technological advancements in advanced coating materials, such as low-emissivity (low-E) and solar control coatings, as well as innovations in manufacturing processes that enhance insulation and durability. Strategic collaborations and partnerships are becoming increasingly vital, fostering synergy between glass manufacturers, building material suppliers, architectural firms, and technology providers. These alliances not only expand market reach but also accelerate the pace of innovation and the development of integrated solutions. Furthermore, government incentives, tax credits, and supportive policies at national and local levels are playing a crucial role in de-risking investments and encouraging the widespread adoption of energy-efficient glazing solutions. The proactive expansion into new geographic markets, particularly in developing economies that are experiencing rapid urbanization and a growing demand for sustainable infrastructure, represents a significant avenue for sustained growth.
Key Players Shaping the Energy-efficient Glass Market Market
- Nippon Sheet Glass Co Ltd
- AGC Glass Europe
- Şişecam
- Vitro
- Saint-Gobain
- Morley Glass & Glazing Ltd
- Tuffx Glass
- Cardinal Glass Industries Inc
- Abrisa Technologies
- SCHOTT AG
- Guardian Industries Holdings
- Central Glass Co Ltd
Notable Milestones in Energy-efficient Glass Market Sector
- August 2022: NSG Group's strategic expansion of its Total-Coverage Optics (TCO) coated glass production facilities in Malaysia underscores a significant investment aimed at bolstering its presence and capabilities in the burgeoning solar panel and renewable energy markets.
- May 2022: AGC Inc. unveiled its innovative light-control panoramic roof glass technology for the LEXUS RZ, a development that highlights advancements in automotive glazing and its contribution to enhanced passenger comfort and vehicle energy efficiency.
In-Depth Energy-efficient Glass Market Market Outlook
The energy-efficient glass market is projected for robust and sustained growth in the coming years. This optimistic outlook is primarily fueled by the escalating global demand for energy conservation, the tightening of environmental regulations worldwide, and ongoing technological advancements that are yielding more efficient and cost-effective glazing solutions. The increasing emphasis on sustainable building practices, coupled with the growing preference for energy-efficient vehicles, will act as powerful catalysts for market expansion. Strategic alliances and collaborations are expected to play a pivotal role in driving innovation and market penetration. Furthermore, the successful expansion into emerging markets, where the demand for improved building performance and comfort is rapidly increasing, presents significant strategic opportunities. Overall, the energy-efficient glass market demonstrates strong growth potential, offering attractive prospects for investors, manufacturers, and stakeholders looking to capitalize on the global shift towards sustainability and energy efficiency.
Energy-efficient Glass Market Segmentation
-
1. Coating Type
- 1.1. Hard
- 1.2. Soft
-
2. Glazing Type
- 2.1. Single
- 2.2. Double
- 2.3. Triple
-
3. End-user Industry
- 3.1. Building and Construction
- 3.2. Automotive
- 3.3. Solar Panel
- 3.4. Other End-user Industries (Industrial, etc.)
Energy-efficient Glass Market Segmentation By Geography
-
1. Asia Pacific
- 1.1. China
- 1.2. India
- 1.3. Japan
- 1.4. South Korea
- 1.5. Rest of Asia Pacific
-
2. North America
- 2.1. United States
- 2.2. Canada
- 2.3. Mexico
-
3. Europe
- 3.1. Germany
- 3.2. United Kingdom
- 3.3. France
- 3.4. Italy
- 3.5. Rest of Europe
-
4. South America
- 4.1. Brazil
- 4.2. Argentina
- 4.3. Rest of South America
-
5. Middle East and Africa
- 5.1. Saudi Arabia
- 5.2. South Africa
- 5.3. Rest of Middle East and Africa
Energy-efficient Glass Market Regional Market Share
Geographic Coverage of Energy-efficient Glass Market
Energy-efficient Glass Market REPORT HIGHLIGHTS
| Aspects | Details |
|---|---|
| Study Period | 2020-2034 |
| Base Year | 2025 |
| Estimated Year | 2026 |
| Forecast Period | 2026-2034 |
| Historical Period | 2020-2025 |
| Growth Rate | CAGR of > 5.00% from 2020-2034 |
| Segmentation |
|
Table of Contents
- 1. Introduction
- 1.1. Research Scope
- 1.2. Market Segmentation
- 1.3. Research Objective
- 1.4. Definitions and Assumptions
- 2. Executive Summary
- 2.1. Market Snapshot
- 3. Market Dynamics
- 3.1. Market Drivers
- 3.2. Market Restrains
- 3.3. Market Trends
- 3.4. Market Opportunities
- 4. Market Factor Analysis
- 4.1. Porters Five Forces
- 4.1.1. Bargaining Power of Suppliers
- 4.1.2. Bargaining Power of Buyers
- 4.1.3. Threat of New Entrants
- 4.1.4. Threat of Substitutes
- 4.1.5. Competitive Rivalry
- 4.2. PESTEL analysis
- 4.3. BCG Analysis
- 4.3.1. Stars (High Growth, High Market Share)
- 4.3.2. Cash Cows (Low Growth, High Market Share)
- 4.3.3. Question Mark (High Growth, Low Market Share)
- 4.3.4. Dogs (Low Growth, Low Market Share)
- 4.4. Ansoff Matrix Analysis
- 4.5. Supply Chain Analysis
- 4.6. Regulatory Landscape
- 4.7. Current Market Potential and Opportunity Assessment (TAM–SAM–SOM Framework)
- 4.8. IMR Analyst Note
- 4.1. Porters Five Forces
- 5. Market Analysis, Insights and Forecast 2021-2033
- 5.1. Market Analysis, Insights and Forecast - by Coating Type
- 5.1.1. Hard
- 5.1.2. Soft
- 5.2. Market Analysis, Insights and Forecast - by Glazing Type
- 5.2.1. Single
- 5.2.2. Double
- 5.2.3. Triple
- 5.3. Market Analysis, Insights and Forecast - by End-user Industry
- 5.3.1. Building and Construction
- 5.3.2. Automotive
- 5.3.3. Solar Panel
- 5.3.4. Other End-user Industries (Industrial, etc.)
- 5.4. Market Analysis, Insights and Forecast - by Region
- 5.4.1. Asia Pacific
- 5.4.2. North America
- 5.4.3. Europe
- 5.4.4. South America
- 5.4.5. Middle East and Africa
- 5.1. Market Analysis, Insights and Forecast - by Coating Type
- 6. Global Energy-efficient Glass Market Analysis, Insights and Forecast, 2021-2033
- 6.1. Market Analysis, Insights and Forecast - by Coating Type
- 6.1.1. Hard
- 6.1.2. Soft
- 6.2. Market Analysis, Insights and Forecast - by Glazing Type
- 6.2.1. Single
- 6.2.2. Double
- 6.2.3. Triple
- 6.3. Market Analysis, Insights and Forecast - by End-user Industry
- 6.3.1. Building and Construction
- 6.3.2. Automotive
- 6.3.3. Solar Panel
- 6.3.4. Other End-user Industries (Industrial, etc.)
- 6.1. Market Analysis, Insights and Forecast - by Coating Type
- 7. Asia Pacific Energy-efficient Glass Market Analysis, Insights and Forecast, 2020-2032
- 7.1. Market Analysis, Insights and Forecast - by Coating Type
- 7.1.1. Hard
- 7.1.2. Soft
- 7.2. Market Analysis, Insights and Forecast - by Glazing Type
- 7.2.1. Single
- 7.2.2. Double
- 7.2.3. Triple
- 7.3. Market Analysis, Insights and Forecast - by End-user Industry
- 7.3.1. Building and Construction
- 7.3.2. Automotive
- 7.3.3. Solar Panel
- 7.3.4. Other End-user Industries (Industrial, etc.)
- 7.1. Market Analysis, Insights and Forecast - by Coating Type
- 8. North America Energy-efficient Glass Market Analysis, Insights and Forecast, 2020-2032
- 8.1. Market Analysis, Insights and Forecast - by Coating Type
- 8.1.1. Hard
- 8.1.2. Soft
- 8.2. Market Analysis, Insights and Forecast - by Glazing Type
- 8.2.1. Single
- 8.2.2. Double
- 8.2.3. Triple
- 8.3. Market Analysis, Insights and Forecast - by End-user Industry
- 8.3.1. Building and Construction
- 8.3.2. Automotive
- 8.3.3. Solar Panel
- 8.3.4. Other End-user Industries (Industrial, etc.)
- 8.1. Market Analysis, Insights and Forecast - by Coating Type
- 9. Europe Energy-efficient Glass Market Analysis, Insights and Forecast, 2020-2032
- 9.1. Market Analysis, Insights and Forecast - by Coating Type
- 9.1.1. Hard
- 9.1.2. Soft
- 9.2. Market Analysis, Insights and Forecast - by Glazing Type
- 9.2.1. Single
- 9.2.2. Double
- 9.2.3. Triple
- 9.3. Market Analysis, Insights and Forecast - by End-user Industry
- 9.3.1. Building and Construction
- 9.3.2. Automotive
- 9.3.3. Solar Panel
- 9.3.4. Other End-user Industries (Industrial, etc.)
- 9.1. Market Analysis, Insights and Forecast - by Coating Type
- 10. South America Energy-efficient Glass Market Analysis, Insights and Forecast, 2020-2032
- 10.1. Market Analysis, Insights and Forecast - by Coating Type
- 10.1.1. Hard
- 10.1.2. Soft
- 10.2. Market Analysis, Insights and Forecast - by Glazing Type
- 10.2.1. Single
- 10.2.2. Double
- 10.2.3. Triple
- 10.3. Market Analysis, Insights and Forecast - by End-user Industry
- 10.3.1. Building and Construction
- 10.3.2. Automotive
- 10.3.3. Solar Panel
- 10.3.4. Other End-user Industries (Industrial, etc.)
- 10.1. Market Analysis, Insights and Forecast - by Coating Type
- 11. Middle East and Africa Energy-efficient Glass Market Analysis, Insights and Forecast, 2020-2032
- 11.1. Market Analysis, Insights and Forecast - by Coating Type
- 11.1.1. Hard
- 11.1.2. Soft
- 11.2. Market Analysis, Insights and Forecast - by Glazing Type
- 11.2.1. Single
- 11.2.2. Double
- 11.2.3. Triple
- 11.3. Market Analysis, Insights and Forecast - by End-user Industry
- 11.3.1. Building and Construction
- 11.3.2. Automotive
- 11.3.3. Solar Panel
- 11.3.4. Other End-user Industries (Industrial, etc.)
- 11.1. Market Analysis, Insights and Forecast - by Coating Type
- 12. Competitive Analysis
- 12.1. Company Profiles
- 12.1.1 Nippon Sheet Glass Co Ltd
- 12.1.1.1. Company Overview
- 12.1.1.2. Products
- 12.1.1.3. Company Financials
- 12.1.1.4. SWOT Analysis
- 12.1.2 AGC Glass Europe
- 12.1.2.1. Company Overview
- 12.1.2.2. Products
- 12.1.2.3. Company Financials
- 12.1.2.4. SWOT Analysis
- 12.1.3 Şişecam
- 12.1.3.1. Company Overview
- 12.1.3.2. Products
- 12.1.3.3. Company Financials
- 12.1.3.4. SWOT Analysis
- 12.1.4 Vitro*List Not Exhaustive
- 12.1.4.1. Company Overview
- 12.1.4.2. Products
- 12.1.4.3. Company Financials
- 12.1.4.4. SWOT Analysis
- 12.1.5 Saint-Gobain
- 12.1.5.1. Company Overview
- 12.1.5.2. Products
- 12.1.5.3. Company Financials
- 12.1.5.4. SWOT Analysis
- 12.1.6 Morley Glass & Glazing Ltd
- 12.1.6.1. Company Overview
- 12.1.6.2. Products
- 12.1.6.3. Company Financials
- 12.1.6.4. SWOT Analysis
- 12.1.7 Tuffx Glass
- 12.1.7.1. Company Overview
- 12.1.7.2. Products
- 12.1.7.3. Company Financials
- 12.1.7.4. SWOT Analysis
- 12.1.8 Cardinal Glass Industries Inc
- 12.1.8.1. Company Overview
- 12.1.8.2. Products
- 12.1.8.3. Company Financials
- 12.1.8.4. SWOT Analysis
- 12.1.9 Abrisa Technologies
- 12.1.9.1. Company Overview
- 12.1.9.2. Products
- 12.1.9.3. Company Financials
- 12.1.9.4. SWOT Analysis
- 12.1.10 SCHOTT AG
- 12.1.10.1. Company Overview
- 12.1.10.2. Products
- 12.1.10.3. Company Financials
- 12.1.10.4. SWOT Analysis
- 12.1.11 Guardian Industries Holdings
- 12.1.11.1. Company Overview
- 12.1.11.2. Products
- 12.1.11.3. Company Financials
- 12.1.11.4. SWOT Analysis
- 12.1.12 Central Glass Co Ltd
- 12.1.12.1. Company Overview
- 12.1.12.2. Products
- 12.1.12.3. Company Financials
- 12.1.12.4. SWOT Analysis
- 12.1.1 Nippon Sheet Glass Co Ltd
- 12.2. Market Entropy
- 12.2.1 Company's Key Areas Served
- 12.2.2 Recent Developments
- 12.3. Company Market Share Analysis 2025
- 12.3.1 Top 5 Companies Market Share Analysis
- 12.3.2 Top 3 Companies Market Share Analysis
- 12.4. List of Potential Customers
- 13. Research Methodology
List of Figures
- Figure 1: Global Energy-efficient Glass Market Revenue Breakdown (Million, %) by Region 2025 & 2033
- Figure 2: Global Energy-efficient Glass Market Volume Breakdown (Kiloton, %) by Region 2025 & 2033
- Figure 3: Asia Pacific Energy-efficient Glass Market Revenue (Million), by Coating Type 2025 & 2033
- Figure 4: Asia Pacific Energy-efficient Glass Market Volume (Kiloton), by Coating Type 2025 & 2033
- Figure 5: Asia Pacific Energy-efficient Glass Market Revenue Share (%), by Coating Type 2025 & 2033
- Figure 6: Asia Pacific Energy-efficient Glass Market Volume Share (%), by Coating Type 2025 & 2033
- Figure 7: Asia Pacific Energy-efficient Glass Market Revenue (Million), by Glazing Type 2025 & 2033
- Figure 8: Asia Pacific Energy-efficient Glass Market Volume (Kiloton), by Glazing Type 2025 & 2033
- Figure 9: Asia Pacific Energy-efficient Glass Market Revenue Share (%), by Glazing Type 2025 & 2033
- Figure 10: Asia Pacific Energy-efficient Glass Market Volume Share (%), by Glazing Type 2025 & 2033
- Figure 11: Asia Pacific Energy-efficient Glass Market Revenue (Million), by End-user Industry 2025 & 2033
- Figure 12: Asia Pacific Energy-efficient Glass Market Volume (Kiloton), by End-user Industry 2025 & 2033
- Figure 13: Asia Pacific Energy-efficient Glass Market Revenue Share (%), by End-user Industry 2025 & 2033
- Figure 14: Asia Pacific Energy-efficient Glass Market Volume Share (%), by End-user Industry 2025 & 2033
- Figure 15: Asia Pacific Energy-efficient Glass Market Revenue (Million), by Country 2025 & 2033
- Figure 16: Asia Pacific Energy-efficient Glass Market Volume (Kiloton), by Country 2025 & 2033
- Figure 17: Asia Pacific Energy-efficient Glass Market Revenue Share (%), by Country 2025 & 2033
- Figure 18: Asia Pacific Energy-efficient Glass Market Volume Share (%), by Country 2025 & 2033
- Figure 19: North America Energy-efficient Glass Market Revenue (Million), by Coating Type 2025 & 2033
- Figure 20: North America Energy-efficient Glass Market Volume (Kiloton), by Coating Type 2025 & 2033
- Figure 21: North America Energy-efficient Glass Market Revenue Share (%), by Coating Type 2025 & 2033
- Figure 22: North America Energy-efficient Glass Market Volume Share (%), by Coating Type 2025 & 2033
- Figure 23: North America Energy-efficient Glass Market Revenue (Million), by Glazing Type 2025 & 2033
- Figure 24: North America Energy-efficient Glass Market Volume (Kiloton), by Glazing Type 2025 & 2033
- Figure 25: North America Energy-efficient Glass Market Revenue Share (%), by Glazing Type 2025 & 2033
- Figure 26: North America Energy-efficient Glass Market Volume Share (%), by Glazing Type 2025 & 2033
- Figure 27: North America Energy-efficient Glass Market Revenue (Million), by End-user Industry 2025 & 2033
- Figure 28: North America Energy-efficient Glass Market Volume (Kiloton), by End-user Industry 2025 & 2033
- Figure 29: North America Energy-efficient Glass Market Revenue Share (%), by End-user Industry 2025 & 2033
- Figure 30: North America Energy-efficient Glass Market Volume Share (%), by End-user Industry 2025 & 2033
- Figure 31: North America Energy-efficient Glass Market Revenue (Million), by Country 2025 & 2033
- Figure 32: North America Energy-efficient Glass Market Volume (Kiloton), by Country 2025 & 2033
- Figure 33: North America Energy-efficient Glass Market Revenue Share (%), by Country 2025 & 2033
- Figure 34: North America Energy-efficient Glass Market Volume Share (%), by Country 2025 & 2033
- Figure 35: Europe Energy-efficient Glass Market Revenue (Million), by Coating Type 2025 & 2033
- Figure 36: Europe Energy-efficient Glass Market Volume (Kiloton), by Coating Type 2025 & 2033
- Figure 37: Europe Energy-efficient Glass Market Revenue Share (%), by Coating Type 2025 & 2033
- Figure 38: Europe Energy-efficient Glass Market Volume Share (%), by Coating Type 2025 & 2033
- Figure 39: Europe Energy-efficient Glass Market Revenue (Million), by Glazing Type 2025 & 2033
- Figure 40: Europe Energy-efficient Glass Market Volume (Kiloton), by Glazing Type 2025 & 2033
- Figure 41: Europe Energy-efficient Glass Market Revenue Share (%), by Glazing Type 2025 & 2033
- Figure 42: Europe Energy-efficient Glass Market Volume Share (%), by Glazing Type 2025 & 2033
- Figure 43: Europe Energy-efficient Glass Market Revenue (Million), by End-user Industry 2025 & 2033
- Figure 44: Europe Energy-efficient Glass Market Volume (Kiloton), by End-user Industry 2025 & 2033
- Figure 45: Europe Energy-efficient Glass Market Revenue Share (%), by End-user Industry 2025 & 2033
- Figure 46: Europe Energy-efficient Glass Market Volume Share (%), by End-user Industry 2025 & 2033
- Figure 47: Europe Energy-efficient Glass Market Revenue (Million), by Country 2025 & 2033
- Figure 48: Europe Energy-efficient Glass Market Volume (Kiloton), by Country 2025 & 2033
- Figure 49: Europe Energy-efficient Glass Market Revenue Share (%), by Country 2025 & 2033
- Figure 50: Europe Energy-efficient Glass Market Volume Share (%), by Country 2025 & 2033
- Figure 51: South America Energy-efficient Glass Market Revenue (Million), by Coating Type 2025 & 2033
- Figure 52: South America Energy-efficient Glass Market Volume (Kiloton), by Coating Type 2025 & 2033
- Figure 53: South America Energy-efficient Glass Market Revenue Share (%), by Coating Type 2025 & 2033
- Figure 54: South America Energy-efficient Glass Market Volume Share (%), by Coating Type 2025 & 2033
- Figure 55: South America Energy-efficient Glass Market Revenue (Million), by Glazing Type 2025 & 2033
- Figure 56: South America Energy-efficient Glass Market Volume (Kiloton), by Glazing Type 2025 & 2033
- Figure 57: South America Energy-efficient Glass Market Revenue Share (%), by Glazing Type 2025 & 2033
- Figure 58: South America Energy-efficient Glass Market Volume Share (%), by Glazing Type 2025 & 2033
- Figure 59: South America Energy-efficient Glass Market Revenue (Million), by End-user Industry 2025 & 2033
- Figure 60: South America Energy-efficient Glass Market Volume (Kiloton), by End-user Industry 2025 & 2033
- Figure 61: South America Energy-efficient Glass Market Revenue Share (%), by End-user Industry 2025 & 2033
- Figure 62: South America Energy-efficient Glass Market Volume Share (%), by End-user Industry 2025 & 2033
- Figure 63: South America Energy-efficient Glass Market Revenue (Million), by Country 2025 & 2033
- Figure 64: South America Energy-efficient Glass Market Volume (Kiloton), by Country 2025 & 2033
- Figure 65: South America Energy-efficient Glass Market Revenue Share (%), by Country 2025 & 2033
- Figure 66: South America Energy-efficient Glass Market Volume Share (%), by Country 2025 & 2033
- Figure 67: Middle East and Africa Energy-efficient Glass Market Revenue (Million), by Coating Type 2025 & 2033
- Figure 68: Middle East and Africa Energy-efficient Glass Market Volume (Kiloton), by Coating Type 2025 & 2033
- Figure 69: Middle East and Africa Energy-efficient Glass Market Revenue Share (%), by Coating Type 2025 & 2033
- Figure 70: Middle East and Africa Energy-efficient Glass Market Volume Share (%), by Coating Type 2025 & 2033
- Figure 71: Middle East and Africa Energy-efficient Glass Market Revenue (Million), by Glazing Type 2025 & 2033
- Figure 72: Middle East and Africa Energy-efficient Glass Market Volume (Kiloton), by Glazing Type 2025 & 2033
- Figure 73: Middle East and Africa Energy-efficient Glass Market Revenue Share (%), by Glazing Type 2025 & 2033
- Figure 74: Middle East and Africa Energy-efficient Glass Market Volume Share (%), by Glazing Type 2025 & 2033
- Figure 75: Middle East and Africa Energy-efficient Glass Market Revenue (Million), by End-user Industry 2025 & 2033
- Figure 76: Middle East and Africa Energy-efficient Glass Market Volume (Kiloton), by End-user Industry 2025 & 2033
- Figure 77: Middle East and Africa Energy-efficient Glass Market Revenue Share (%), by End-user Industry 2025 & 2033
- Figure 78: Middle East and Africa Energy-efficient Glass Market Volume Share (%), by End-user Industry 2025 & 2033
- Figure 79: Middle East and Africa Energy-efficient Glass Market Revenue (Million), by Country 2025 & 2033
- Figure 80: Middle East and Africa Energy-efficient Glass Market Volume (Kiloton), by Country 2025 & 2033
- Figure 81: Middle East and Africa Energy-efficient Glass Market Revenue Share (%), by Country 2025 & 2033
- Figure 82: Middle East and Africa Energy-efficient Glass Market Volume Share (%), by Country 2025 & 2033
List of Tables
- Table 1: Global Energy-efficient Glass Market Revenue Million Forecast, by Coating Type 2020 & 2033
- Table 2: Global Energy-efficient Glass Market Volume Kiloton Forecast, by Coating Type 2020 & 2033
- Table 3: Global Energy-efficient Glass Market Revenue Million Forecast, by Glazing Type 2020 & 2033
- Table 4: Global Energy-efficient Glass Market Volume Kiloton Forecast, by Glazing Type 2020 & 2033
- Table 5: Global Energy-efficient Glass Market Revenue Million Forecast, by End-user Industry 2020 & 2033
- Table 6: Global Energy-efficient Glass Market Volume Kiloton Forecast, by End-user Industry 2020 & 2033
- Table 7: Global Energy-efficient Glass Market Revenue Million Forecast, by Region 2020 & 2033
- Table 8: Global Energy-efficient Glass Market Volume Kiloton Forecast, by Region 2020 & 2033
- Table 9: Global Energy-efficient Glass Market Revenue Million Forecast, by Coating Type 2020 & 2033
- Table 10: Global Energy-efficient Glass Market Volume Kiloton Forecast, by Coating Type 2020 & 2033
- Table 11: Global Energy-efficient Glass Market Revenue Million Forecast, by Glazing Type 2020 & 2033
- Table 12: Global Energy-efficient Glass Market Volume Kiloton Forecast, by Glazing Type 2020 & 2033
- Table 13: Global Energy-efficient Glass Market Revenue Million Forecast, by End-user Industry 2020 & 2033
- Table 14: Global Energy-efficient Glass Market Volume Kiloton Forecast, by End-user Industry 2020 & 2033
- Table 15: Global Energy-efficient Glass Market Revenue Million Forecast, by Country 2020 & 2033
- Table 16: Global Energy-efficient Glass Market Volume Kiloton Forecast, by Country 2020 & 2033
- Table 17: China Energy-efficient Glass Market Revenue (Million) Forecast, by Application 2020 & 2033
- Table 18: China Energy-efficient Glass Market Volume (Kiloton) Forecast, by Application 2020 & 2033
- Table 19: India Energy-efficient Glass Market Revenue (Million) Forecast, by Application 2020 & 2033
- Table 20: India Energy-efficient Glass Market Volume (Kiloton) Forecast, by Application 2020 & 2033
- Table 21: Japan Energy-efficient Glass Market Revenue (Million) Forecast, by Application 2020 & 2033
- Table 22: Japan Energy-efficient Glass Market Volume (Kiloton) Forecast, by Application 2020 & 2033
- Table 23: South Korea Energy-efficient Glass Market Revenue (Million) Forecast, by Application 2020 & 2033
- Table 24: South Korea Energy-efficient Glass Market Volume (Kiloton) Forecast, by Application 2020 & 2033
- Table 25: Rest of Asia Pacific Energy-efficient Glass Market Revenue (Million) Forecast, by Application 2020 & 2033
- Table 26: Rest of Asia Pacific Energy-efficient Glass Market Volume (Kiloton) Forecast, by Application 2020 & 2033
- Table 27: Global Energy-efficient Glass Market Revenue Million Forecast, by Coating Type 2020 & 2033
- Table 28: Global Energy-efficient Glass Market Volume Kiloton Forecast, by Coating Type 2020 & 2033
- Table 29: Global Energy-efficient Glass Market Revenue Million Forecast, by Glazing Type 2020 & 2033
- Table 30: Global Energy-efficient Glass Market Volume Kiloton Forecast, by Glazing Type 2020 & 2033
- Table 31: Global Energy-efficient Glass Market Revenue Million Forecast, by End-user Industry 2020 & 2033
- Table 32: Global Energy-efficient Glass Market Volume Kiloton Forecast, by End-user Industry 2020 & 2033
- Table 33: Global Energy-efficient Glass Market Revenue Million Forecast, by Country 2020 & 2033
- Table 34: Global Energy-efficient Glass Market Volume Kiloton Forecast, by Country 2020 & 2033
- Table 35: United States Energy-efficient Glass Market Revenue (Million) Forecast, by Application 2020 & 2033
- Table 36: United States Energy-efficient Glass Market Volume (Kiloton) Forecast, by Application 2020 & 2033
- Table 37: Canada Energy-efficient Glass Market Revenue (Million) Forecast, by Application 2020 & 2033
- Table 38: Canada Energy-efficient Glass Market Volume (Kiloton) Forecast, by Application 2020 & 2033
- Table 39: Mexico Energy-efficient Glass Market Revenue (Million) Forecast, by Application 2020 & 2033
- Table 40: Mexico Energy-efficient Glass Market Volume (Kiloton) Forecast, by Application 2020 & 2033
- Table 41: Global Energy-efficient Glass Market Revenue Million Forecast, by Coating Type 2020 & 2033
- Table 42: Global Energy-efficient Glass Market Volume Kiloton Forecast, by Coating Type 2020 & 2033
- Table 43: Global Energy-efficient Glass Market Revenue Million Forecast, by Glazing Type 2020 & 2033
- Table 44: Global Energy-efficient Glass Market Volume Kiloton Forecast, by Glazing Type 2020 & 2033
- Table 45: Global Energy-efficient Glass Market Revenue Million Forecast, by End-user Industry 2020 & 2033
- Table 46: Global Energy-efficient Glass Market Volume Kiloton Forecast, by End-user Industry 2020 & 2033
- Table 47: Global Energy-efficient Glass Market Revenue Million Forecast, by Country 2020 & 2033
- Table 48: Global Energy-efficient Glass Market Volume Kiloton Forecast, by Country 2020 & 2033
- Table 49: Germany Energy-efficient Glass Market Revenue (Million) Forecast, by Application 2020 & 2033
- Table 50: Germany Energy-efficient Glass Market Volume (Kiloton) Forecast, by Application 2020 & 2033
- Table 51: United Kingdom Energy-efficient Glass Market Revenue (Million) Forecast, by Application 2020 & 2033
- Table 52: United Kingdom Energy-efficient Glass Market Volume (Kiloton) Forecast, by Application 2020 & 2033
- Table 53: France Energy-efficient Glass Market Revenue (Million) Forecast, by Application 2020 & 2033
- Table 54: France Energy-efficient Glass Market Volume (Kiloton) Forecast, by Application 2020 & 2033
- Table 55: Italy Energy-efficient Glass Market Revenue (Million) Forecast, by Application 2020 & 2033
- Table 56: Italy Energy-efficient Glass Market Volume (Kiloton) Forecast, by Application 2020 & 2033
- Table 57: Rest of Europe Energy-efficient Glass Market Revenue (Million) Forecast, by Application 2020 & 2033
- Table 58: Rest of Europe Energy-efficient Glass Market Volume (Kiloton) Forecast, by Application 2020 & 2033
- Table 59: Global Energy-efficient Glass Market Revenue Million Forecast, by Coating Type 2020 & 2033
- Table 60: Global Energy-efficient Glass Market Volume Kiloton Forecast, by Coating Type 2020 & 2033
- Table 61: Global Energy-efficient Glass Market Revenue Million Forecast, by Glazing Type 2020 & 2033
- Table 62: Global Energy-efficient Glass Market Volume Kiloton Forecast, by Glazing Type 2020 & 2033
- Table 63: Global Energy-efficient Glass Market Revenue Million Forecast, by End-user Industry 2020 & 2033
- Table 64: Global Energy-efficient Glass Market Volume Kiloton Forecast, by End-user Industry 2020 & 2033
- Table 65: Global Energy-efficient Glass Market Revenue Million Forecast, by Country 2020 & 2033
- Table 66: Global Energy-efficient Glass Market Volume Kiloton Forecast, by Country 2020 & 2033
- Table 67: Brazil Energy-efficient Glass Market Revenue (Million) Forecast, by Application 2020 & 2033
- Table 68: Brazil Energy-efficient Glass Market Volume (Kiloton) Forecast, by Application 2020 & 2033
- Table 69: Argentina Energy-efficient Glass Market Revenue (Million) Forecast, by Application 2020 & 2033
- Table 70: Argentina Energy-efficient Glass Market Volume (Kiloton) Forecast, by Application 2020 & 2033
- Table 71: Rest of South America Energy-efficient Glass Market Revenue (Million) Forecast, by Application 2020 & 2033
- Table 72: Rest of South America Energy-efficient Glass Market Volume (Kiloton) Forecast, by Application 2020 & 2033
- Table 73: Global Energy-efficient Glass Market Revenue Million Forecast, by Coating Type 2020 & 2033
- Table 74: Global Energy-efficient Glass Market Volume Kiloton Forecast, by Coating Type 2020 & 2033
- Table 75: Global Energy-efficient Glass Market Revenue Million Forecast, by Glazing Type 2020 & 2033
- Table 76: Global Energy-efficient Glass Market Volume Kiloton Forecast, by Glazing Type 2020 & 2033
- Table 77: Global Energy-efficient Glass Market Revenue Million Forecast, by End-user Industry 2020 & 2033
- Table 78: Global Energy-efficient Glass Market Volume Kiloton Forecast, by End-user Industry 2020 & 2033
- Table 79: Global Energy-efficient Glass Market Revenue Million Forecast, by Country 2020 & 2033
- Table 80: Global Energy-efficient Glass Market Volume Kiloton Forecast, by Country 2020 & 2033
- Table 81: Saudi Arabia Energy-efficient Glass Market Revenue (Million) Forecast, by Application 2020 & 2033
- Table 82: Saudi Arabia Energy-efficient Glass Market Volume (Kiloton) Forecast, by Application 2020 & 2033
- Table 83: South Africa Energy-efficient Glass Market Revenue (Million) Forecast, by Application 2020 & 2033
- Table 84: South Africa Energy-efficient Glass Market Volume (Kiloton) Forecast, by Application 2020 & 2033
- Table 85: Rest of Middle East and Africa Energy-efficient Glass Market Revenue (Million) Forecast, by Application 2020 & 2033
- Table 86: Rest of Middle East and Africa Energy-efficient Glass Market Volume (Kiloton) Forecast, by Application 2020 & 2033
Frequently Asked Questions
1. What is the projected Compound Annual Growth Rate (CAGR) of the Energy-efficient Glass Market?
The projected CAGR is approximately > 5.00%.
2. Which companies are prominent players in the Energy-efficient Glass Market?
Key companies in the market include Nippon Sheet Glass Co Ltd, AGC Glass Europe, Şişecam, Vitro*List Not Exhaustive, Saint-Gobain, Morley Glass & Glazing Ltd, Tuffx Glass, Cardinal Glass Industries Inc, Abrisa Technologies, SCHOTT AG, Guardian Industries Holdings, Central Glass Co Ltd.
3. What are the main segments of the Energy-efficient Glass Market?
The market segments include Coating Type, Glazing Type, End-user Industry.
4. Can you provide details about the market size?
The market size is estimated to be USD 31.79 Million as of 2022.
5. What are some drivers contributing to market growth?
Increasing Application in the Building and Construction Sector; Growing Concern about High Carbon Emissions; Other Drivers.
6. What are the notable trends driving market growth?
Growing Demand from the Building and Construction Sector.
7. Are there any restraints impacting market growth?
High Price Bar of Energy-efficient Glass; Other Restraints.
8. Can you provide examples of recent developments in the market?
August 2022: NSG Group unveiled its expansion plan for TCO (transparent conductive oxide) coated glass production in Malaysia. The initiative involves the installation of a new float line at the Johor Bahru facility of Malaysian Sheet Glass SDN BHD, a member of the NSG Group. This expansion will incorporate online coating capacity and is set to commence TCO glass production for solar panel manufacturers by the close of 2024.
9. What pricing options are available for accessing the report?
Pricing options include single-user, multi-user, and enterprise licenses priced at USD 4750, USD 5250, and USD 8750 respectively.
10. Is the market size provided in terms of value or volume?
The market size is provided in terms of value, measured in Million and volume, measured in Kiloton.
11. Are there any specific market keywords associated with the report?
Yes, the market keyword associated with the report is "Energy-efficient Glass Market," which aids in identifying and referencing the specific market segment covered.
12. How do I determine which pricing option suits my needs best?
The pricing options vary based on user requirements and access needs. Individual users may opt for single-user licenses, while businesses requiring broader access may choose multi-user or enterprise licenses for cost-effective access to the report.
13. Are there any additional resources or data provided in the Energy-efficient Glass Market report?
While the report offers comprehensive insights, it's advisable to review the specific contents or supplementary materials provided to ascertain if additional resources or data are available.
14. How can I stay updated on further developments or reports in the Energy-efficient Glass Market?
To stay informed about further developments, trends, and reports in the Energy-efficient Glass Market, consider subscribing to industry newsletters, following relevant companies and organizations, or regularly checking reputable industry news sources and publications.
Methodology
Step 1 - Identification of Relevant Samples Size from Population Database


Step 2 - Approaches for Defining Global Market Size (Value, Volume* & Price*)

Note*: In applicable scenarios
Step 3 - Data Sources
Primary Research
- Web Analytics
- Survey Reports
- Research Institute
- Latest Research Reports
- Opinion Leaders
Secondary Research
- Annual Reports
- White Paper
- Latest Press Release
- Industry Association
- Paid Database
- Investor Presentations

Step 4 - Data Triangulation
Involves using different sources of information in order to increase the validity of a study
These sources are likely to be stakeholders in a program - participants, other researchers, program staff, other community members, and so on.
Then we put all data in single framework & apply various statistical tools to find out the dynamic on the market.
During the analysis stage, feedback from the stakeholder groups would be compared to determine areas of agreement as well as areas of divergence