

Key Insights
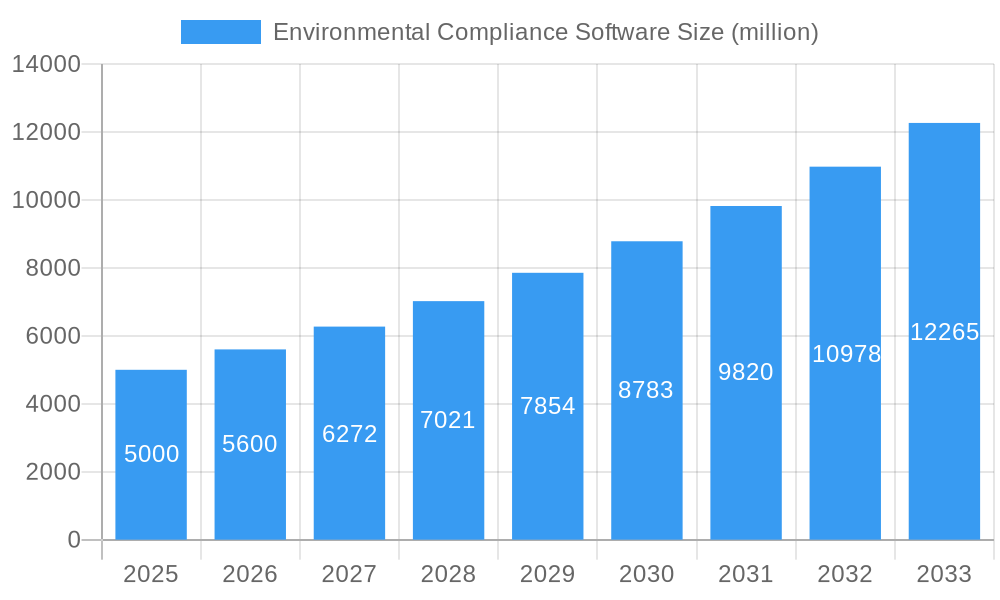
The Environmental Compliance Software market is experiencing robust growth, driven by increasing regulatory scrutiny, stringent environmental protection laws, and the rising need for efficient compliance management across various industries. The market's expansion is fueled by several key factors, including the growing adoption of cloud-based solutions offering enhanced scalability, accessibility, and cost-effectiveness. Furthermore, the integration of advanced technologies like AI and machine learning into these platforms is improving data analysis and predictive capabilities, enabling businesses to proactively address potential compliance issues. This proactive approach minimizes risks, reduces penalties, and enhances overall operational efficiency. The market is segmented by deployment (cloud, on-premise), industry (manufacturing, energy, chemicals), and geography, each presenting unique growth opportunities. We estimate the market size to be approximately $5 billion in 2025, with a Compound Annual Growth Rate (CAGR) of 12% projected through 2033. This growth is anticipated across all segments, driven by continuous technological advancements and a growing awareness among organizations of the long-term benefits of robust environmental compliance programs.
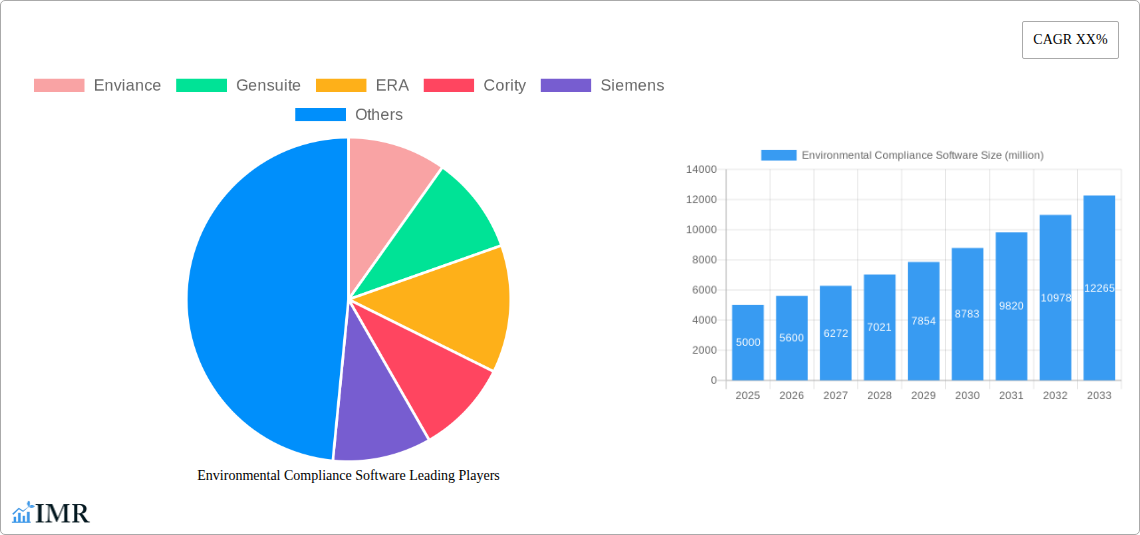
Environmental Compliance Software Market Size (In Billion)
Major players such as Enviance, Gensuite, ERA, Cority, Siemens, SAP, Dakota, Intelex, VelocityEHS, and Ecesis are actively shaping the market landscape through product innovation and strategic partnerships. However, the market also faces certain restraints, primarily the high initial investment costs associated with implementing and integrating sophisticated software solutions, as well as the complexity in managing data from diverse sources. Despite these challenges, the long-term benefits of improved compliance, reduced risks, and enhanced operational efficiency outweigh the initial investment, ensuring continued market expansion. The increasing adoption of sustainability initiatives by corporations across the globe further accelerates market growth, solidifying the Environmental Compliance Software sector as a crucial component of modern business operations. The focus on reducing environmental footprint and enhancing corporate social responsibility is further contributing to the market's positive trajectory.
Environmental Compliance Software Company Market Share
Environmental Compliance Software Market Report: 2019-2033
This comprehensive report provides an in-depth analysis of the Environmental Compliance Software market, projecting significant growth from $xx million in 2025 to $xx million by 2033, exhibiting a CAGR of xx% during the forecast period (2025-2033). The report covers the historical period (2019-2024), with 2025 serving as the base year and the estimated year. This detailed study targets industry professionals, investors, and regulatory bodies seeking a clear understanding of this rapidly evolving market. Key players analyzed include Enviance, Gensuite, ERA, Cority, Siemens, SAP, Dakota, Intelex, VelocityEHS, and Ecesis, across various segments within the broader Environmental Management Software (EMS) market.
Environmental Compliance Software Market Dynamics & Structure
The Environmental Compliance Software market is characterized by moderate concentration, with a few dominant players holding significant market share, while numerous smaller niche players also exist. The market is driven by stringent environmental regulations globally, increasing awareness of environmental sustainability, and technological advancements enabling more efficient compliance management. Mergers and acquisitions (M&A) activity remains prevalent, with larger players seeking to expand their market reach and product portfolios. Innovation is fueled by the demand for integrated solutions, advanced analytics, and AI-powered features to streamline compliance processes. However, the high cost of implementation and integration, data security concerns, and the need for continuous updates pose challenges.
- Market Concentration: Moderately concentrated, with the top 5 players holding approximately xx% of the market share in 2025.
- Technological Drivers: AI-powered analytics, cloud-based solutions, IoT integration for real-time monitoring.
- Regulatory Frameworks: Stringent environmental regulations (e.g., EPA in the US, REACH in Europe) drive demand.
- Competitive Substitutes: Manual compliance processes, basic database management systems.
- End-User Demographics: Primarily large enterprises across manufacturing, energy, and chemical sectors, with growing adoption among SMEs.
- M&A Trends: xx M&A deals recorded between 2019 and 2024, indicating a consolidation trend.
Environmental Compliance Software Growth Trends & Insights
The Environmental Compliance Software market has witnessed robust growth over the past five years, driven by increasing regulatory scrutiny, rising environmental consciousness, and technological advancements. The market size expanded from $xx million in 2019 to $xx million in 2024, demonstrating strong adoption rates across various industries. Technological disruptions, such as the shift towards cloud-based solutions and the integration of AI and machine learning, are further accelerating market growth. Consumer behavior is shifting towards solutions that offer seamless integration, real-time data analysis, and improved reporting capabilities. This trend is expected to continue, fostering further market expansion in the coming years.
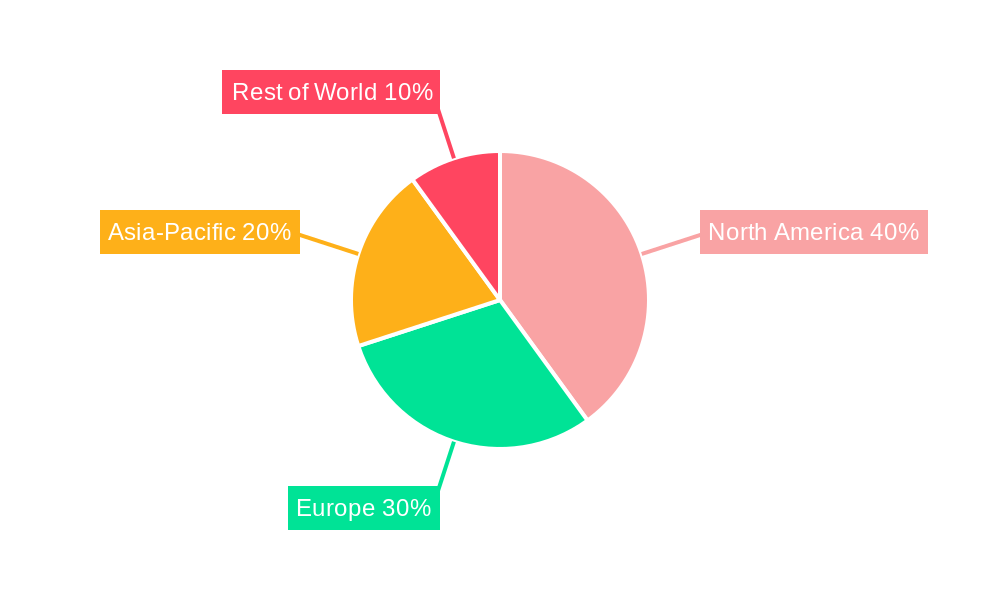
Dominant Regions, Countries, or Segments in Environmental Compliance Software
North America currently dominates the Environmental Compliance Software market, driven by stringent environmental regulations, a high concentration of large enterprises, and significant technological advancements. Europe is also a key market, with robust regulations and a growing focus on sustainable practices. The Asia-Pacific region exhibits substantial growth potential due to rapid industrialization and increasing environmental awareness, although the market is still relatively less mature compared to North America and Europe.
- Key Drivers (North America): Stringent environmental regulations, high adoption rates in manufacturing and energy sectors, strong technological innovation.
- Key Drivers (Europe): Robust regulatory framework (e.g., REACH), focus on sustainability, growing adoption among SMEs.
- Key Drivers (Asia-Pacific): Rapid industrialization, increasing environmental awareness, government initiatives promoting sustainable development.
Environmental Compliance Software Product Landscape
The Environmental Compliance Software market offers a diverse range of solutions, from standalone modules to fully integrated platforms. Products are characterized by features such as automated reporting, data analytics, risk assessment tools, and compliance tracking capabilities. Recent innovations include AI-powered predictive analytics for proactive compliance management and blockchain technology for secure data management. Key selling propositions include ease of use, improved efficiency, reduced compliance costs, and enhanced data security.
Key Drivers, Barriers & Challenges in Environmental Compliance Software
Key Drivers: Increasingly stringent environmental regulations, growing awareness of environmental, social, and governance (ESG) factors, technological advancements (AI, cloud computing), and the need for improved operational efficiency.
Challenges: High initial investment costs, complex integration with existing systems, data security concerns, and the ongoing need for software updates and maintenance to comply with evolving regulations. The competitive landscape also presents challenges, with established players and new entrants vying for market share. Supply chain disruptions can also impact the availability of software and support services.
Emerging Opportunities in Environmental Compliance Software
Emerging opportunities lie in the development of integrated solutions that incorporate ESG data management and reporting, expanding into underserved markets (e.g., small and medium-sized enterprises), and leveraging advancements in AI and machine learning for predictive compliance and risk management. The growth of the circular economy will also create new opportunities for software solutions that track and manage waste and recycling processes.
Growth Accelerators in the Environmental Compliance Software Industry
Strategic partnerships between software providers and environmental consulting firms can accelerate market growth by providing bundled solutions and expertise to clients. Technological breakthroughs, such as the increased adoption of cloud-based solutions and the integration of IoT devices, are also driving market expansion. Moreover, the expansion of market reach into emerging economies presents a significant growth opportunity for companies in this sector.
Notable Milestones in Environmental Compliance Software Sector
- 2020: Enviance launches a new AI-powered compliance module.
- 2021: Gensuite acquires a smaller competitor, expanding its market reach.
- 2022: Significant investments in R&D across the industry leading to improved functionalities.
- 2023: Increased adoption of cloud-based solutions due to cost and scalability advantages.
- 2024: New regulations in multiple regions drive higher demand for environmental compliance software.
In-Depth Environmental Compliance Software Market Outlook
The Environmental Compliance Software market is poised for sustained growth, driven by a confluence of factors including stricter regulations, increased environmental awareness, and ongoing technological innovation. The market will witness higher adoption among SMEs and expansion into emerging economies. Strategic partnerships and investments in R&D will further fuel growth, creating significant opportunities for existing players and new entrants alike. The focus will shift towards integrated, AI-powered solutions that offer greater efficiency, improved data security, and proactive risk management capabilities.
Environmental Compliance Software Segmentation
-
1. Application
- 1.1. Small and Medium Enterprises (SMEs)
- 1.2. Large Enterprises
-
2. Types
- 2.1. Cloud-based
- 2.2. On-premises
Environmental Compliance Software Segmentation By Geography
-
1. North America
- 1.1. United States
- 1.2. Canada
- 1.3. Mexico
-
2. South America
- 2.1. Brazil
- 2.2. Argentina
- 2.3. Rest of South America
-
3. Europe
- 3.1. United Kingdom
- 3.2. Germany
- 3.3. France
- 3.4. Italy
- 3.5. Spain
- 3.6. Russia
- 3.7. Benelux
- 3.8. Nordics
- 3.9. Rest of Europe
-
4. Middle East & Africa
- 4.1. Turkey
- 4.2. Israel
- 4.3. GCC
- 4.4. North Africa
- 4.5. South Africa
- 4.6. Rest of Middle East & Africa
-
5. Asia Pacific
- 5.1. China
- 5.2. India
- 5.3. Japan
- 5.4. South Korea
- 5.5. ASEAN
- 5.6. Oceania
- 5.7. Rest of Asia Pacific
Environmental Compliance Software Regional Market Share
Geographic Coverage of Environmental Compliance Software
Environmental Compliance Software REPORT HIGHLIGHTS
| Aspects | Details |
|---|---|
| Study Period | 2020-2034 |
| Base Year | 2025 |
| Estimated Year | 2026 |
| Forecast Period | 2026-2034 |
| Historical Period | 2020-2025 |
| Growth Rate | CAGR of 20.1% from 2020-2034 |
| Segmentation |
|
Table of Contents
- 1. Introduction
- 1.1. Research Scope
- 1.2. Market Segmentation
- 1.3. Research Objective
- 1.4. Definitions and Assumptions
- 2. Executive Summary
- 2.1. Market Snapshot
- 3. Market Dynamics
- 3.1. Market Drivers
- 3.2. Market Restrains
- 3.3. Market Trends
- 3.4. Market Opportunities
- 4. Market Factor Analysis
- 4.1. Porters Five Forces
- 4.1.1. Bargaining Power of Suppliers
- 4.1.2. Bargaining Power of Buyers
- 4.1.3. Threat of New Entrants
- 4.1.4. Threat of Substitutes
- 4.1.5. Competitive Rivalry
- 4.2. PESTEL analysis
- 4.3. BCG Analysis
- 4.3.1. Stars (High Growth, High Market Share)
- 4.3.2. Cash Cows (Low Growth, High Market Share)
- 4.3.3. Question Mark (High Growth, Low Market Share)
- 4.3.4. Dogs (Low Growth, Low Market Share)
- 4.4. Ansoff Matrix Analysis
- 4.5. Supply Chain Analysis
- 4.6. Regulatory Landscape
- 4.7. Current Market Potential and Opportunity Assessment (TAM–SAM–SOM Framework)
- 4.8. IMR Analyst Note
- 4.1. Porters Five Forces
- 5. Market Analysis, Insights and Forecast 2021-2033
- 5.1. Market Analysis, Insights and Forecast - by Application
- 5.1.1. Small and Medium Enterprises (SMEs)
- 5.1.2. Large Enterprises
- 5.2. Market Analysis, Insights and Forecast - by Types
- 5.2.1. Cloud-based
- 5.2.2. On-premises
- 5.3. Market Analysis, Insights and Forecast - by Region
- 5.3.1. North America
- 5.3.2. South America
- 5.3.3. Europe
- 5.3.4. Middle East & Africa
- 5.3.5. Asia Pacific
- 5.1. Market Analysis, Insights and Forecast - by Application
- 6. Global Environmental Compliance Software Analysis, Insights and Forecast, 2021-2033
- 6.1. Market Analysis, Insights and Forecast - by Application
- 6.1.1. Small and Medium Enterprises (SMEs)
- 6.1.2. Large Enterprises
- 6.2. Market Analysis, Insights and Forecast - by Types
- 6.2.1. Cloud-based
- 6.2.2. On-premises
- 6.1. Market Analysis, Insights and Forecast - by Application
- 7. North America Environmental Compliance Software Analysis, Insights and Forecast, 2020-2032
- 7.1. Market Analysis, Insights and Forecast - by Application
- 7.1.1. Small and Medium Enterprises (SMEs)
- 7.1.2. Large Enterprises
- 7.2. Market Analysis, Insights and Forecast - by Types
- 7.2.1. Cloud-based
- 7.2.2. On-premises
- 7.1. Market Analysis, Insights and Forecast - by Application
- 8. South America Environmental Compliance Software Analysis, Insights and Forecast, 2020-2032
- 8.1. Market Analysis, Insights and Forecast - by Application
- 8.1.1. Small and Medium Enterprises (SMEs)
- 8.1.2. Large Enterprises
- 8.2. Market Analysis, Insights and Forecast - by Types
- 8.2.1. Cloud-based
- 8.2.2. On-premises
- 8.1. Market Analysis, Insights and Forecast - by Application
- 9. Europe Environmental Compliance Software Analysis, Insights and Forecast, 2020-2032
- 9.1. Market Analysis, Insights and Forecast - by Application
- 9.1.1. Small and Medium Enterprises (SMEs)
- 9.1.2. Large Enterprises
- 9.2. Market Analysis, Insights and Forecast - by Types
- 9.2.1. Cloud-based
- 9.2.2. On-premises
- 9.1. Market Analysis, Insights and Forecast - by Application
- 10. Middle East & Africa Environmental Compliance Software Analysis, Insights and Forecast, 2020-2032
- 10.1. Market Analysis, Insights and Forecast - by Application
- 10.1.1. Small and Medium Enterprises (SMEs)
- 10.1.2. Large Enterprises
- 10.2. Market Analysis, Insights and Forecast - by Types
- 10.2.1. Cloud-based
- 10.2.2. On-premises
- 10.1. Market Analysis, Insights and Forecast - by Application
- 11. Asia Pacific Environmental Compliance Software Analysis, Insights and Forecast, 2020-2032
- 11.1. Market Analysis, Insights and Forecast - by Application
- 11.1.1. Small and Medium Enterprises (SMEs)
- 11.1.2. Large Enterprises
- 11.2. Market Analysis, Insights and Forecast - by Types
- 11.2.1. Cloud-based
- 11.2.2. On-premises
- 11.1. Market Analysis, Insights and Forecast - by Application
- 12. Competitive Analysis
- 12.1. Company Profiles
- 12.1.1 Enviance
- 12.1.1.1. Company Overview
- 12.1.1.2. Products
- 12.1.1.3. Company Financials
- 12.1.1.4. SWOT Analysis
- 12.1.2 Gensuite
- 12.1.2.1. Company Overview
- 12.1.2.2. Products
- 12.1.2.3. Company Financials
- 12.1.2.4. SWOT Analysis
- 12.1.3 ERA
- 12.1.3.1. Company Overview
- 12.1.3.2. Products
- 12.1.3.3. Company Financials
- 12.1.3.4. SWOT Analysis
- 12.1.4 Cority
- 12.1.4.1. Company Overview
- 12.1.4.2. Products
- 12.1.4.3. Company Financials
- 12.1.4.4. SWOT Analysis
- 12.1.5 Siemens
- 12.1.5.1. Company Overview
- 12.1.5.2. Products
- 12.1.5.3. Company Financials
- 12.1.5.4. SWOT Analysis
- 12.1.6 SAP
- 12.1.6.1. Company Overview
- 12.1.6.2. Products
- 12.1.6.3. Company Financials
- 12.1.6.4. SWOT Analysis
- 12.1.7 Dakota
- 12.1.7.1. Company Overview
- 12.1.7.2. Products
- 12.1.7.3. Company Financials
- 12.1.7.4. SWOT Analysis
- 12.1.8 Intelex
- 12.1.8.1. Company Overview
- 12.1.8.2. Products
- 12.1.8.3. Company Financials
- 12.1.8.4. SWOT Analysis
- 12.1.9 VelocityEHS
- 12.1.9.1. Company Overview
- 12.1.9.2. Products
- 12.1.9.3. Company Financials
- 12.1.9.4. SWOT Analysis
- 12.1.10 Ecesis
- 12.1.10.1. Company Overview
- 12.1.10.2. Products
- 12.1.10.3. Company Financials
- 12.1.10.4. SWOT Analysis
- 12.1.1 Enviance
- 12.2. Market Entropy
- 12.2.1 Company's Key Areas Served
- 12.2.2 Recent Developments
- 12.3. Company Market Share Analysis 2025
- 12.3.1 Top 5 Companies Market Share Analysis
- 12.3.2 Top 3 Companies Market Share Analysis
- 12.4. List of Potential Customers
- 13. Research Methodology
List of Figures
- Figure 1: Global Environmental Compliance Software Revenue Breakdown (undefined, %) by Region 2025 & 2033
- Figure 2: North America Environmental Compliance Software Revenue (undefined), by Application 2025 & 2033
- Figure 3: North America Environmental Compliance Software Revenue Share (%), by Application 2025 & 2033
- Figure 4: North America Environmental Compliance Software Revenue (undefined), by Types 2025 & 2033
- Figure 5: North America Environmental Compliance Software Revenue Share (%), by Types 2025 & 2033
- Figure 6: North America Environmental Compliance Software Revenue (undefined), by Country 2025 & 2033
- Figure 7: North America Environmental Compliance Software Revenue Share (%), by Country 2025 & 2033
- Figure 8: South America Environmental Compliance Software Revenue (undefined), by Application 2025 & 2033
- Figure 9: South America Environmental Compliance Software Revenue Share (%), by Application 2025 & 2033
- Figure 10: South America Environmental Compliance Software Revenue (undefined), by Types 2025 & 2033
- Figure 11: South America Environmental Compliance Software Revenue Share (%), by Types 2025 & 2033
- Figure 12: South America Environmental Compliance Software Revenue (undefined), by Country 2025 & 2033
- Figure 13: South America Environmental Compliance Software Revenue Share (%), by Country 2025 & 2033
- Figure 14: Europe Environmental Compliance Software Revenue (undefined), by Application 2025 & 2033
- Figure 15: Europe Environmental Compliance Software Revenue Share (%), by Application 2025 & 2033
- Figure 16: Europe Environmental Compliance Software Revenue (undefined), by Types 2025 & 2033
- Figure 17: Europe Environmental Compliance Software Revenue Share (%), by Types 2025 & 2033
- Figure 18: Europe Environmental Compliance Software Revenue (undefined), by Country 2025 & 2033
- Figure 19: Europe Environmental Compliance Software Revenue Share (%), by Country 2025 & 2033
- Figure 20: Middle East & Africa Environmental Compliance Software Revenue (undefined), by Application 2025 & 2033
- Figure 21: Middle East & Africa Environmental Compliance Software Revenue Share (%), by Application 2025 & 2033
- Figure 22: Middle East & Africa Environmental Compliance Software Revenue (undefined), by Types 2025 & 2033
- Figure 23: Middle East & Africa Environmental Compliance Software Revenue Share (%), by Types 2025 & 2033
- Figure 24: Middle East & Africa Environmental Compliance Software Revenue (undefined), by Country 2025 & 2033
- Figure 25: Middle East & Africa Environmental Compliance Software Revenue Share (%), by Country 2025 & 2033
- Figure 26: Asia Pacific Environmental Compliance Software Revenue (undefined), by Application 2025 & 2033
- Figure 27: Asia Pacific Environmental Compliance Software Revenue Share (%), by Application 2025 & 2033
- Figure 28: Asia Pacific Environmental Compliance Software Revenue (undefined), by Types 2025 & 2033
- Figure 29: Asia Pacific Environmental Compliance Software Revenue Share (%), by Types 2025 & 2033
- Figure 30: Asia Pacific Environmental Compliance Software Revenue (undefined), by Country 2025 & 2033
- Figure 31: Asia Pacific Environmental Compliance Software Revenue Share (%), by Country 2025 & 2033
List of Tables
- Table 1: Global Environmental Compliance Software Revenue undefined Forecast, by Application 2020 & 2033
- Table 2: Global Environmental Compliance Software Revenue undefined Forecast, by Types 2020 & 2033
- Table 3: Global Environmental Compliance Software Revenue undefined Forecast, by Region 2020 & 2033
- Table 4: Global Environmental Compliance Software Revenue undefined Forecast, by Application 2020 & 2033
- Table 5: Global Environmental Compliance Software Revenue undefined Forecast, by Types 2020 & 2033
- Table 6: Global Environmental Compliance Software Revenue undefined Forecast, by Country 2020 & 2033
- Table 7: United States Environmental Compliance Software Revenue (undefined) Forecast, by Application 2020 & 2033
- Table 8: Canada Environmental Compliance Software Revenue (undefined) Forecast, by Application 2020 & 2033
- Table 9: Mexico Environmental Compliance Software Revenue (undefined) Forecast, by Application 2020 & 2033
- Table 10: Global Environmental Compliance Software Revenue undefined Forecast, by Application 2020 & 2033
- Table 11: Global Environmental Compliance Software Revenue undefined Forecast, by Types 2020 & 2033
- Table 12: Global Environmental Compliance Software Revenue undefined Forecast, by Country 2020 & 2033
- Table 13: Brazil Environmental Compliance Software Revenue (undefined) Forecast, by Application 2020 & 2033
- Table 14: Argentina Environmental Compliance Software Revenue (undefined) Forecast, by Application 2020 & 2033
- Table 15: Rest of South America Environmental Compliance Software Revenue (undefined) Forecast, by Application 2020 & 2033
- Table 16: Global Environmental Compliance Software Revenue undefined Forecast, by Application 2020 & 2033
- Table 17: Global Environmental Compliance Software Revenue undefined Forecast, by Types 2020 & 2033
- Table 18: Global Environmental Compliance Software Revenue undefined Forecast, by Country 2020 & 2033
- Table 19: United Kingdom Environmental Compliance Software Revenue (undefined) Forecast, by Application 2020 & 2033
- Table 20: Germany Environmental Compliance Software Revenue (undefined) Forecast, by Application 2020 & 2033
- Table 21: France Environmental Compliance Software Revenue (undefined) Forecast, by Application 2020 & 2033
- Table 22: Italy Environmental Compliance Software Revenue (undefined) Forecast, by Application 2020 & 2033
- Table 23: Spain Environmental Compliance Software Revenue (undefined) Forecast, by Application 2020 & 2033
- Table 24: Russia Environmental Compliance Software Revenue (undefined) Forecast, by Application 2020 & 2033
- Table 25: Benelux Environmental Compliance Software Revenue (undefined) Forecast, by Application 2020 & 2033
- Table 26: Nordics Environmental Compliance Software Revenue (undefined) Forecast, by Application 2020 & 2033
- Table 27: Rest of Europe Environmental Compliance Software Revenue (undefined) Forecast, by Application 2020 & 2033
- Table 28: Global Environmental Compliance Software Revenue undefined Forecast, by Application 2020 & 2033
- Table 29: Global Environmental Compliance Software Revenue undefined Forecast, by Types 2020 & 2033
- Table 30: Global Environmental Compliance Software Revenue undefined Forecast, by Country 2020 & 2033
- Table 31: Turkey Environmental Compliance Software Revenue (undefined) Forecast, by Application 2020 & 2033
- Table 32: Israel Environmental Compliance Software Revenue (undefined) Forecast, by Application 2020 & 2033
- Table 33: GCC Environmental Compliance Software Revenue (undefined) Forecast, by Application 2020 & 2033
- Table 34: North Africa Environmental Compliance Software Revenue (undefined) Forecast, by Application 2020 & 2033
- Table 35: South Africa Environmental Compliance Software Revenue (undefined) Forecast, by Application 2020 & 2033
- Table 36: Rest of Middle East & Africa Environmental Compliance Software Revenue (undefined) Forecast, by Application 2020 & 2033
- Table 37: Global Environmental Compliance Software Revenue undefined Forecast, by Application 2020 & 2033
- Table 38: Global Environmental Compliance Software Revenue undefined Forecast, by Types 2020 & 2033
- Table 39: Global Environmental Compliance Software Revenue undefined Forecast, by Country 2020 & 2033
- Table 40: China Environmental Compliance Software Revenue (undefined) Forecast, by Application 2020 & 2033
- Table 41: India Environmental Compliance Software Revenue (undefined) Forecast, by Application 2020 & 2033
- Table 42: Japan Environmental Compliance Software Revenue (undefined) Forecast, by Application 2020 & 2033
- Table 43: South Korea Environmental Compliance Software Revenue (undefined) Forecast, by Application 2020 & 2033
- Table 44: ASEAN Environmental Compliance Software Revenue (undefined) Forecast, by Application 2020 & 2033
- Table 45: Oceania Environmental Compliance Software Revenue (undefined) Forecast, by Application 2020 & 2033
- Table 46: Rest of Asia Pacific Environmental Compliance Software Revenue (undefined) Forecast, by Application 2020 & 2033
Frequently Asked Questions
1. What is the projected Compound Annual Growth Rate (CAGR) of the Environmental Compliance Software?
The projected CAGR is approximately 20.1%.
2. Which companies are prominent players in the Environmental Compliance Software?
Key companies in the market include Enviance, Gensuite, ERA, Cority, Siemens, SAP, Dakota, Intelex, VelocityEHS, Ecesis.
3. What are the main segments of the Environmental Compliance Software?
The market segments include Application, Types.
4. Can you provide details about the market size?
The market size is estimated to be USD XXX N/A as of 2022.
5. What are some drivers contributing to market growth?
N/A
6. What are the notable trends driving market growth?
N/A
7. Are there any restraints impacting market growth?
N/A
8. Can you provide examples of recent developments in the market?
N/A
9. What pricing options are available for accessing the report?
Pricing options include single-user, multi-user, and enterprise licenses priced at USD 2900.00, USD 4350.00, and USD 5800.00 respectively.
10. Is the market size provided in terms of value or volume?
The market size is provided in terms of value, measured in N/A.
11. Are there any specific market keywords associated with the report?
Yes, the market keyword associated with the report is "Environmental Compliance Software," which aids in identifying and referencing the specific market segment covered.
12. How do I determine which pricing option suits my needs best?
The pricing options vary based on user requirements and access needs. Individual users may opt for single-user licenses, while businesses requiring broader access may choose multi-user or enterprise licenses for cost-effective access to the report.
13. Are there any additional resources or data provided in the Environmental Compliance Software report?
While the report offers comprehensive insights, it's advisable to review the specific contents or supplementary materials provided to ascertain if additional resources or data are available.
14. How can I stay updated on further developments or reports in the Environmental Compliance Software?
To stay informed about further developments, trends, and reports in the Environmental Compliance Software, consider subscribing to industry newsletters, following relevant companies and organizations, or regularly checking reputable industry news sources and publications.
Methodology
Step 1 - Identification of Relevant Samples Size from Population Database


Step 2 - Approaches for Defining Global Market Size (Value, Volume* & Price*)

Note*: In applicable scenarios
Step 3 - Data Sources
Primary Research
- Web Analytics
- Survey Reports
- Research Institute
- Latest Research Reports
- Opinion Leaders
Secondary Research
- Annual Reports
- White Paper
- Latest Press Release
- Industry Association
- Paid Database
- Investor Presentations

Step 4 - Data Triangulation
Involves using different sources of information in order to increase the validity of a study
These sources are likely to be stakeholders in a program - participants, other researchers, program staff, other community members, and so on.
Then we put all data in single framework & apply various statistical tools to find out the dynamic on the market.
During the analysis stage, feedback from the stakeholder groups would be compared to determine areas of agreement as well as areas of divergence