

Key Insights
The global freight consolidation service market is poised for significant expansion, projected to reach approximately $174.6 billion by 2024, demonstrating a robust Compound Annual Growth Rate (CAGR) of 5% over the forecast period. This growth is primarily fueled by the increasing demand for efficient and cost-effective supply chain solutions across various industries. Key drivers include the burgeoning e-commerce sector, which necessitates optimized shipping for smaller, frequent orders, and the growing complexity of global trade routes requiring streamlined logistics. Companies are increasingly leveraging freight consolidation to reduce transportation costs, minimize transit times, and improve overall supply chain visibility. The market is also witnessing a surge in the adoption of advanced technologies, such as real-time tracking and data analytics, to enhance operational efficiency and customer satisfaction. This technological integration is crucial in navigating the evolving landscape of international trade and addressing the demand for faster, more reliable delivery services.
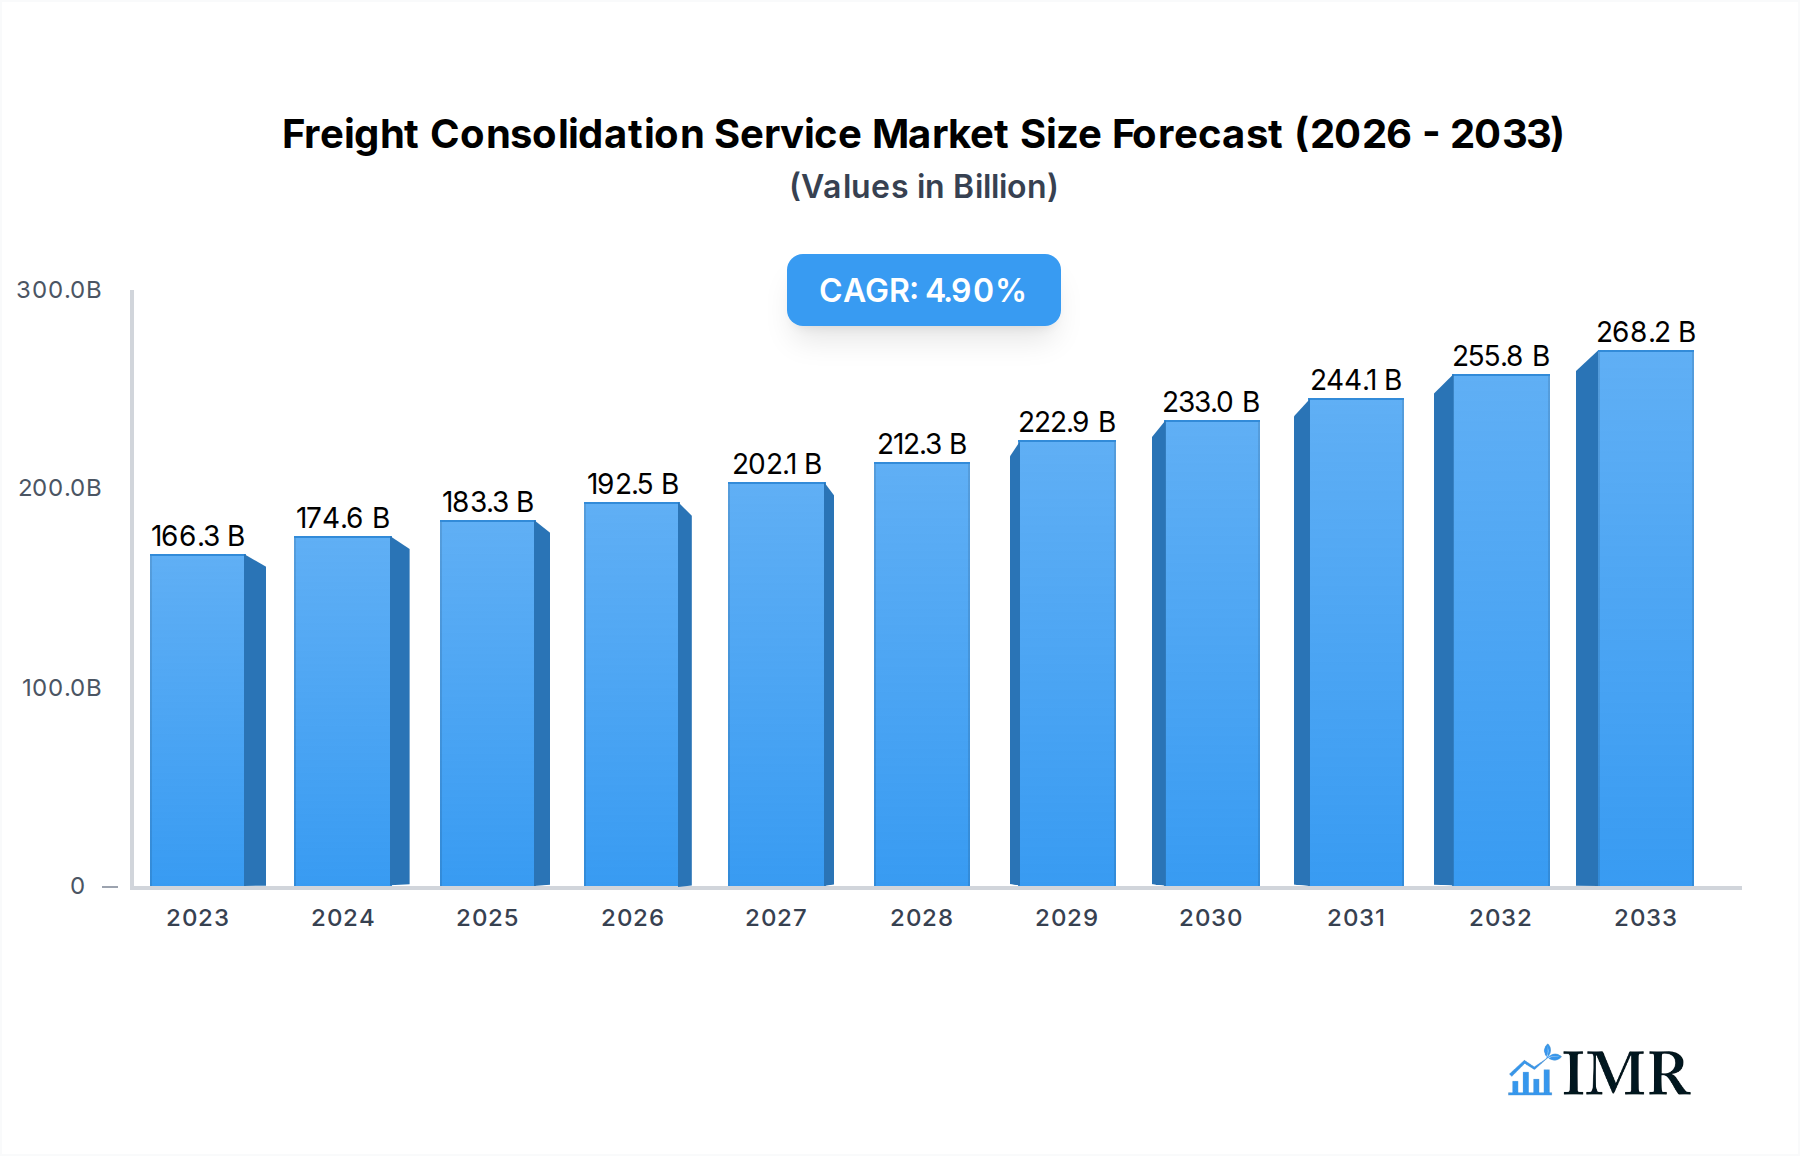
Freight Consolidation Service Market Size (In Billion)
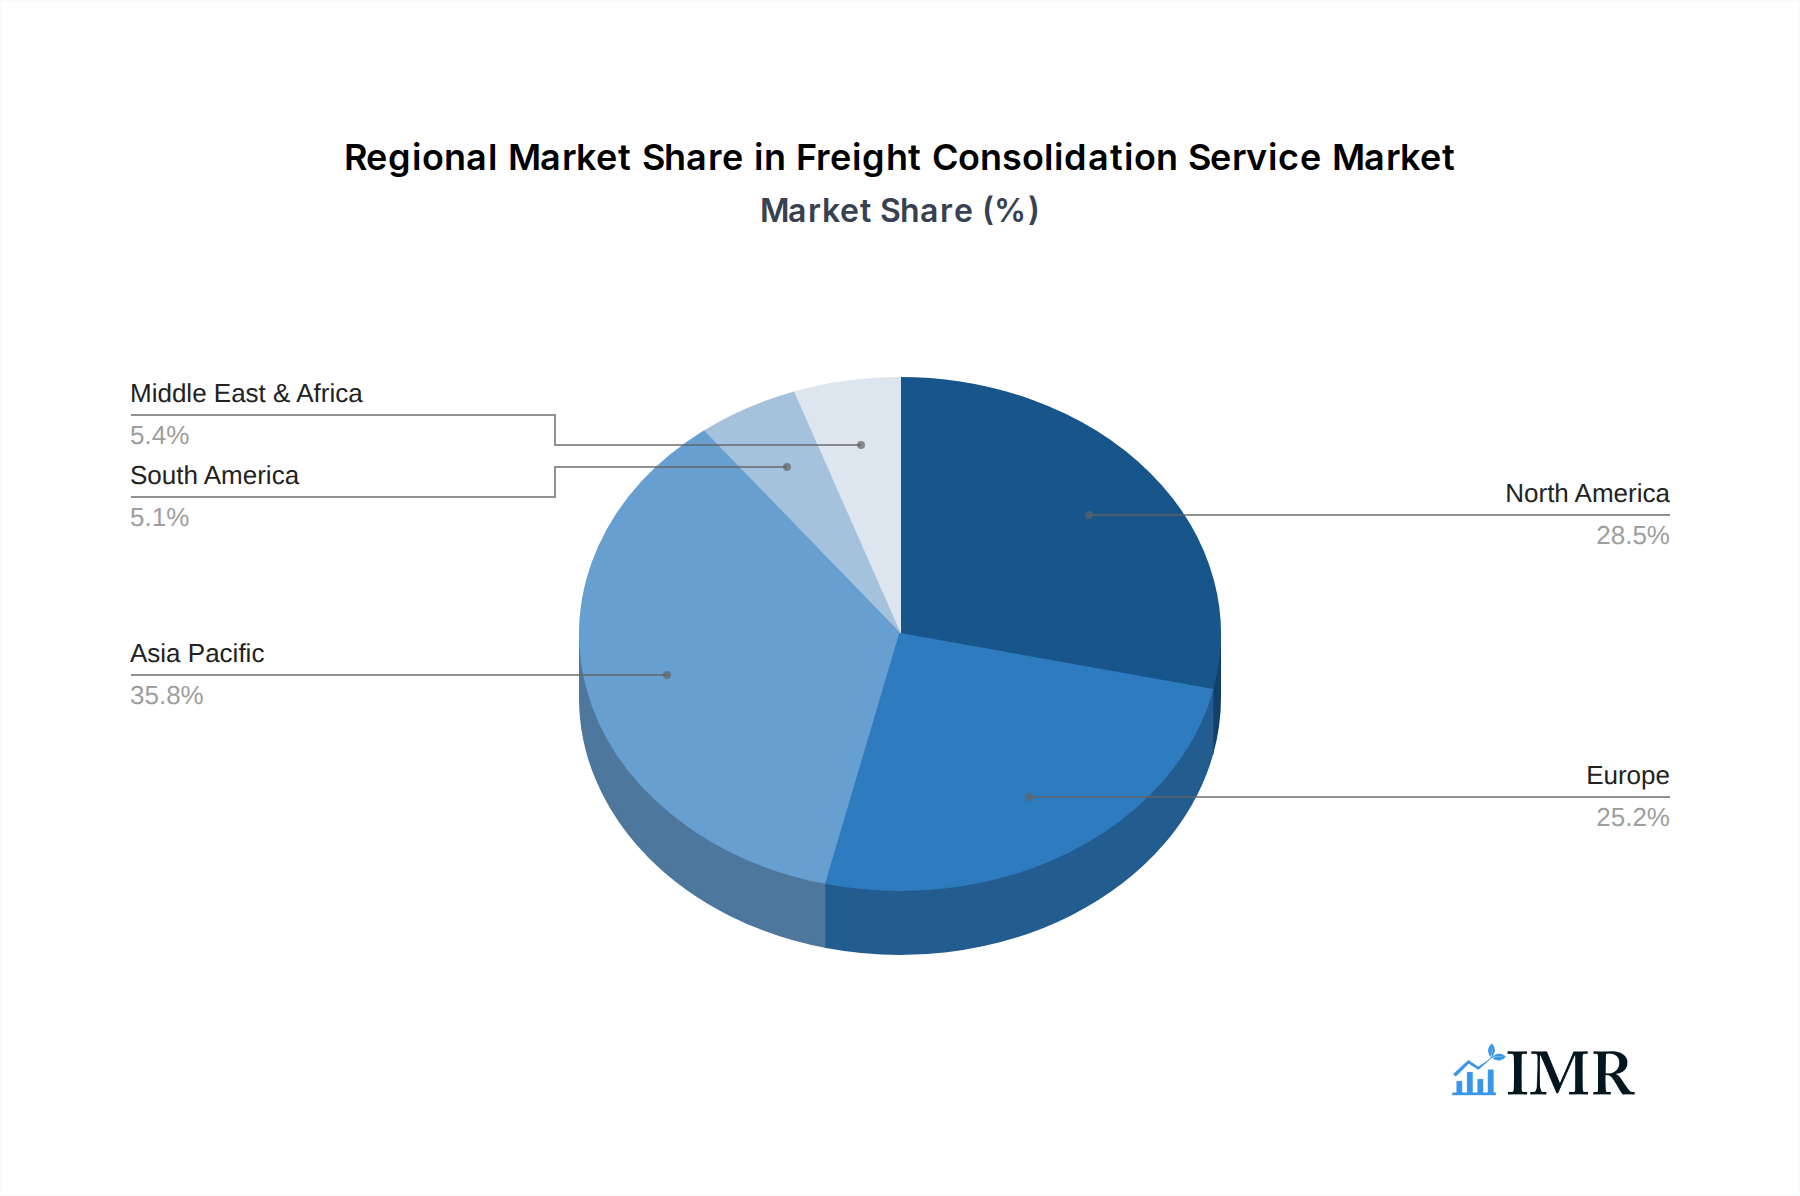
The freight consolidation market is characterized by a diverse range of applications and types, catering to varying shipping needs. Road freight consolidation remains a dominant segment due to its flexibility and widespread reach, particularly for domestic and regional shipments. However, rail and sea freight consolidation are gaining traction as companies seek more sustainable and cost-effective options for longer distances. In terms of shipment types, Less than Container Load (LCL) services are experiencing accelerated growth, driven by small and medium-sized enterprises (SMEs) and e-commerce businesses that require flexibility for smaller cargo volumes. Full Container Load (FCL) services continue to be essential for larger shipments, providing dedicated capacity and security. Geographically, the Asia Pacific region, particularly China and India, is emerging as a key growth hub, owing to its manufacturing prowess and expanding consumer markets. North America and Europe remain significant markets, driven by well-established logistics infrastructure and a strong emphasis on supply chain optimization.

Freight Consolidation Service Company Market Share
This report offers an in-depth analysis of the global Freight Consolidation Service market, providing critical insights into market dynamics, growth trends, regional dominance, product innovations, key challenges, and emerging opportunities. Covering the period from 2019 to 2033, with a base year of 2025, this comprehensive study is designed for industry professionals seeking to understand the evolving landscape of freight consolidation.
Freight Consolidation Service Market Dynamics & Structure
The freight consolidation service market exhibits a moderately concentrated structure, characterized by the presence of large global players and a significant number of regional and specialized providers. Technological innovation is a primary driver, with advancements in route optimization software, real-time tracking, and AI-powered demand forecasting enhancing efficiency and reducing costs. Regulatory frameworks, while generally supportive of trade, can introduce complexities related to customs, international shipping, and environmental compliance. Competitive product substitutes include direct shipping for high-volume clients and fragmented logistics solutions for smaller shipments. End-user demographics are diverse, ranging from e-commerce businesses and manufacturers to retailers and distributors, all seeking to optimize their supply chains. Mergers and acquisitions (M&A) are a significant trend, with companies like CH Robinson and CEVA Logistics actively consolidating their market positions through strategic acquisitions.
- Market Concentration: Dominated by a few key players, but with significant room for niche providers.
- Technological Innovation: Driven by AI, IoT for tracking, and advanced analytics for route optimization.
- Regulatory Environment: Influenced by international trade agreements, customs regulations, and sustainability mandates.
- Competitive Landscape: Direct shipping, specialized carriers, and other third-party logistics (3PL) providers.
- End-User Base: Broad spectrum including e-commerce, manufacturing, retail, and automotive sectors.
- M&A Activity: Ongoing consolidation to achieve economies of scale and expand service portfolios.
Freight Consolidation Service Growth Trends & Insights
The global freight consolidation service market is projected to witness substantial growth, driven by the relentless expansion of e-commerce, increasing globalization of supply chains, and the growing demand for cost-effective logistics solutions. The market size is expected to evolve from an estimated $150 billion in 2025 to reach approximately $220 billion by 2033, exhibiting a Compound Annual Growth Rate (CAGR) of around 5.0% during the forecast period. Adoption rates for freight consolidation services are steadily increasing across industries as businesses recognize the benefits of pooling less-than-container load (LCL) shipments to achieve economies of scale and reduce per-unit transportation costs. Technological disruptions, particularly in digital freight forwarding platforms and blockchain for enhanced transparency, are further accelerating market penetration. Consumer behavior shifts towards faster delivery times and greater visibility in transit are also pushing logistics providers to adopt more efficient consolidation strategies.
- Market Size Evolution: From an estimated $150 billion in 2025 to over $220 billion by 2033.
- CAGR: Projected at approximately 5.0% from 2025 to 2033.
- Adoption Rates: Increasing across e-commerce, retail, and manufacturing due to cost efficiencies.
- Technological Disruptions: Digitalization, AI-driven analytics, and real-time tracking are key enablers.
- Consumer Behavior Shifts: Demand for faster, more transparent, and cost-effective shipping.
- Market Penetration: Deepening across various industry segments as the benefits become clearer.
Dominant Regions, Countries, or Segments in Freight Consolidation Service
Road Freight Consolidation is emerging as the most dominant application segment within the global freight consolidation service market. This dominance is fueled by the extensive infrastructure of road networks and the inherent flexibility and reach of road transportation, particularly for last-mile delivery and regional distribution. North America and Europe are leading regions, driven by highly developed logistics ecosystems, substantial manufacturing bases, and a thriving e-commerce sector. The Less than Container Load (LCL) type segment also plays a pivotal role, catering to small and medium-sized enterprises (SMEs) and businesses with fluctuating shipment volumes, offering them access to cost-effective international shipping solutions.
- Dominant Application Segment: Road Freight Consolidation.
- Key Drivers: Extensive road networks, last-mile delivery efficiency, flexibility for regional distribution.
- Market Share: Estimated to hold over 45% of the total freight consolidation market in 2025.
- Growth Potential: Significant due to increasing e-commerce last-mile demands and cross-border trade.
- Dominant Type Segment: Less than Container Load (LCL).
- Key Drivers: Cost-effectiveness for SMEs, demand for flexible shipping solutions, optimized utilization of container space.
- Market Share: Expected to constitute around 55% of the consolidated shipment types in 2025.
- Growth Potential: Robust growth driven by the proliferation of e-commerce sellers and SMEs engaged in international trade.
- Leading Regions: North America and Europe.
- Dominance Factors: Advanced logistics infrastructure, strong manufacturing and retail sectors, high e-commerce penetration, favorable trade policies.
- Market Share (Regions): North America estimated at 30% and Europe at 28% of the global market in 2025.
- Growth Potential: Sustained growth driven by technological adoption and trade expansion.
Freight Consolidation Service Product Landscape
The freight consolidation service landscape is characterized by a growing emphasis on technology-driven solutions designed to enhance efficiency, transparency, and cost-effectiveness. Innovations include advanced software platforms for intelligent load building, real-time shipment tracking via IoT devices, and predictive analytics for optimizing routes and reducing transit times. These advancements allow for more precise consolidation of LCL and FCL shipments, leading to improved asset utilization and lower environmental impact. Unique selling propositions are increasingly centered around integrated digital platforms that offer end-to-end visibility from booking to final delivery, alongside dedicated customer support and specialized handling for various cargo types.
Key Drivers, Barriers & Challenges in Freight Consolidation Service
Key Drivers:
- E-commerce Growth: Surging online retail necessitates efficient and cost-effective shipping solutions.
- Globalization of Supply Chains: Companies seeking to expand their reach globally require optimized logistics.
- Technological Advancements: Digital platforms, AI, and real-time tracking improve efficiency and transparency.
- Cost Optimization Demands: Businesses are continually looking for ways to reduce transportation expenses.
- Sustainability Initiatives: Consolidation reduces the carbon footprint per unit of goods shipped.
Barriers & Challenges:
- Supply Chain Disruptions: Geopolitical events, natural disasters, and port congestion can impact transit times and costs.
- Regulatory Complexity: Navigating diverse international trade regulations and customs procedures.
- Infrastructure Limitations: Inadequate infrastructure in certain developing regions can hinder consolidation efficiency.
- Competition from Direct Shipping: For very large volumes, direct shipping might still be preferred.
- Data Security Concerns: Protecting sensitive shipment and customer data on digital platforms.
Emerging Opportunities in Freight Consolidation Service
Emerging opportunities in the freight consolidation service sector lie in the expansion of multimodal consolidation solutions, integrating road, rail, and sea freight more seamlessly. The growth of specialized consolidation for temperature-sensitive goods and oversized cargo presents a niche but lucrative avenue. Furthermore, the increasing demand for green logistics is opening doors for providers who can demonstrate significant carbon footprint reduction through optimized consolidation. Developing digital platforms that offer predictive insights into supply chain risks and real-time rerouting capabilities will also be a key differentiator.
Growth Accelerators in the Freight Consolidation Service Industry
Growth in the freight consolidation industry is being accelerated by strategic partnerships between logistics providers and technology firms to develop more sophisticated digital platforms. The ongoing investment in infrastructure by governments and private entities, particularly in emerging economies, is creating new corridors for consolidated freight movement. Furthermore, the increasing adoption of data analytics and AI for predictive demand forecasting and dynamic route optimization is significantly enhancing the efficiency and attractiveness of consolidation services. Market expansion into underserved regions and the development of specialized consolidation services for niche industries are also acting as significant growth catalysts.
Key Players Shaping the Freight Consolidation Service Market
- CH Robinson
- TCB Group
- Weber
- Trinity
- King Solutions
- Transload Services USA
- CEVA Logistics
- Unicargo
- Flock Freight
- Averitt
- R+L Global Logistics
- Denholm Good Logistics
- Wicker Park Logistics
- Affiliated Warehouse Companies
- Röhlig Logistics
- FW Logistics
- FST
- Exim Cargo
- Transmodal
- CCSASTI
- AIT Worldwide Logistics
Notable Milestones in Freight Consolidation Service Sector
- 2019: Increased adoption of AI in route optimization software by leading logistics firms.
- 2020: Surge in e-commerce driving demand for LCL consolidation services globally.
- 2021: Major M&A activity, with CH Robinson acquiring Kelly Logistics.
- 2022: Introduction of blockchain-based tracking solutions for enhanced supply chain transparency by several providers.
- 2023: Growing emphasis on sustainable logistics practices and reduced carbon emissions in freight consolidation.
- 2024: Expansion of digital freight forwarding platforms offering end-to-end visibility.
- 2025 (Estimated): Significant market growth projected due to continued e-commerce expansion and global trade recovery.
In-Depth Freight Consolidation Service Market Outlook
The freight consolidation service market is poised for robust and sustained growth through 2033, driven by technological innovation and evolving global trade dynamics. Strategic alliances and the development of integrated digital ecosystems will be crucial for market leaders. The increasing focus on supply chain resilience and sustainability will favor companies that can offer transparent, efficient, and environmentally conscious consolidation solutions. Emerging markets present significant untapped potential, while continued investment in multimodal transportation infrastructure will further enhance the reach and effectiveness of consolidation services, ensuring its critical role in global logistics.
Freight Consolidation Service Segmentation
-
1. Application
- 1.1. Road Freight Consolidation
- 1.2. Rail Freight Consolidation
- 1.3. Sea Freight Consolidation
- 1.4. Others
-
2. Types
- 2.1. Less than Container Load (LCL)
- 2.2. Full Container Load (FCL)
Freight Consolidation Service Segmentation By Geography
-
1. North America
- 1.1. United States
- 1.2. Canada
- 1.3. Mexico
-
2. South America
- 2.1. Brazil
- 2.2. Argentina
- 2.3. Rest of South America
-
3. Europe
- 3.1. United Kingdom
- 3.2. Germany
- 3.3. France
- 3.4. Italy
- 3.5. Spain
- 3.6. Russia
- 3.7. Benelux
- 3.8. Nordics
- 3.9. Rest of Europe
-
4. Middle East & Africa
- 4.1. Turkey
- 4.2. Israel
- 4.3. GCC
- 4.4. North Africa
- 4.5. South Africa
- 4.6. Rest of Middle East & Africa
-
5. Asia Pacific
- 5.1. China
- 5.2. India
- 5.3. Japan
- 5.4. South Korea
- 5.5. ASEAN
- 5.6. Oceania
- 5.7. Rest of Asia Pacific
Freight Consolidation Service Regional Market Share
Geographic Coverage of Freight Consolidation Service
Freight Consolidation Service REPORT HIGHLIGHTS
| Aspects | Details |
|---|---|
| Study Period | 2020-2034 |
| Base Year | 2025 |
| Estimated Year | 2026 |
| Forecast Period | 2026-2034 |
| Historical Period | 2020-2025 |
| Growth Rate | CAGR of 5% from 2020-2034 |
| Segmentation |
|
Table of Contents
- 1. Introduction
- 1.1. Research Scope
- 1.2. Market Segmentation
- 1.3. Research Methodology
- 1.4. Definitions and Assumptions
- 2. Executive Summary
- 2.1. Introduction
- 3. Market Dynamics
- 3.1. Introduction
- 3.2. Market Drivers
- 3.3. Market Restrains
- 3.4. Market Trends
- 4. Market Factor Analysis
- 4.1. Porters Five Forces
- 4.2. Supply/Value Chain
- 4.3. PESTEL analysis
- 4.4. Market Entropy
- 4.5. Patent/Trademark Analysis
- 5. Global Freight Consolidation Service Analysis, Insights and Forecast, 2020-2032
- 5.1. Market Analysis, Insights and Forecast - by Application
- 5.1.1. Road Freight Consolidation
- 5.1.2. Rail Freight Consolidation
- 5.1.3. Sea Freight Consolidation
- 5.1.4. Others
- 5.2. Market Analysis, Insights and Forecast - by Types
- 5.2.1. Less than Container Load (LCL)
- 5.2.2. Full Container Load (FCL)
- 5.3. Market Analysis, Insights and Forecast - by Region
- 5.3.1. North America
- 5.3.2. South America
- 5.3.3. Europe
- 5.3.4. Middle East & Africa
- 5.3.5. Asia Pacific
- 5.1. Market Analysis, Insights and Forecast - by Application
- 6. North America Freight Consolidation Service Analysis, Insights and Forecast, 2020-2032
- 6.1. Market Analysis, Insights and Forecast - by Application
- 6.1.1. Road Freight Consolidation
- 6.1.2. Rail Freight Consolidation
- 6.1.3. Sea Freight Consolidation
- 6.1.4. Others
- 6.2. Market Analysis, Insights and Forecast - by Types
- 6.2.1. Less than Container Load (LCL)
- 6.2.2. Full Container Load (FCL)
- 6.1. Market Analysis, Insights and Forecast - by Application
- 7. South America Freight Consolidation Service Analysis, Insights and Forecast, 2020-2032
- 7.1. Market Analysis, Insights and Forecast - by Application
- 7.1.1. Road Freight Consolidation
- 7.1.2. Rail Freight Consolidation
- 7.1.3. Sea Freight Consolidation
- 7.1.4. Others
- 7.2. Market Analysis, Insights and Forecast - by Types
- 7.2.1. Less than Container Load (LCL)
- 7.2.2. Full Container Load (FCL)
- 7.1. Market Analysis, Insights and Forecast - by Application
- 8. Europe Freight Consolidation Service Analysis, Insights and Forecast, 2020-2032
- 8.1. Market Analysis, Insights and Forecast - by Application
- 8.1.1. Road Freight Consolidation
- 8.1.2. Rail Freight Consolidation
- 8.1.3. Sea Freight Consolidation
- 8.1.4. Others
- 8.2. Market Analysis, Insights and Forecast - by Types
- 8.2.1. Less than Container Load (LCL)
- 8.2.2. Full Container Load (FCL)
- 8.1. Market Analysis, Insights and Forecast - by Application
- 9. Middle East & Africa Freight Consolidation Service Analysis, Insights and Forecast, 2020-2032
- 9.1. Market Analysis, Insights and Forecast - by Application
- 9.1.1. Road Freight Consolidation
- 9.1.2. Rail Freight Consolidation
- 9.1.3. Sea Freight Consolidation
- 9.1.4. Others
- 9.2. Market Analysis, Insights and Forecast - by Types
- 9.2.1. Less than Container Load (LCL)
- 9.2.2. Full Container Load (FCL)
- 9.1. Market Analysis, Insights and Forecast - by Application
- 10. Asia Pacific Freight Consolidation Service Analysis, Insights and Forecast, 2020-2032
- 10.1. Market Analysis, Insights and Forecast - by Application
- 10.1.1. Road Freight Consolidation
- 10.1.2. Rail Freight Consolidation
- 10.1.3. Sea Freight Consolidation
- 10.1.4. Others
- 10.2. Market Analysis, Insights and Forecast - by Types
- 10.2.1. Less than Container Load (LCL)
- 10.2.2. Full Container Load (FCL)
- 10.1. Market Analysis, Insights and Forecast - by Application
- 11. Competitive Analysis
- 11.1. Global Market Share Analysis 2025
- 11.2. Company Profiles
- 11.2.1 CH Robinson
- 11.2.1.1. Overview
- 11.2.1.2. Products
- 11.2.1.3. SWOT Analysis
- 11.2.1.4. Recent Developments
- 11.2.1.5. Financials (Based on Availability)
- 11.2.2 TCB Group
- 11.2.2.1. Overview
- 11.2.2.2. Products
- 11.2.2.3. SWOT Analysis
- 11.2.2.4. Recent Developments
- 11.2.2.5. Financials (Based on Availability)
- 11.2.3 Weber
- 11.2.3.1. Overview
- 11.2.3.2. Products
- 11.2.3.3. SWOT Analysis
- 11.2.3.4. Recent Developments
- 11.2.3.5. Financials (Based on Availability)
- 11.2.4 Trinity
- 11.2.4.1. Overview
- 11.2.4.2. Products
- 11.2.4.3. SWOT Analysis
- 11.2.4.4. Recent Developments
- 11.2.4.5. Financials (Based on Availability)
- 11.2.5 King Solutions
- 11.2.5.1. Overview
- 11.2.5.2. Products
- 11.2.5.3. SWOT Analysis
- 11.2.5.4. Recent Developments
- 11.2.5.5. Financials (Based on Availability)
- 11.2.6 Transload Services USA
- 11.2.6.1. Overview
- 11.2.6.2. Products
- 11.2.6.3. SWOT Analysis
- 11.2.6.4. Recent Developments
- 11.2.6.5. Financials (Based on Availability)
- 11.2.7 CEVA Logistics
- 11.2.7.1. Overview
- 11.2.7.2. Products
- 11.2.7.3. SWOT Analysis
- 11.2.7.4. Recent Developments
- 11.2.7.5. Financials (Based on Availability)
- 11.2.8 Unicargo
- 11.2.8.1. Overview
- 11.2.8.2. Products
- 11.2.8.3. SWOT Analysis
- 11.2.8.4. Recent Developments
- 11.2.8.5. Financials (Based on Availability)
- 11.2.9 Flock Freight
- 11.2.9.1. Overview
- 11.2.9.2. Products
- 11.2.9.3. SWOT Analysis
- 11.2.9.4. Recent Developments
- 11.2.9.5. Financials (Based on Availability)
- 11.2.10 Averitt
- 11.2.10.1. Overview
- 11.2.10.2. Products
- 11.2.10.3. SWOT Analysis
- 11.2.10.4. Recent Developments
- 11.2.10.5. Financials (Based on Availability)
- 11.2.11 R+L Global Logistics
- 11.2.11.1. Overview
- 11.2.11.2. Products
- 11.2.11.3. SWOT Analysis
- 11.2.11.4. Recent Developments
- 11.2.11.5. Financials (Based on Availability)
- 11.2.12 Denholm Good Logistics
- 11.2.12.1. Overview
- 11.2.12.2. Products
- 11.2.12.3. SWOT Analysis
- 11.2.12.4. Recent Developments
- 11.2.12.5. Financials (Based on Availability)
- 11.2.13 Wicker Park Logistics
- 11.2.13.1. Overview
- 11.2.13.2. Products
- 11.2.13.3. SWOT Analysis
- 11.2.13.4. Recent Developments
- 11.2.13.5. Financials (Based on Availability)
- 11.2.14 Affiliated Warehouse Companies
- 11.2.14.1. Overview
- 11.2.14.2. Products
- 11.2.14.3. SWOT Analysis
- 11.2.14.4. Recent Developments
- 11.2.14.5. Financials (Based on Availability)
- 11.2.15 Röhlig Logistics
- 11.2.15.1. Overview
- 11.2.15.2. Products
- 11.2.15.3. SWOT Analysis
- 11.2.15.4. Recent Developments
- 11.2.15.5. Financials (Based on Availability)
- 11.2.16 FW Logistics
- 11.2.16.1. Overview
- 11.2.16.2. Products
- 11.2.16.3. SWOT Analysis
- 11.2.16.4. Recent Developments
- 11.2.16.5. Financials (Based on Availability)
- 11.2.17 FST
- 11.2.17.1. Overview
- 11.2.17.2. Products
- 11.2.17.3. SWOT Analysis
- 11.2.17.4. Recent Developments
- 11.2.17.5. Financials (Based on Availability)
- 11.2.18 Exim Cargo
- 11.2.18.1. Overview
- 11.2.18.2. Products
- 11.2.18.3. SWOT Analysis
- 11.2.18.4. Recent Developments
- 11.2.18.5. Financials (Based on Availability)
- 11.2.19 Transmodal
- 11.2.19.1. Overview
- 11.2.19.2. Products
- 11.2.19.3. SWOT Analysis
- 11.2.19.4. Recent Developments
- 11.2.19.5. Financials (Based on Availability)
- 11.2.20 CCSASTI
- 11.2.20.1. Overview
- 11.2.20.2. Products
- 11.2.20.3. SWOT Analysis
- 11.2.20.4. Recent Developments
- 11.2.20.5. Financials (Based on Availability)
- 11.2.21 AIT Worldwide Logistics
- 11.2.21.1. Overview
- 11.2.21.2. Products
- 11.2.21.3. SWOT Analysis
- 11.2.21.4. Recent Developments
- 11.2.21.5. Financials (Based on Availability)
- 11.2.1 CH Robinson
List of Figures
- Figure 1: Global Freight Consolidation Service Revenue Breakdown (undefined, %) by Region 2025 & 2033
- Figure 2: North America Freight Consolidation Service Revenue (undefined), by Application 2025 & 2033
- Figure 3: North America Freight Consolidation Service Revenue Share (%), by Application 2025 & 2033
- Figure 4: North America Freight Consolidation Service Revenue (undefined), by Types 2025 & 2033
- Figure 5: North America Freight Consolidation Service Revenue Share (%), by Types 2025 & 2033
- Figure 6: North America Freight Consolidation Service Revenue (undefined), by Country 2025 & 2033
- Figure 7: North America Freight Consolidation Service Revenue Share (%), by Country 2025 & 2033
- Figure 8: South America Freight Consolidation Service Revenue (undefined), by Application 2025 & 2033
- Figure 9: South America Freight Consolidation Service Revenue Share (%), by Application 2025 & 2033
- Figure 10: South America Freight Consolidation Service Revenue (undefined), by Types 2025 & 2033
- Figure 11: South America Freight Consolidation Service Revenue Share (%), by Types 2025 & 2033
- Figure 12: South America Freight Consolidation Service Revenue (undefined), by Country 2025 & 2033
- Figure 13: South America Freight Consolidation Service Revenue Share (%), by Country 2025 & 2033
- Figure 14: Europe Freight Consolidation Service Revenue (undefined), by Application 2025 & 2033
- Figure 15: Europe Freight Consolidation Service Revenue Share (%), by Application 2025 & 2033
- Figure 16: Europe Freight Consolidation Service Revenue (undefined), by Types 2025 & 2033
- Figure 17: Europe Freight Consolidation Service Revenue Share (%), by Types 2025 & 2033
- Figure 18: Europe Freight Consolidation Service Revenue (undefined), by Country 2025 & 2033
- Figure 19: Europe Freight Consolidation Service Revenue Share (%), by Country 2025 & 2033
- Figure 20: Middle East & Africa Freight Consolidation Service Revenue (undefined), by Application 2025 & 2033
- Figure 21: Middle East & Africa Freight Consolidation Service Revenue Share (%), by Application 2025 & 2033
- Figure 22: Middle East & Africa Freight Consolidation Service Revenue (undefined), by Types 2025 & 2033
- Figure 23: Middle East & Africa Freight Consolidation Service Revenue Share (%), by Types 2025 & 2033
- Figure 24: Middle East & Africa Freight Consolidation Service Revenue (undefined), by Country 2025 & 2033
- Figure 25: Middle East & Africa Freight Consolidation Service Revenue Share (%), by Country 2025 & 2033
- Figure 26: Asia Pacific Freight Consolidation Service Revenue (undefined), by Application 2025 & 2033
- Figure 27: Asia Pacific Freight Consolidation Service Revenue Share (%), by Application 2025 & 2033
- Figure 28: Asia Pacific Freight Consolidation Service Revenue (undefined), by Types 2025 & 2033
- Figure 29: Asia Pacific Freight Consolidation Service Revenue Share (%), by Types 2025 & 2033
- Figure 30: Asia Pacific Freight Consolidation Service Revenue (undefined), by Country 2025 & 2033
- Figure 31: Asia Pacific Freight Consolidation Service Revenue Share (%), by Country 2025 & 2033
List of Tables
- Table 1: Global Freight Consolidation Service Revenue undefined Forecast, by Application 2020 & 2033
- Table 2: Global Freight Consolidation Service Revenue undefined Forecast, by Types 2020 & 2033
- Table 3: Global Freight Consolidation Service Revenue undefined Forecast, by Region 2020 & 2033
- Table 4: Global Freight Consolidation Service Revenue undefined Forecast, by Application 2020 & 2033
- Table 5: Global Freight Consolidation Service Revenue undefined Forecast, by Types 2020 & 2033
- Table 6: Global Freight Consolidation Service Revenue undefined Forecast, by Country 2020 & 2033
- Table 7: United States Freight Consolidation Service Revenue (undefined) Forecast, by Application 2020 & 2033
- Table 8: Canada Freight Consolidation Service Revenue (undefined) Forecast, by Application 2020 & 2033
- Table 9: Mexico Freight Consolidation Service Revenue (undefined) Forecast, by Application 2020 & 2033
- Table 10: Global Freight Consolidation Service Revenue undefined Forecast, by Application 2020 & 2033
- Table 11: Global Freight Consolidation Service Revenue undefined Forecast, by Types 2020 & 2033
- Table 12: Global Freight Consolidation Service Revenue undefined Forecast, by Country 2020 & 2033
- Table 13: Brazil Freight Consolidation Service Revenue (undefined) Forecast, by Application 2020 & 2033
- Table 14: Argentina Freight Consolidation Service Revenue (undefined) Forecast, by Application 2020 & 2033
- Table 15: Rest of South America Freight Consolidation Service Revenue (undefined) Forecast, by Application 2020 & 2033
- Table 16: Global Freight Consolidation Service Revenue undefined Forecast, by Application 2020 & 2033
- Table 17: Global Freight Consolidation Service Revenue undefined Forecast, by Types 2020 & 2033
- Table 18: Global Freight Consolidation Service Revenue undefined Forecast, by Country 2020 & 2033
- Table 19: United Kingdom Freight Consolidation Service Revenue (undefined) Forecast, by Application 2020 & 2033
- Table 20: Germany Freight Consolidation Service Revenue (undefined) Forecast, by Application 2020 & 2033
- Table 21: France Freight Consolidation Service Revenue (undefined) Forecast, by Application 2020 & 2033
- Table 22: Italy Freight Consolidation Service Revenue (undefined) Forecast, by Application 2020 & 2033
- Table 23: Spain Freight Consolidation Service Revenue (undefined) Forecast, by Application 2020 & 2033
- Table 24: Russia Freight Consolidation Service Revenue (undefined) Forecast, by Application 2020 & 2033
- Table 25: Benelux Freight Consolidation Service Revenue (undefined) Forecast, by Application 2020 & 2033
- Table 26: Nordics Freight Consolidation Service Revenue (undefined) Forecast, by Application 2020 & 2033
- Table 27: Rest of Europe Freight Consolidation Service Revenue (undefined) Forecast, by Application 2020 & 2033
- Table 28: Global Freight Consolidation Service Revenue undefined Forecast, by Application 2020 & 2033
- Table 29: Global Freight Consolidation Service Revenue undefined Forecast, by Types 2020 & 2033
- Table 30: Global Freight Consolidation Service Revenue undefined Forecast, by Country 2020 & 2033
- Table 31: Turkey Freight Consolidation Service Revenue (undefined) Forecast, by Application 2020 & 2033
- Table 32: Israel Freight Consolidation Service Revenue (undefined) Forecast, by Application 2020 & 2033
- Table 33: GCC Freight Consolidation Service Revenue (undefined) Forecast, by Application 2020 & 2033
- Table 34: North Africa Freight Consolidation Service Revenue (undefined) Forecast, by Application 2020 & 2033
- Table 35: South Africa Freight Consolidation Service Revenue (undefined) Forecast, by Application 2020 & 2033
- Table 36: Rest of Middle East & Africa Freight Consolidation Service Revenue (undefined) Forecast, by Application 2020 & 2033
- Table 37: Global Freight Consolidation Service Revenue undefined Forecast, by Application 2020 & 2033
- Table 38: Global Freight Consolidation Service Revenue undefined Forecast, by Types 2020 & 2033
- Table 39: Global Freight Consolidation Service Revenue undefined Forecast, by Country 2020 & 2033
- Table 40: China Freight Consolidation Service Revenue (undefined) Forecast, by Application 2020 & 2033
- Table 41: India Freight Consolidation Service Revenue (undefined) Forecast, by Application 2020 & 2033
- Table 42: Japan Freight Consolidation Service Revenue (undefined) Forecast, by Application 2020 & 2033
- Table 43: South Korea Freight Consolidation Service Revenue (undefined) Forecast, by Application 2020 & 2033
- Table 44: ASEAN Freight Consolidation Service Revenue (undefined) Forecast, by Application 2020 & 2033
- Table 45: Oceania Freight Consolidation Service Revenue (undefined) Forecast, by Application 2020 & 2033
- Table 46: Rest of Asia Pacific Freight Consolidation Service Revenue (undefined) Forecast, by Application 2020 & 2033
Frequently Asked Questions
1. What is the projected Compound Annual Growth Rate (CAGR) of the Freight Consolidation Service?
The projected CAGR is approximately 5%.
2. Which companies are prominent players in the Freight Consolidation Service?
Key companies in the market include CH Robinson, TCB Group, Weber, Trinity, King Solutions, Transload Services USA, CEVA Logistics, Unicargo, Flock Freight, Averitt, R+L Global Logistics, Denholm Good Logistics, Wicker Park Logistics, Affiliated Warehouse Companies, Röhlig Logistics, FW Logistics, FST, Exim Cargo, Transmodal, CCSASTI, AIT Worldwide Logistics.
3. What are the main segments of the Freight Consolidation Service?
The market segments include Application, Types.
4. Can you provide details about the market size?
The market size is estimated to be USD XXX N/A as of 2022.
5. What are some drivers contributing to market growth?
N/A
6. What are the notable trends driving market growth?
N/A
7. Are there any restraints impacting market growth?
N/A
8. Can you provide examples of recent developments in the market?
N/A
9. What pricing options are available for accessing the report?
Pricing options include single-user, multi-user, and enterprise licenses priced at USD 4900.00, USD 7350.00, and USD 9800.00 respectively.
10. Is the market size provided in terms of value or volume?
The market size is provided in terms of value, measured in N/A.
11. Are there any specific market keywords associated with the report?
Yes, the market keyword associated with the report is "Freight Consolidation Service," which aids in identifying and referencing the specific market segment covered.
12. How do I determine which pricing option suits my needs best?
The pricing options vary based on user requirements and access needs. Individual users may opt for single-user licenses, while businesses requiring broader access may choose multi-user or enterprise licenses for cost-effective access to the report.
13. Are there any additional resources or data provided in the Freight Consolidation Service report?
While the report offers comprehensive insights, it's advisable to review the specific contents or supplementary materials provided to ascertain if additional resources or data are available.
14. How can I stay updated on further developments or reports in the Freight Consolidation Service?
To stay informed about further developments, trends, and reports in the Freight Consolidation Service, consider subscribing to industry newsletters, following relevant companies and organizations, or regularly checking reputable industry news sources and publications.
Methodology
Step 1 - Identification of Relevant Samples Size from Population Database


Step 2 - Approaches for Defining Global Market Size (Value, Volume* & Price*)

Note*: In applicable scenarios
Step 3 - Data Sources
Primary Research
- Web Analytics
- Survey Reports
- Research Institute
- Latest Research Reports
- Opinion Leaders
Secondary Research
- Annual Reports
- White Paper
- Latest Press Release
- Industry Association
- Paid Database
- Investor Presentations

Step 4 - Data Triangulation
Involves using different sources of information in order to increase the validity of a study
These sources are likely to be stakeholders in a program - participants, other researchers, program staff, other community members, and so on.
Then we put all data in single framework & apply various statistical tools to find out the dynamic on the market.
During the analysis stage, feedback from the stakeholder groups would be compared to determine areas of agreement as well as areas of divergence