

Key Insights
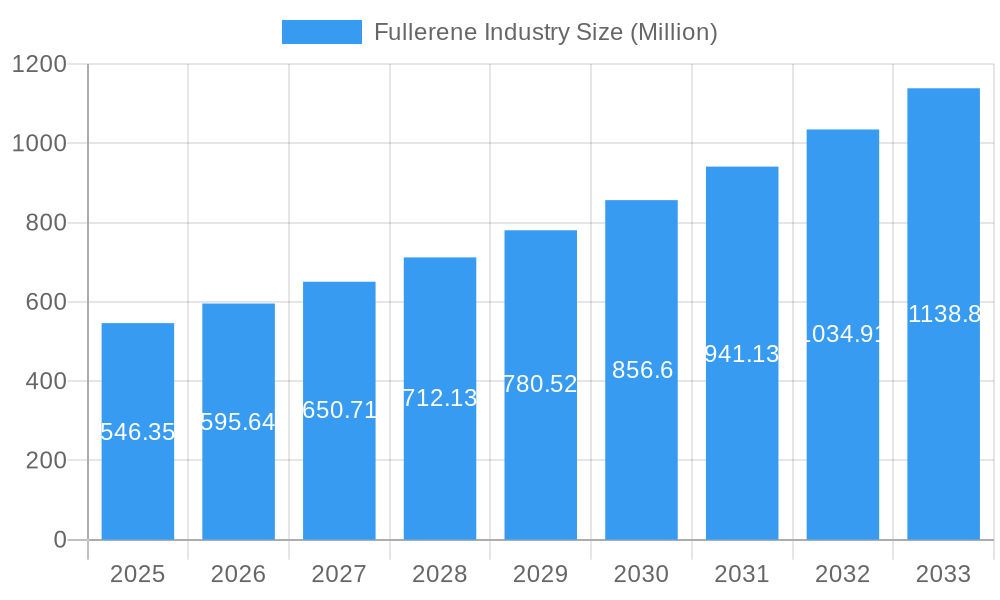
The fullerene market, valued at $546.35 million in 2025, is projected to experience robust growth, driven by increasing applications in diverse sectors. The Compound Annual Growth Rate (CAGR) of 8.97% from 2025 to 2033 signifies a substantial expansion of this market. Key drivers include the rising demand for high-performance materials in electronics, energy storage, and biomedical applications. Advancements in fullerene synthesis and functionalization techniques are further fueling market growth. The increasing use of fullerenes in drug delivery systems, solar cells, and conductive composites contributes significantly to this upward trajectory. While challenges such as high production costs and potential toxicity remain, ongoing research and development efforts are aimed at addressing these limitations. The market is segmented by type (e.g., C60, C70, and functionalized fullerenes), application (e.g., electronics, energy, biomedicine), and region. Major players like NanoMaterials Ltd, IoLiTec, Luna Industries, and Mitsubishi Corporation are actively shaping the market landscape through innovations and strategic partnerships. The competitive landscape is dynamic, with both established players and emerging companies contributing to the fullerene market's evolution. The forecast period suggests continued expansion, propelled by technological breakthroughs and increasing industry investments.
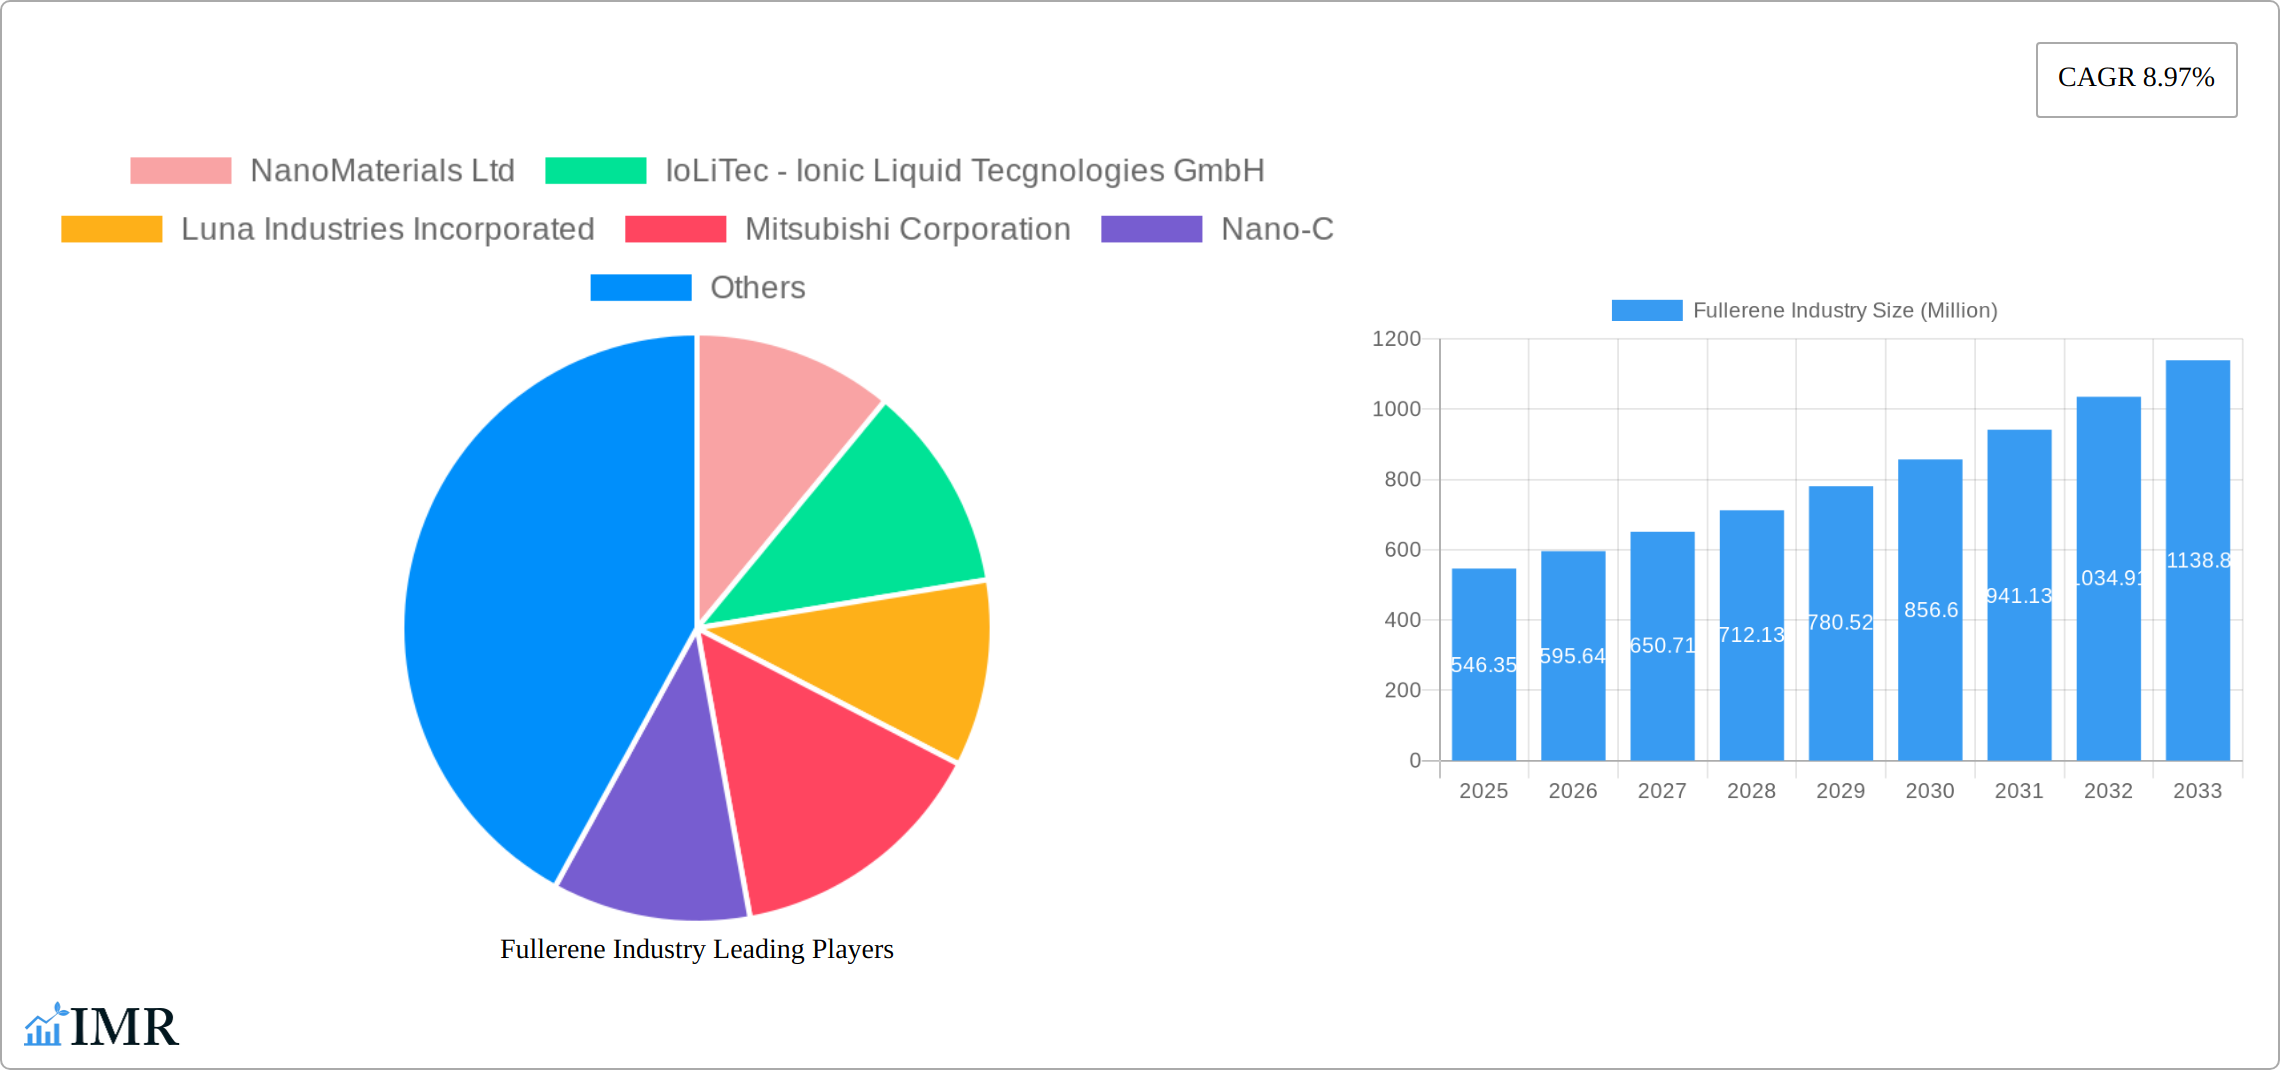
Fullerene Industry Market Size (In Million)
The fullerene market's regional distribution is likely to show variations, with North America and Europe holding substantial shares due to strong research infrastructure and early adoption of fullerene-based technologies. Asia-Pacific is anticipated to witness significant growth in the coming years, driven by increasing industrialization and rising demand for advanced materials in emerging economies. Government initiatives promoting nanotechnology research and development will also play a crucial role in shaping the regional dynamics of the market. The competitive landscape is characterized by a mix of large multinational corporations and specialized nanotechnology companies. Strategic collaborations, mergers, and acquisitions are expected to further consolidate the market and accelerate innovation. Continued focus on enhancing fullerene production efficiency and exploring novel applications will be key factors influencing the market trajectory in the forecast period.
Fullerene Industry Company Market Share
Fullerene Industry Market Report: A Comprehensive Analysis (2019-2033)
This comprehensive report provides a detailed analysis of the Fullerene industry, offering invaluable insights for industry professionals, investors, and researchers. The study covers the period 2019-2033, with 2025 as the base and estimated year. We delve into market dynamics, growth trends, regional dominance, product landscapes, and key players, providing a 360-degree view of this rapidly evolving market. The report utilizes a robust methodology incorporating both qualitative and quantitative data to offer actionable intelligence. The total market size is projected to reach xx Million by 2033.
Fullerene Industry Market Dynamics & Structure
This section analyzes the competitive landscape of the Fullerene industry, examining market concentration, technological innovation, regulatory influences, and market dynamics. The market is characterized by a moderately fragmented structure with several key players vying for market share. Technological advancements play a crucial role, driving innovation and creating new opportunities. Stringent regulatory frameworks influence production and application of fullerenes. Moreover, the report also investigates mergers and acquisitions, with a detailed analysis of deal volumes and their impact on market consolidation.
- Market Concentration: Moderately Fragmented (xx% top 5 players share in 2025)
- Technological Innovation Drivers: Nanotechnology advancements, material science breakthroughs, and improved synthesis techniques.
- Regulatory Frameworks: Stringent environmental regulations regarding production and disposal.
- Competitive Product Substitutes: Carbon nanotubes, graphene, and other nanomaterials.
- End-User Demographics: Diverse, including electronics, pharmaceuticals, energy storage, and biomedical applications.
- M&A Trends: Increasing consolidation, with xx M&A deals recorded in the historical period (2019-2024). These deals have primarily focused on expanding product portfolios and gaining access to new technologies. The average deal size was xx Million.
Fullerene Industry Growth Trends & Insights
The Fullerene industry is experiencing robust expansion, propelled by escalating demand across a wide spectrum of applications. This section provides a granular analysis of market size evolution, adoption rates, and transformative technological disruptions shaping its trajectory. Our report synthesizes extensive primary and secondary research to deliver precise estimations of market size and forecast growth. The Compound Annual Growth Rate (CAGR) is projected to reach xx% during the forecast period (2025-2033). Market penetration in pivotal sectors, including advanced energy solutions and cutting-edge pharmaceuticals, will continue to be a primary catalyst for growth. We meticulously examine the influence of evolving consumer behaviors, groundbreaking technological advancements, and the emergence of novel applications on the market's dynamic progression. Specific instances of technological disruptions and their consequential impacts are illuminated, alongside a thorough analysis of shifting consumer preferences and evolving market demands.
Dominant Regions, Countries, or Segments in Fullerene Industry
This section pinpoints the leading regions, countries, and segments driving Fullerene market growth. Analysis of economic policies, infrastructural development, and technological advancements in these regions helps to explain the dominance of specific markets. This section will quantitatively present the market share and future growth potential for each region. Further details and in-depth analysis of market-driving forces and dominance factors are provided.
- Leading Region: North America (Market share xx% in 2025)
- Key Drivers (North America): Strong R&D investments, well-established nanotechnology industry, and favorable government policies.
- Leading Country: USA (Market share xx% within North America in 2025)
- Key Drivers (USA): High adoption rate in advanced industries, significant government funding, and robust research infrastructure.
- Fastest Growing Segment: Biomedical Applications (Projected CAGR xx% during forecast period)
Fullerene Industry Product Landscape
The Fullerene industry boasts a rich and diverse product portfolio, characterized by an array of unique properties and burgeoning applications. This segment delves into pioneering product innovations, highlighting their distinct selling propositions and the technological leaps that have dramatically expanded the market's scope and capabilities. Our analysis encompasses various fullerene forms, such as C60 and C70, along with their meticulously engineered derivatives, emphasizing their distinct physicochemical characteristics and diverse application potentials.
Key Drivers, Barriers & Challenges in Fullerene Industry
The burgeoning growth of the Fullerene industry is propelled by several significant factors, including rapid advancements in nanotechnology, escalating demand from diverse industrial sectors, and substantial government support for research and development initiatives. Nevertheless, the industry grapples with persistent challenges, such as the high costs associated with production, inherent toxicity concerns that necessitate careful management, and the imperative for the establishment of robust and comprehensive regulatory frameworks. Furthermore, supply chain vulnerabilities and intensifying competitive pressures from alternative nanomaterials significantly influence the market's dynamic landscape.
Key Drivers:
- Breakthroughs in synthesis methodologies and functionalization techniques.
- Surging demand in high-growth sectors like advanced electronics and next-generation energy storage.
- Proactive government initiatives and dedicated R&D funding driving innovation.
Key Challenges:
- Substantial production costs and difficulties in achieving industrial-scale scalability.
- Potential toxicity concerns and the need for rigorous environmental impact assessments.
- Intense competition and the emergence of viable alternative nanomaterials.
Emerging Opportunities in Fullerene Industry
The Fullerene industry presents several exciting opportunities stemming from novel applications, untapped markets, and evolving consumer preferences. This section focuses on such opportunities and their potential impact on future market growth.
- Emerging applications in drug delivery and biomedical imaging.
- Expansion into new markets such as cosmetics and environmental remediation.
- Development of high-performance Fullerene-based composites.
Growth Accelerators in the Fullerene Industry
Long-term growth in the Fullerene industry will be propelled by technological breakthroughs, strategic partnerships, and market expansion strategies.
- Advancements in synthesis techniques that lower production costs.
- Strategic collaborations between research institutions and industry players.
- Expansion into emerging markets such as Asia-Pacific.
Key Players Shaping the Fullerene Industry Market
- NanoMaterials Ltd
- IoLiTec - Ionic Liquid Technologies GmbH
- Luna Industries Incorporated
- Mitsubishi Corporation
- Nano-C
- Nanotech Industrial Solutions
- SES Research Inc
- POWDER NANO
- Nanografi Nanotechnology
*List Not Exhaustive
Notable Milestones in Fullerene Industry Sector
- 2022: Nano-C announced a substantial expansion of its state-of-the-art Fullerene production facilities, significantly enhancing its manufacturing capacity.
- 2023: Mitsubishi Corporation made a strategic investment in a new cutting-edge research facility dedicated to exploring and developing Fullerene applications in advanced energy storage solutions.
- 2024: A prominent pharmaceutical organization reported the successful completion of clinical trials for innovative drug delivery systems leveraging Fullerene-based carriers. (Further significant milestones will be meticulously detailed within the comprehensive market report.)
In-Depth Fullerene Industry Market Outlook
The Fullerene industry is strategically positioned for accelerated growth in the forthcoming years, fueled by persistent and expanding demand across a multitude of sectors and a continuous stream of groundbreaking technological innovations. The cultivation of strategic partnerships, aggressive market expansion into dynamic emerging economies, and the pioneering development of novel, high-impact applications are poised to further catalyze market expansion. The market presents compelling opportunities for forward-thinking enterprises capable of effectively navigating and mitigating the inherent challenges related to production economics, scalability, and the intricacies of regulatory compliance.
Fullerene Industry Segmentation
-
1. Product Type
- 1.1. C60
- 1.2. C70
- 1.3. C76
- 1.4. Other Product Types
-
2. End-user Industry
- 2.1. Electrical and Electronics
- 2.2. Medical and Pharmaceuticals
- 2.3. Aerospace and Defense
- 2.4. Energy
- 2.5. Other End-user Industries
Fullerene Industry Segmentation By Geography
-
1. Asia Pacific
- 1.1. China
- 1.2. India
- 1.3. Japan
- 1.4. South Korea
- 1.5. ASEAN Countries
- 1.6. Rest of Asia Pacific
-
2. North America
- 2.1. United States
- 2.2. Canada
- 2.3. Mexico
-
3. Europe
- 3.1. Germany
- 3.2. United Kingdom
- 3.3. France
- 3.4. Italy
- 3.5. Rest of Europe
-
4. South America
- 4.1. Brazil
- 4.2. Argentina
- 4.3. Rest of South America
-
5. Middle East and Africa
- 5.1. Saudi Arabia
- 5.2. South Africa
- 5.3. Rest of Middle East and Africa

Fullerene Industry Regional Market Share
Geographic Coverage of Fullerene Industry
Fullerene Industry REPORT HIGHLIGHTS
| Aspects | Details |
|---|---|
| Study Period | 2020-2034 |
| Base Year | 2025 |
| Estimated Year | 2026 |
| Forecast Period | 2026-2034 |
| Historical Period | 2020-2025 |
| Growth Rate | CAGR of 8.97% from 2020-2034 |
| Segmentation |
|
Table of Contents
- 1. Introduction
- 1.1. Research Scope
- 1.2. Market Segmentation
- 1.3. Research Objective
- 1.4. Definitions and Assumptions
- 2. Executive Summary
- 2.1. Market Snapshot
- 3. Market Dynamics
- 3.1. Market Drivers
- 3.2. Market Restrains
- 3.3. Market Trends
- 3.4. Market Opportunities
- 4. Market Factor Analysis
- 4.1. Porters Five Forces
- 4.1.1. Bargaining Power of Suppliers
- 4.1.2. Bargaining Power of Buyers
- 4.1.3. Threat of New Entrants
- 4.1.4. Threat of Substitutes
- 4.1.5. Competitive Rivalry
- 4.2. PESTEL analysis
- 4.3. BCG Analysis
- 4.3.1. Stars (High Growth, High Market Share)
- 4.3.2. Cash Cows (Low Growth, High Market Share)
- 4.3.3. Question Mark (High Growth, Low Market Share)
- 4.3.4. Dogs (Low Growth, Low Market Share)
- 4.4. Ansoff Matrix Analysis
- 4.5. Supply Chain Analysis
- 4.6. Regulatory Landscape
- 4.7. Current Market Potential and Opportunity Assessment (TAM–SAM–SOM Framework)
- 4.8. IMR Analyst Note
- 4.1. Porters Five Forces
- 5. Market Analysis, Insights and Forecast 2021-2033
- 5.1. Market Analysis, Insights and Forecast - by Product Type
- 5.1.1. C60
- 5.1.2. C70
- 5.1.3. C76
- 5.1.4. Other Product Types
- 5.2. Market Analysis, Insights and Forecast - by End-user Industry
- 5.2.1. Electrical and Electronics
- 5.2.2. Medical and Pharmaceuticals
- 5.2.3. Aerospace and Defense
- 5.2.4. Energy
- 5.2.5. Other End-user Industries
- 5.3. Market Analysis, Insights and Forecast - by Region
- 5.3.1. Asia Pacific
- 5.3.2. North America
- 5.3.3. Europe
- 5.3.4. South America
- 5.3.5. Middle East and Africa
- 5.1. Market Analysis, Insights and Forecast - by Product Type
- 6. Global Fullerene Industry Analysis, Insights and Forecast, 2021-2033
- 6.1. Market Analysis, Insights and Forecast - by Product Type
- 6.1.1. C60
- 6.1.2. C70
- 6.1.3. C76
- 6.1.4. Other Product Types
- 6.2. Market Analysis, Insights and Forecast - by End-user Industry
- 6.2.1. Electrical and Electronics
- 6.2.2. Medical and Pharmaceuticals
- 6.2.3. Aerospace and Defense
- 6.2.4. Energy
- 6.2.5. Other End-user Industries
- 6.1. Market Analysis, Insights and Forecast - by Product Type
- 7. Asia Pacific Fullerene Industry Analysis, Insights and Forecast, 2020-2032
- 7.1. Market Analysis, Insights and Forecast - by Product Type
- 7.1.1. C60
- 7.1.2. C70
- 7.1.3. C76
- 7.1.4. Other Product Types
- 7.2. Market Analysis, Insights and Forecast - by End-user Industry
- 7.2.1. Electrical and Electronics
- 7.2.2. Medical and Pharmaceuticals
- 7.2.3. Aerospace and Defense
- 7.2.4. Energy
- 7.2.5. Other End-user Industries
- 7.1. Market Analysis, Insights and Forecast - by Product Type
- 8. North America Fullerene Industry Analysis, Insights and Forecast, 2020-2032
- 8.1. Market Analysis, Insights and Forecast - by Product Type
- 8.1.1. C60
- 8.1.2. C70
- 8.1.3. C76
- 8.1.4. Other Product Types
- 8.2. Market Analysis, Insights and Forecast - by End-user Industry
- 8.2.1. Electrical and Electronics
- 8.2.2. Medical and Pharmaceuticals
- 8.2.3. Aerospace and Defense
- 8.2.4. Energy
- 8.2.5. Other End-user Industries
- 8.1. Market Analysis, Insights and Forecast - by Product Type
- 9. Europe Fullerene Industry Analysis, Insights and Forecast, 2020-2032
- 9.1. Market Analysis, Insights and Forecast - by Product Type
- 9.1.1. C60
- 9.1.2. C70
- 9.1.3. C76
- 9.1.4. Other Product Types
- 9.2. Market Analysis, Insights and Forecast - by End-user Industry
- 9.2.1. Electrical and Electronics
- 9.2.2. Medical and Pharmaceuticals
- 9.2.3. Aerospace and Defense
- 9.2.4. Energy
- 9.2.5. Other End-user Industries
- 9.1. Market Analysis, Insights and Forecast - by Product Type
- 10. South America Fullerene Industry Analysis, Insights and Forecast, 2020-2032
- 10.1. Market Analysis, Insights and Forecast - by Product Type
- 10.1.1. C60
- 10.1.2. C70
- 10.1.3. C76
- 10.1.4. Other Product Types
- 10.2. Market Analysis, Insights and Forecast - by End-user Industry
- 10.2.1. Electrical and Electronics
- 10.2.2. Medical and Pharmaceuticals
- 10.2.3. Aerospace and Defense
- 10.2.4. Energy
- 10.2.5. Other End-user Industries
- 10.1. Market Analysis, Insights and Forecast - by Product Type
- 11. Middle East and Africa Fullerene Industry Analysis, Insights and Forecast, 2020-2032
- 11.1. Market Analysis, Insights and Forecast - by Product Type
- 11.1.1. C60
- 11.1.2. C70
- 11.1.3. C76
- 11.1.4. Other Product Types
- 11.2. Market Analysis, Insights and Forecast - by End-user Industry
- 11.2.1. Electrical and Electronics
- 11.2.2. Medical and Pharmaceuticals
- 11.2.3. Aerospace and Defense
- 11.2.4. Energy
- 11.2.5. Other End-user Industries
- 11.1. Market Analysis, Insights and Forecast - by Product Type
- 12. Competitive Analysis
- 12.1. Company Profiles
- 12.1.1 NanoMaterials Ltd
- 12.1.1.1. Company Overview
- 12.1.1.2. Products
- 12.1.1.3. Company Financials
- 12.1.1.4. SWOT Analysis
- 12.1.2 IoLiTec - Ionic Liquid Tecgnologies GmbH
- 12.1.2.1. Company Overview
- 12.1.2.2. Products
- 12.1.2.3. Company Financials
- 12.1.2.4. SWOT Analysis
- 12.1.3 Luna Industries Incorporated
- 12.1.3.1. Company Overview
- 12.1.3.2. Products
- 12.1.3.3. Company Financials
- 12.1.3.4. SWOT Analysis
- 12.1.4 Mitsubishi Corporation
- 12.1.4.1. Company Overview
- 12.1.4.2. Products
- 12.1.4.3. Company Financials
- 12.1.4.4. SWOT Analysis
- 12.1.5 Nano-C
- 12.1.5.1. Company Overview
- 12.1.5.2. Products
- 12.1.5.3. Company Financials
- 12.1.5.4. SWOT Analysis
- 12.1.6 Nanotech Industrial Solutions
- 12.1.6.1. Company Overview
- 12.1.6.2. Products
- 12.1.6.3. Company Financials
- 12.1.6.4. SWOT Analysis
- 12.1.7 SES Research Inc
- 12.1.7.1. Company Overview
- 12.1.7.2. Products
- 12.1.7.3. Company Financials
- 12.1.7.4. SWOT Analysis
- 12.1.8 POWDER NANO
- 12.1.8.1. Company Overview
- 12.1.8.2. Products
- 12.1.8.3. Company Financials
- 12.1.8.4. SWOT Analysis
- 12.1.9 Nanografi Nano technology*List Not Exhaustive
- 12.1.9.1. Company Overview
- 12.1.9.2. Products
- 12.1.9.3. Company Financials
- 12.1.9.4. SWOT Analysis
- 12.1.1 NanoMaterials Ltd
- 12.2. Market Entropy
- 12.2.1 Company's Key Areas Served
- 12.2.2 Recent Developments
- 12.3. Company Market Share Analysis 2025
- 12.3.1 Top 5 Companies Market Share Analysis
- 12.3.2 Top 3 Companies Market Share Analysis
- 12.4. List of Potential Customers
- 13. Research Methodology
List of Figures
- Figure 1: Global Fullerene Industry Revenue Breakdown (Million, %) by Region 2025 & 2033
- Figure 2: Global Fullerene Industry Volume Breakdown (Million, %) by Region 2025 & 2033
- Figure 3: Asia Pacific Fullerene Industry Revenue (Million), by Product Type 2025 & 2033
- Figure 4: Asia Pacific Fullerene Industry Volume (Million), by Product Type 2025 & 2033
- Figure 5: Asia Pacific Fullerene Industry Revenue Share (%), by Product Type 2025 & 2033
- Figure 6: Asia Pacific Fullerene Industry Volume Share (%), by Product Type 2025 & 2033
- Figure 7: Asia Pacific Fullerene Industry Revenue (Million), by End-user Industry 2025 & 2033
- Figure 8: Asia Pacific Fullerene Industry Volume (Million), by End-user Industry 2025 & 2033
- Figure 9: Asia Pacific Fullerene Industry Revenue Share (%), by End-user Industry 2025 & 2033
- Figure 10: Asia Pacific Fullerene Industry Volume Share (%), by End-user Industry 2025 & 2033
- Figure 11: Asia Pacific Fullerene Industry Revenue (Million), by Country 2025 & 2033
- Figure 12: Asia Pacific Fullerene Industry Volume (Million), by Country 2025 & 2033
- Figure 13: Asia Pacific Fullerene Industry Revenue Share (%), by Country 2025 & 2033
- Figure 14: Asia Pacific Fullerene Industry Volume Share (%), by Country 2025 & 2033
- Figure 15: North America Fullerene Industry Revenue (Million), by Product Type 2025 & 2033
- Figure 16: North America Fullerene Industry Volume (Million), by Product Type 2025 & 2033
- Figure 17: North America Fullerene Industry Revenue Share (%), by Product Type 2025 & 2033
- Figure 18: North America Fullerene Industry Volume Share (%), by Product Type 2025 & 2033
- Figure 19: North America Fullerene Industry Revenue (Million), by End-user Industry 2025 & 2033
- Figure 20: North America Fullerene Industry Volume (Million), by End-user Industry 2025 & 2033
- Figure 21: North America Fullerene Industry Revenue Share (%), by End-user Industry 2025 & 2033
- Figure 22: North America Fullerene Industry Volume Share (%), by End-user Industry 2025 & 2033
- Figure 23: North America Fullerene Industry Revenue (Million), by Country 2025 & 2033
- Figure 24: North America Fullerene Industry Volume (Million), by Country 2025 & 2033
- Figure 25: North America Fullerene Industry Revenue Share (%), by Country 2025 & 2033
- Figure 26: North America Fullerene Industry Volume Share (%), by Country 2025 & 2033
- Figure 27: Europe Fullerene Industry Revenue (Million), by Product Type 2025 & 2033
- Figure 28: Europe Fullerene Industry Volume (Million), by Product Type 2025 & 2033
- Figure 29: Europe Fullerene Industry Revenue Share (%), by Product Type 2025 & 2033
- Figure 30: Europe Fullerene Industry Volume Share (%), by Product Type 2025 & 2033
- Figure 31: Europe Fullerene Industry Revenue (Million), by End-user Industry 2025 & 2033
- Figure 32: Europe Fullerene Industry Volume (Million), by End-user Industry 2025 & 2033
- Figure 33: Europe Fullerene Industry Revenue Share (%), by End-user Industry 2025 & 2033
- Figure 34: Europe Fullerene Industry Volume Share (%), by End-user Industry 2025 & 2033
- Figure 35: Europe Fullerene Industry Revenue (Million), by Country 2025 & 2033
- Figure 36: Europe Fullerene Industry Volume (Million), by Country 2025 & 2033
- Figure 37: Europe Fullerene Industry Revenue Share (%), by Country 2025 & 2033
- Figure 38: Europe Fullerene Industry Volume Share (%), by Country 2025 & 2033
- Figure 39: South America Fullerene Industry Revenue (Million), by Product Type 2025 & 2033
- Figure 40: South America Fullerene Industry Volume (Million), by Product Type 2025 & 2033
- Figure 41: South America Fullerene Industry Revenue Share (%), by Product Type 2025 & 2033
- Figure 42: South America Fullerene Industry Volume Share (%), by Product Type 2025 & 2033
- Figure 43: South America Fullerene Industry Revenue (Million), by End-user Industry 2025 & 2033
- Figure 44: South America Fullerene Industry Volume (Million), by End-user Industry 2025 & 2033
- Figure 45: South America Fullerene Industry Revenue Share (%), by End-user Industry 2025 & 2033
- Figure 46: South America Fullerene Industry Volume Share (%), by End-user Industry 2025 & 2033
- Figure 47: South America Fullerene Industry Revenue (Million), by Country 2025 & 2033
- Figure 48: South America Fullerene Industry Volume (Million), by Country 2025 & 2033
- Figure 49: South America Fullerene Industry Revenue Share (%), by Country 2025 & 2033
- Figure 50: South America Fullerene Industry Volume Share (%), by Country 2025 & 2033
- Figure 51: Middle East and Africa Fullerene Industry Revenue (Million), by Product Type 2025 & 2033
- Figure 52: Middle East and Africa Fullerene Industry Volume (Million), by Product Type 2025 & 2033
- Figure 53: Middle East and Africa Fullerene Industry Revenue Share (%), by Product Type 2025 & 2033
- Figure 54: Middle East and Africa Fullerene Industry Volume Share (%), by Product Type 2025 & 2033
- Figure 55: Middle East and Africa Fullerene Industry Revenue (Million), by End-user Industry 2025 & 2033
- Figure 56: Middle East and Africa Fullerene Industry Volume (Million), by End-user Industry 2025 & 2033
- Figure 57: Middle East and Africa Fullerene Industry Revenue Share (%), by End-user Industry 2025 & 2033
- Figure 58: Middle East and Africa Fullerene Industry Volume Share (%), by End-user Industry 2025 & 2033
- Figure 59: Middle East and Africa Fullerene Industry Revenue (Million), by Country 2025 & 2033
- Figure 60: Middle East and Africa Fullerene Industry Volume (Million), by Country 2025 & 2033
- Figure 61: Middle East and Africa Fullerene Industry Revenue Share (%), by Country 2025 & 2033
- Figure 62: Middle East and Africa Fullerene Industry Volume Share (%), by Country 2025 & 2033
List of Tables
- Table 1: Global Fullerene Industry Revenue Million Forecast, by Product Type 2020 & 2033
- Table 2: Global Fullerene Industry Volume Million Forecast, by Product Type 2020 & 2033
- Table 3: Global Fullerene Industry Revenue Million Forecast, by End-user Industry 2020 & 2033
- Table 4: Global Fullerene Industry Volume Million Forecast, by End-user Industry 2020 & 2033
- Table 5: Global Fullerene Industry Revenue Million Forecast, by Region 2020 & 2033
- Table 6: Global Fullerene Industry Volume Million Forecast, by Region 2020 & 2033
- Table 7: Global Fullerene Industry Revenue Million Forecast, by Product Type 2020 & 2033
- Table 8: Global Fullerene Industry Volume Million Forecast, by Product Type 2020 & 2033
- Table 9: Global Fullerene Industry Revenue Million Forecast, by End-user Industry 2020 & 2033
- Table 10: Global Fullerene Industry Volume Million Forecast, by End-user Industry 2020 & 2033
- Table 11: Global Fullerene Industry Revenue Million Forecast, by Country 2020 & 2033
- Table 12: Global Fullerene Industry Volume Million Forecast, by Country 2020 & 2033
- Table 13: China Fullerene Industry Revenue (Million) Forecast, by Application 2020 & 2033
- Table 14: China Fullerene Industry Volume (Million) Forecast, by Application 2020 & 2033
- Table 15: India Fullerene Industry Revenue (Million) Forecast, by Application 2020 & 2033
- Table 16: India Fullerene Industry Volume (Million) Forecast, by Application 2020 & 2033
- Table 17: Japan Fullerene Industry Revenue (Million) Forecast, by Application 2020 & 2033
- Table 18: Japan Fullerene Industry Volume (Million) Forecast, by Application 2020 & 2033
- Table 19: South Korea Fullerene Industry Revenue (Million) Forecast, by Application 2020 & 2033
- Table 20: South Korea Fullerene Industry Volume (Million) Forecast, by Application 2020 & 2033
- Table 21: ASEAN Countries Fullerene Industry Revenue (Million) Forecast, by Application 2020 & 2033
- Table 22: ASEAN Countries Fullerene Industry Volume (Million) Forecast, by Application 2020 & 2033
- Table 23: Rest of Asia Pacific Fullerene Industry Revenue (Million) Forecast, by Application 2020 & 2033
- Table 24: Rest of Asia Pacific Fullerene Industry Volume (Million) Forecast, by Application 2020 & 2033
- Table 25: Global Fullerene Industry Revenue Million Forecast, by Product Type 2020 & 2033
- Table 26: Global Fullerene Industry Volume Million Forecast, by Product Type 2020 & 2033
- Table 27: Global Fullerene Industry Revenue Million Forecast, by End-user Industry 2020 & 2033
- Table 28: Global Fullerene Industry Volume Million Forecast, by End-user Industry 2020 & 2033
- Table 29: Global Fullerene Industry Revenue Million Forecast, by Country 2020 & 2033
- Table 30: Global Fullerene Industry Volume Million Forecast, by Country 2020 & 2033
- Table 31: United States Fullerene Industry Revenue (Million) Forecast, by Application 2020 & 2033
- Table 32: United States Fullerene Industry Volume (Million) Forecast, by Application 2020 & 2033
- Table 33: Canada Fullerene Industry Revenue (Million) Forecast, by Application 2020 & 2033
- Table 34: Canada Fullerene Industry Volume (Million) Forecast, by Application 2020 & 2033
- Table 35: Mexico Fullerene Industry Revenue (Million) Forecast, by Application 2020 & 2033
- Table 36: Mexico Fullerene Industry Volume (Million) Forecast, by Application 2020 & 2033
- Table 37: Global Fullerene Industry Revenue Million Forecast, by Product Type 2020 & 2033
- Table 38: Global Fullerene Industry Volume Million Forecast, by Product Type 2020 & 2033
- Table 39: Global Fullerene Industry Revenue Million Forecast, by End-user Industry 2020 & 2033
- Table 40: Global Fullerene Industry Volume Million Forecast, by End-user Industry 2020 & 2033
- Table 41: Global Fullerene Industry Revenue Million Forecast, by Country 2020 & 2033
- Table 42: Global Fullerene Industry Volume Million Forecast, by Country 2020 & 2033
- Table 43: Germany Fullerene Industry Revenue (Million) Forecast, by Application 2020 & 2033
- Table 44: Germany Fullerene Industry Volume (Million) Forecast, by Application 2020 & 2033
- Table 45: United Kingdom Fullerene Industry Revenue (Million) Forecast, by Application 2020 & 2033
- Table 46: United Kingdom Fullerene Industry Volume (Million) Forecast, by Application 2020 & 2033
- Table 47: France Fullerene Industry Revenue (Million) Forecast, by Application 2020 & 2033
- Table 48: France Fullerene Industry Volume (Million) Forecast, by Application 2020 & 2033
- Table 49: Italy Fullerene Industry Revenue (Million) Forecast, by Application 2020 & 2033
- Table 50: Italy Fullerene Industry Volume (Million) Forecast, by Application 2020 & 2033
- Table 51: Rest of Europe Fullerene Industry Revenue (Million) Forecast, by Application 2020 & 2033
- Table 52: Rest of Europe Fullerene Industry Volume (Million) Forecast, by Application 2020 & 2033
- Table 53: Global Fullerene Industry Revenue Million Forecast, by Product Type 2020 & 2033
- Table 54: Global Fullerene Industry Volume Million Forecast, by Product Type 2020 & 2033
- Table 55: Global Fullerene Industry Revenue Million Forecast, by End-user Industry 2020 & 2033
- Table 56: Global Fullerene Industry Volume Million Forecast, by End-user Industry 2020 & 2033
- Table 57: Global Fullerene Industry Revenue Million Forecast, by Country 2020 & 2033
- Table 58: Global Fullerene Industry Volume Million Forecast, by Country 2020 & 2033
- Table 59: Brazil Fullerene Industry Revenue (Million) Forecast, by Application 2020 & 2033
- Table 60: Brazil Fullerene Industry Volume (Million) Forecast, by Application 2020 & 2033
- Table 61: Argentina Fullerene Industry Revenue (Million) Forecast, by Application 2020 & 2033
- Table 62: Argentina Fullerene Industry Volume (Million) Forecast, by Application 2020 & 2033
- Table 63: Rest of South America Fullerene Industry Revenue (Million) Forecast, by Application 2020 & 2033
- Table 64: Rest of South America Fullerene Industry Volume (Million) Forecast, by Application 2020 & 2033
- Table 65: Global Fullerene Industry Revenue Million Forecast, by Product Type 2020 & 2033
- Table 66: Global Fullerene Industry Volume Million Forecast, by Product Type 2020 & 2033
- Table 67: Global Fullerene Industry Revenue Million Forecast, by End-user Industry 2020 & 2033
- Table 68: Global Fullerene Industry Volume Million Forecast, by End-user Industry 2020 & 2033
- Table 69: Global Fullerene Industry Revenue Million Forecast, by Country 2020 & 2033
- Table 70: Global Fullerene Industry Volume Million Forecast, by Country 2020 & 2033
- Table 71: Saudi Arabia Fullerene Industry Revenue (Million) Forecast, by Application 2020 & 2033
- Table 72: Saudi Arabia Fullerene Industry Volume (Million) Forecast, by Application 2020 & 2033
- Table 73: South Africa Fullerene Industry Revenue (Million) Forecast, by Application 2020 & 2033
- Table 74: South Africa Fullerene Industry Volume (Million) Forecast, by Application 2020 & 2033
- Table 75: Rest of Middle East and Africa Fullerene Industry Revenue (Million) Forecast, by Application 2020 & 2033
- Table 76: Rest of Middle East and Africa Fullerene Industry Volume (Million) Forecast, by Application 2020 & 2033
Frequently Asked Questions
1. What is the projected Compound Annual Growth Rate (CAGR) of the Fullerene Industry?
The projected CAGR is approximately 8.97%.
2. Which companies are prominent players in the Fullerene Industry?
Key companies in the market include NanoMaterials Ltd, IoLiTec - Ionic Liquid Tecgnologies GmbH, Luna Industries Incorporated, Mitsubishi Corporation, Nano-C, Nanotech Industrial Solutions, SES Research Inc, POWDER NANO, Nanografi Nano technology*List Not Exhaustive.
3. What are the main segments of the Fullerene Industry?
The market segments include Product Type, End-user Industry.
4. Can you provide details about the market size?
The market size is estimated to be USD 546.35 Million as of 2022.
5. What are some drivers contributing to market growth?
Increased usage in the Pharmaceutical Industry; Penetration in Surface Coatings Industry due to Strong Metal Matrix; Growing Demand of Fullerene as an Optical Limiter; Other Drivers.
6. What are the notable trends driving market growth?
Increasing Demand from Medical and Pharmaceutical Industry..
7. Are there any restraints impacting market growth?
Increased usage in the Pharmaceutical Industry; Penetration in Surface Coatings Industry due to Strong Metal Matrix; Growing Demand of Fullerene as an Optical Limiter; Other Drivers.
8. Can you provide examples of recent developments in the market?
Recent developments pertaining to the market studied will be covered in the complete report.
9. What pricing options are available for accessing the report?
Pricing options include single-user, multi-user, and enterprise licenses priced at USD 4750, USD 5250, and USD 8750 respectively.
10. Is the market size provided in terms of value or volume?
The market size is provided in terms of value, measured in Million and volume, measured in Million.
11. Are there any specific market keywords associated with the report?
Yes, the market keyword associated with the report is "Fullerene Industry," which aids in identifying and referencing the specific market segment covered.
12. How do I determine which pricing option suits my needs best?
The pricing options vary based on user requirements and access needs. Individual users may opt for single-user licenses, while businesses requiring broader access may choose multi-user or enterprise licenses for cost-effective access to the report.
13. Are there any additional resources or data provided in the Fullerene Industry report?
While the report offers comprehensive insights, it's advisable to review the specific contents or supplementary materials provided to ascertain if additional resources or data are available.
14. How can I stay updated on further developments or reports in the Fullerene Industry?
To stay informed about further developments, trends, and reports in the Fullerene Industry, consider subscribing to industry newsletters, following relevant companies and organizations, or regularly checking reputable industry news sources and publications.
Methodology
Step 1 - Identification of Relevant Samples Size from Population Database


Step 2 - Approaches for Defining Global Market Size (Value, Volume* & Price*)

Note*: In applicable scenarios
Step 3 - Data Sources
Primary Research
- Web Analytics
- Survey Reports
- Research Institute
- Latest Research Reports
- Opinion Leaders
Secondary Research
- Annual Reports
- White Paper
- Latest Press Release
- Industry Association
- Paid Database
- Investor Presentations

Step 4 - Data Triangulation
Involves using different sources of information in order to increase the validity of a study
These sources are likely to be stakeholders in a program - participants, other researchers, program staff, other community members, and so on.
Then we put all data in single framework & apply various statistical tools to find out the dynamic on the market.
During the analysis stage, feedback from the stakeholder groups would be compared to determine areas of agreement as well as areas of divergence