

Key Insights
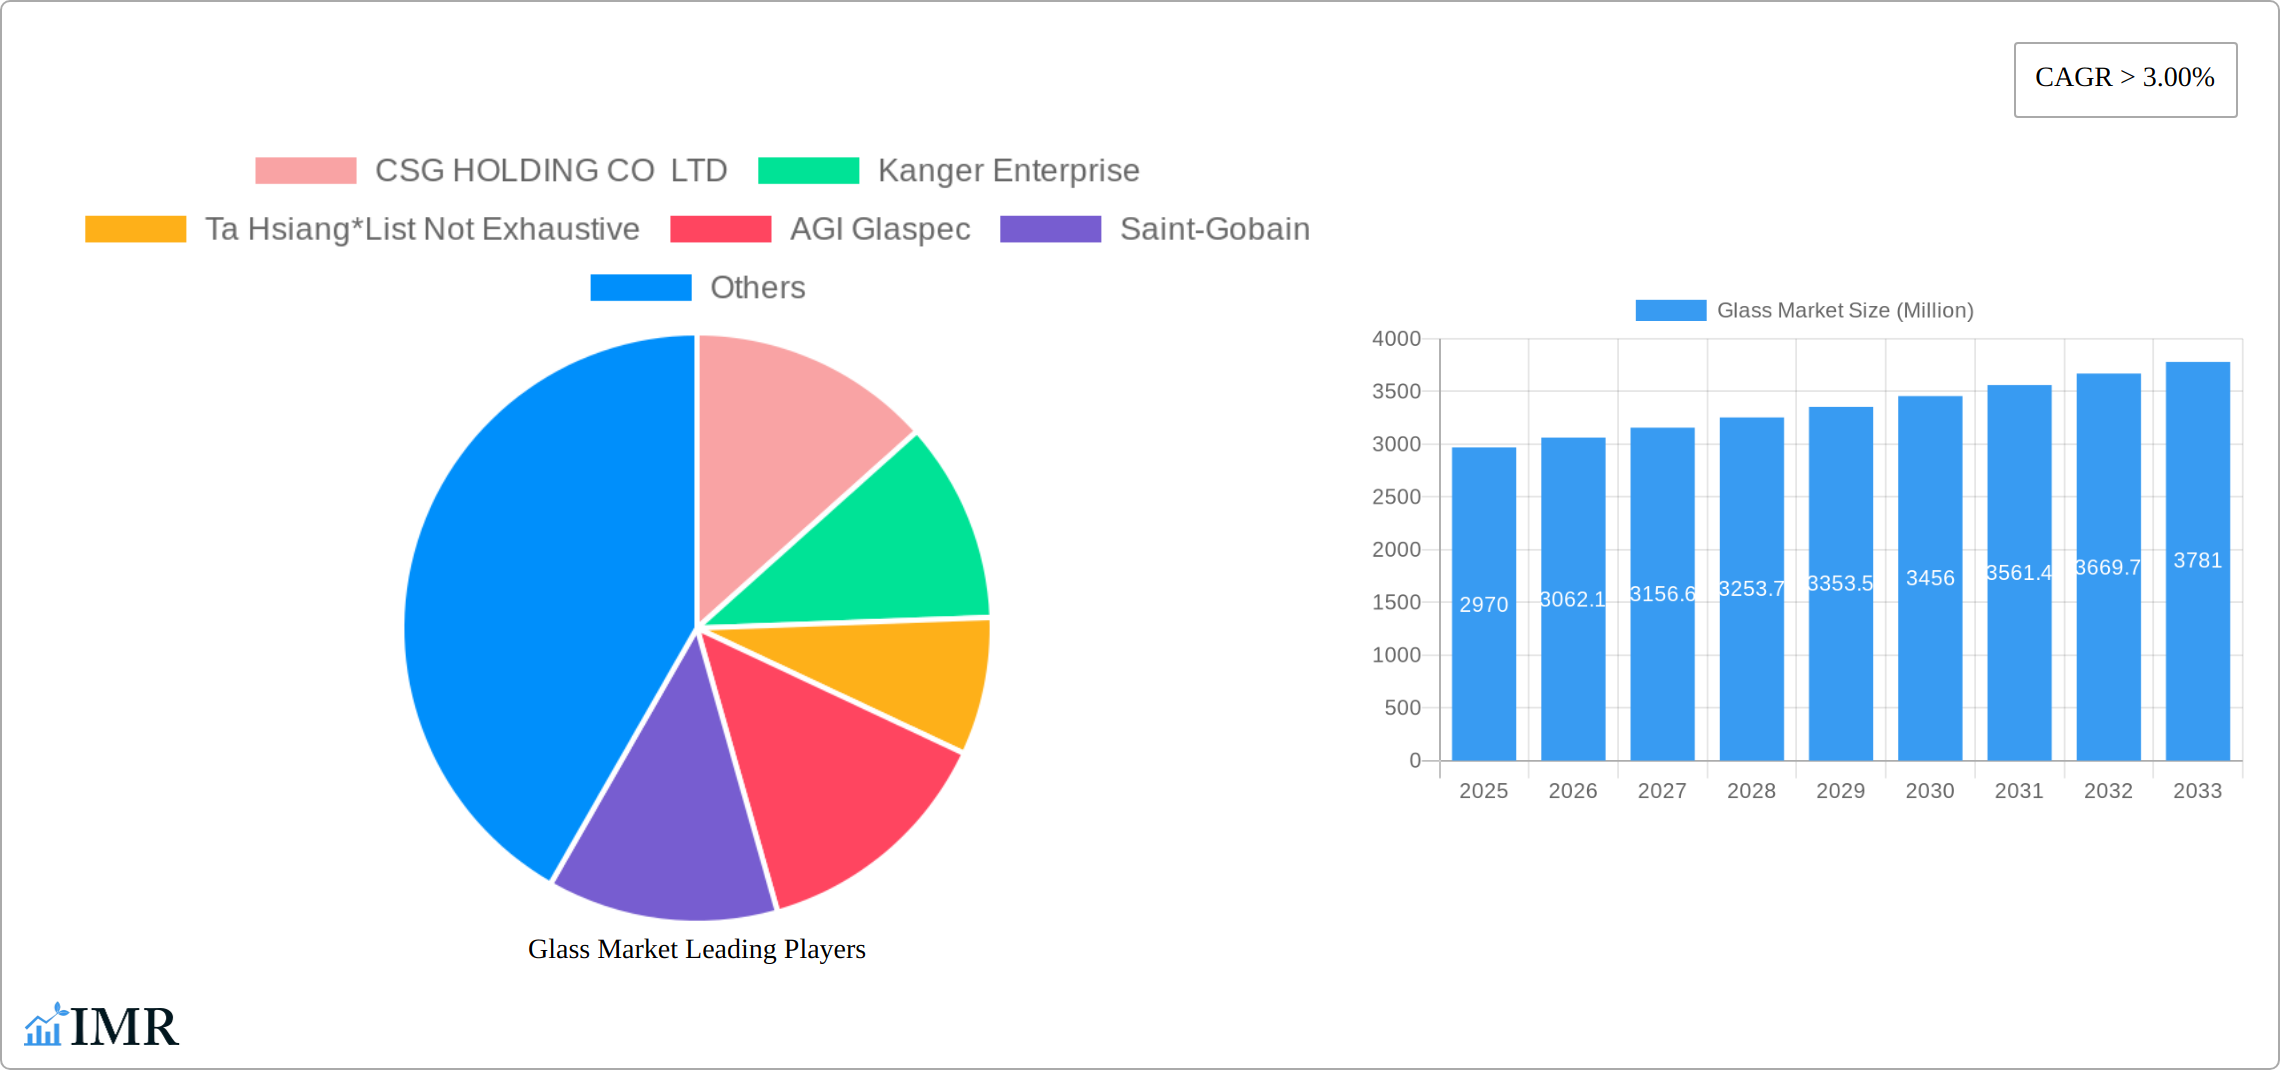
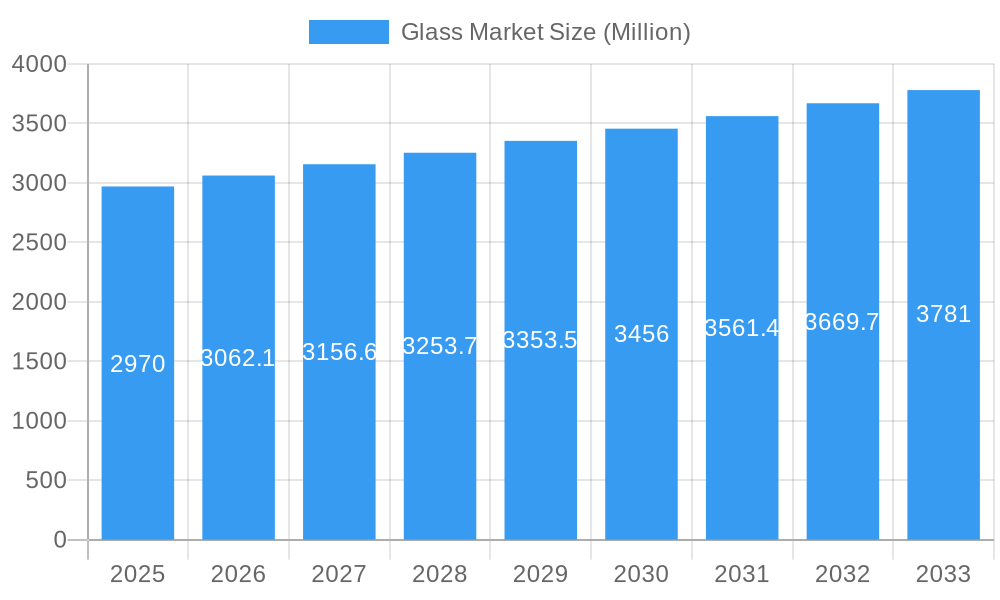
The global glass market, valued at $2.97 billion in 2025, is projected to experience robust growth, exceeding a 3.00% CAGR from 2025 to 2033. This expansion is driven by several key factors. The increasing demand for energy-efficient building materials is fueling growth in the architectural glass segment, particularly for insulated and low-E glass. Simultaneously, the burgeoning electronics industry, with its reliance on display screens and telecommunication components, significantly contributes to the market's expansion. Advancements in glass technology, such as the development of stronger, lighter, and more specialized glass types for applications like ophthalmic lenses and medical equipment, are also propelling market growth. The rise of renewable energy initiatives further boosts demand, with solar panels and other renewable energy technologies heavily reliant on specialized glass components. Competition among major players like Corning Incorporated, SCHOTT AG, and AGC Inc. is driving innovation and cost-optimization, further shaping market dynamics.
Glass Market Market Size (In Billion)
Geographical distribution shows a significant concentration of market share across North America, Europe, and Asia Pacific. While North America benefits from established infrastructure and a strong construction sector, Europe's focus on sustainable building practices fuels demand for high-performance glass. Asia Pacific, driven by rapid industrialization and urbanization in countries like China and India, represents a significant growth opportunity. The market is segmented by type (borosilicate, soda-lime, and others) and application (lighting, ophthalmic lenses, display screens, and others). While borosilicate and soda-lime glass dominate the market currently, the "other types" segment, encompassing insulated, decorative, and specialized glasses, is expected to exhibit faster growth rates due to increasing technological advancements and niche applications. The forecast period, 2025-2033, indicates a promising outlook for the glass market, with continuous expansion driven by technological innovation and rising demand across diverse sectors.
Glass Market Company Market Share
Glass Market: A Comprehensive Market Report (2019-2033)
This in-depth report provides a comprehensive analysis of the global glass market, encompassing its dynamic structure, growth trends, regional dominance, product landscape, key players, and future outlook. The study period covers 2019-2033, with a base year of 2025 and a forecast period of 2025-2033. The report leverages extensive primary and secondary research to deliver actionable insights for industry professionals, investors, and strategists. Market values are presented in million units.
Glass Market Dynamics & Structure
The global glass market is characterized by a moderately concentrated structure, with a few major players holding significant market share. However, the market also features numerous smaller, specialized firms catering to niche applications. Technological innovation, particularly in areas like energy-efficient glass and advanced coatings, is a major growth driver. Stringent regulatory frameworks concerning environmental impact and safety standards significantly influence manufacturing processes and product design. The market also faces competition from alternative materials like plastics and composites in certain applications. M&A activity has been moderate, with strategic acquisitions aimed at expanding product portfolios and geographical reach.
- Market Concentration: The top 5 players hold approximately xx% of the global market share in 2025.
- Technological Innovation: Focus on energy-efficient glass, self-cleaning coatings, and advanced manufacturing techniques.
- Regulatory Landscape: Stringent environmental regulations and safety standards driving innovation in sustainable glass production.
- Competitive Substitutes: Plastics and composites pose a threat in certain applications.
- M&A Activity: An estimated xx M&A deals were concluded in the glass industry between 2019 and 2024.
- End-User Demographics: Construction, automotive, and electronics are key end-user segments.
Glass Market Growth Trends & Insights
The global glass market is experiencing robust growth, projected to expand significantly from 2025 to 2033. This expansion is fueled by a confluence of factors, including surging demand from key sectors such as construction, automotive, and electronics. Market analysts predict a Compound Annual Growth Rate (CAGR) of xx% during this period. Technological advancements are playing a pivotal role, with the development of lightweight, high-strength, and energy-efficient glass solutions driving market penetration. The increasing focus on sustainability and energy efficiency within the building and automotive sectors is further propelling growth. Consumer preferences are shifting towards aesthetically pleasing, durable, and environmentally friendly glass products. Developing economies, particularly in Asia and Africa, represent significant untapped potential, especially within the construction and renewable energy sectors. A detailed regional and segmental analysis reveals diverse growth trajectories and influential factors. This includes granular data on historical and projected market size, as well as adoption rates across key segments. [Link to detailed report or data visualization]
Dominant Regions, Countries, or Segments in Glass Market
The Asia-Pacific region currently dominates the global glass market, fueled by rapid urbanization, robust infrastructure development, and strong economic growth in major economies like China and India. Within applications, construction and automotive remain leading drivers, closely followed by electronics and renewable energy. Borosilicate glass maintains a significant market share due to its superior chemical resistance and thermal stability, making it ideal for pharmaceutical and laboratory applications. Soda-lime glass, favored for its affordability and versatility, continues to dominate the construction and packaging sectors. The "other types" segment, encompassing insulated glass units (IGUs), decorative glass, and specialty glasses, exhibits substantial growth potential, driven by innovation and the increasing demand for energy-efficient and aesthetically appealing products. This segment is further boosted by the growing adoption of smart glass technologies and customizable glass solutions.
- Key Regional Drivers: Rapid urbanization and industrialization in Asia-Pacific; substantial infrastructure investments in North America and Europe; emerging markets in Latin America and Africa showing promising growth.
- Leading Countries: China, India, United States, Japan, Germany, Brazil, and Mexico are key players, showcasing diverse market dynamics.
- Dominant Segments: Borosilicate glass in high-value applications; Soda-lime glass in mass-market applications; Insulated glass units (IGUs) in high-performance buildings; Specialty glass in niche applications like aerospace and medical devices.
Glass Market Product Landscape
The glass market showcases continuous product innovation, encompassing advancements in glass composition, coatings, and manufacturing processes. New products focus on enhanced strength, thermal insulation, self-cleaning properties, and aesthetic appeal. These innovations drive applications in diverse sectors, ranging from high-performance buildings and advanced electronics to cutting-edge medical equipment. The focus is on developing sustainable and environmentally friendly glass products, meeting evolving regulatory requirements and consumer preferences. This involves reducing energy consumption during manufacturing and creating recyclable or easily disposed-of products.
Key Drivers, Barriers & Challenges in Glass Market
Key Drivers:
- Unwavering demand from construction, automotive, and electronics sectors, driven by population growth and technological advancements.
- Continuous technological innovation resulting in enhanced performance characteristics, including improved strength, durability, and energy efficiency.
- Rising adoption of energy-efficient glass solutions, driven by environmental concerns and government regulations.
- Increased disposable incomes in developing economies, fueling demand for higher-quality building materials and consumer goods.
- Growing adoption of smart glass technologies offering enhanced functionality and control.
Challenges & Restraints:
- Volatility in raw material prices (e.g., silica sand, soda ash), impacting manufacturing costs and profitability.
- Stringent environmental regulations and the need for sustainable manufacturing practices, requiring significant investment in cleaner technologies.
- Competition from alternative materials (plastics, composites), particularly in certain applications.
- Supply chain disruptions, exacerbated by geopolitical factors and global events, potentially impacting production and delivery timelines. The estimated impact of supply chain disruptions on market growth is xx%. Mitigation strategies and diversification of sourcing are crucial.
Emerging Opportunities in Glass Market
- Growing demand for energy-efficient and sustainable glass products.
- Expansion into new applications, such as flexible electronics and solar energy.
- Opportunities in developing economies with rising infrastructure spending.
- Development of innovative glass-based technologies, such as self-healing glass and transparent solar panels.
Growth Accelerators in the Glass Market Industry
Technological breakthroughs in glass manufacturing, including the development of advanced coatings and energy-efficient glass formulations, are key growth catalysts. Strategic partnerships between glass manufacturers and end-users in various industries facilitate innovation and market expansion. The increasing focus on sustainable and environmentally friendly manufacturing processes enhances the market’s long-term growth potential.
Key Players Shaping the Glass Market Market
- CSG HOLDING CO LTD
- Kanger Enterprise
- Ta Hsiang
- AGI Glaspec
- Saint-Gobain
- DWK Life Sciences
- Cardinal Glass Industries Inc
- Fuyao Glass Industry
- Sichuan Shubo (Group) Co Ltd
- Nippon Electric Glass Co Ltd
- AGC Inc
- Gerresheimer AG
- Lino
- Corning Incorporated
- SCHOTT AG
Notable Milestones in Glass Market Sector
- January 2022: AGI Glaspec of India inaugurated its specialty glass division with an investment of USD 4000 million, expanding its presence in the Asia-Pacific region.
In-Depth Glass Market Market Outlook
The glass market is poised for continued growth, driven by technological innovation, expanding applications, and increasing demand from key end-user industries. Strategic partnerships and investments in sustainable manufacturing processes will play a crucial role in shaping the market's future. The market offers significant opportunities for companies focused on developing innovative glass products and solutions that meet the evolving needs of consumers and industries.
Glass Market Segmentation
-
1. Type
- 1.1. Borosilicate Glass
- 1.2. Soda-Lime Glass
- 1.3. Other Ty
-
2. Applications
- 2.1. Lighting
- 2.2. Ophthamalic Lenses
- 2.3. Display Screens
- 2.4. Telecommunication
- 2.5. Architecture
- 2.6. Medical Equipments
- 2.7. Renewable Energy
- 2.8. Other Ap
Glass Market Segmentation By Geography
-
1. Asia Pacific
- 1.1. China
- 1.2. India
- 1.3. Japan
- 1.4. South Korea
- 1.5. Malaysia
- 1.6. Thailand
- 1.7. Indonesia
- 1.8. Vietnam
- 1.9. Rest of Asia Pacific
-
2. North America
- 2.1. United States
- 2.2. Canada
- 2.3. Mexico
-
3. Europe
- 3.1. Germany
- 3.2. United Kingdom
- 3.3. Italy
- 3.4. France
- 3.5. Spain
- 3.6. NORDIC
- 3.7. Turkey
- 3.8. Russia
- 3.9. Rest of Europe
-
4. South America
- 4.1. Brazil
- 4.2. Argentina
- 4.3. Colombia
- 4.4. Rest of South America
-
5. Middle East and Africa
- 5.1. Saudi Arabia
- 5.2. South Africa
- 5.3. Nigeria
- 5.4. Qatar
- 5.5. Egypt
- 5.6. UAE
- 5.7. Rest of Middle East and Africa
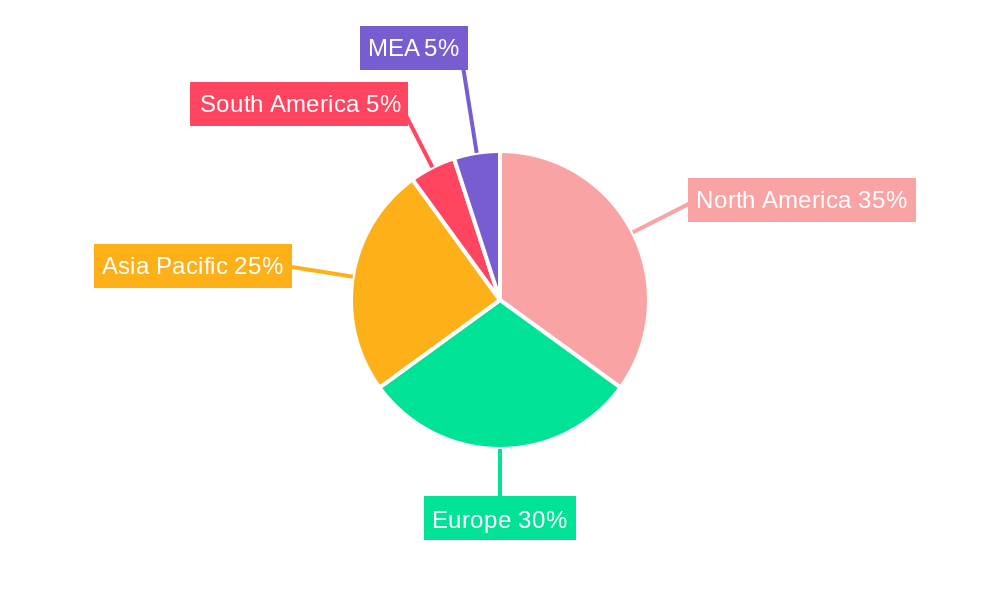
Glass Market Regional Market Share
Geographic Coverage of Glass Market
Glass Market REPORT HIGHLIGHTS
| Aspects | Details |
|---|---|
| Study Period | 2020-2034 |
| Base Year | 2025 |
| Estimated Year | 2026 |
| Forecast Period | 2026-2034 |
| Historical Period | 2020-2025 |
| Growth Rate | CAGR of > 3.00% from 2020-2034 |
| Segmentation |
|
Table of Contents
- 1. Introduction
- 1.1. Research Scope
- 1.2. Market Segmentation
- 1.3. Research Objective
- 1.4. Definitions and Assumptions
- 2. Executive Summary
- 2.1. Market Snapshot
- 3. Market Dynamics
- 3.1. Market Drivers
- 3.2. Market Restrains
- 3.3. Market Trends
- 3.4. Market Opportunities
- 4. Market Factor Analysis
- 4.1. Porters Five Forces
- 4.1.1. Bargaining Power of Suppliers
- 4.1.2. Bargaining Power of Buyers
- 4.1.3. Threat of New Entrants
- 4.1.4. Threat of Substitutes
- 4.1.5. Competitive Rivalry
- 4.2. PESTEL analysis
- 4.3. BCG Analysis
- 4.3.1. Stars (High Growth, High Market Share)
- 4.3.2. Cash Cows (Low Growth, High Market Share)
- 4.3.3. Question Mark (High Growth, Low Market Share)
- 4.3.4. Dogs (Low Growth, Low Market Share)
- 4.4. Ansoff Matrix Analysis
- 4.5. Supply Chain Analysis
- 4.6. Regulatory Landscape
- 4.7. Current Market Potential and Opportunity Assessment (TAM–SAM–SOM Framework)
- 4.8. IMR Analyst Note
- 4.1. Porters Five Forces
- 5. Market Analysis, Insights and Forecast 2021-2033
- 5.1. Market Analysis, Insights and Forecast - by Type
- 5.1.1. Borosilicate Glass
- 5.1.2. Soda-Lime Glass
- 5.1.3. Other Ty
- 5.2. Market Analysis, Insights and Forecast - by Applications
- 5.2.1. Lighting
- 5.2.2. Ophthamalic Lenses
- 5.2.3. Display Screens
- 5.2.4. Telecommunication
- 5.2.5. Architecture
- 5.2.6. Medical Equipments
- 5.2.7. Renewable Energy
- 5.2.8. Other Ap
- 5.3. Market Analysis, Insights and Forecast - by Region
- 5.3.1. Asia Pacific
- 5.3.2. North America
- 5.3.3. Europe
- 5.3.4. South America
- 5.3.5. Middle East and Africa
- 5.1. Market Analysis, Insights and Forecast - by Type
- 6. Global Glass Market Analysis, Insights and Forecast, 2021-2033
- 6.1. Market Analysis, Insights and Forecast - by Type
- 6.1.1. Borosilicate Glass
- 6.1.2. Soda-Lime Glass
- 6.1.3. Other Ty
- 6.2. Market Analysis, Insights and Forecast - by Applications
- 6.2.1. Lighting
- 6.2.2. Ophthamalic Lenses
- 6.2.3. Display Screens
- 6.2.4. Telecommunication
- 6.2.5. Architecture
- 6.2.6. Medical Equipments
- 6.2.7. Renewable Energy
- 6.2.8. Other Ap
- 6.1. Market Analysis, Insights and Forecast - by Type
- 7. Asia Pacific Glass Market Analysis, Insights and Forecast, 2020-2032
- 7.1. Market Analysis, Insights and Forecast - by Type
- 7.1.1. Borosilicate Glass
- 7.1.2. Soda-Lime Glass
- 7.1.3. Other Ty
- 7.2. Market Analysis, Insights and Forecast - by Applications
- 7.2.1. Lighting
- 7.2.2. Ophthamalic Lenses
- 7.2.3. Display Screens
- 7.2.4. Telecommunication
- 7.2.5. Architecture
- 7.2.6. Medical Equipments
- 7.2.7. Renewable Energy
- 7.2.8. Other Ap
- 7.1. Market Analysis, Insights and Forecast - by Type
- 8. North America Glass Market Analysis, Insights and Forecast, 2020-2032
- 8.1. Market Analysis, Insights and Forecast - by Type
- 8.1.1. Borosilicate Glass
- 8.1.2. Soda-Lime Glass
- 8.1.3. Other Ty
- 8.2. Market Analysis, Insights and Forecast - by Applications
- 8.2.1. Lighting
- 8.2.2. Ophthamalic Lenses
- 8.2.3. Display Screens
- 8.2.4. Telecommunication
- 8.2.5. Architecture
- 8.2.6. Medical Equipments
- 8.2.7. Renewable Energy
- 8.2.8. Other Ap
- 8.1. Market Analysis, Insights and Forecast - by Type
- 9. Europe Glass Market Analysis, Insights and Forecast, 2020-2032
- 9.1. Market Analysis, Insights and Forecast - by Type
- 9.1.1. Borosilicate Glass
- 9.1.2. Soda-Lime Glass
- 9.1.3. Other Ty
- 9.2. Market Analysis, Insights and Forecast - by Applications
- 9.2.1. Lighting
- 9.2.2. Ophthamalic Lenses
- 9.2.3. Display Screens
- 9.2.4. Telecommunication
- 9.2.5. Architecture
- 9.2.6. Medical Equipments
- 9.2.7. Renewable Energy
- 9.2.8. Other Ap
- 9.1. Market Analysis, Insights and Forecast - by Type
- 10. South America Glass Market Analysis, Insights and Forecast, 2020-2032
- 10.1. Market Analysis, Insights and Forecast - by Type
- 10.1.1. Borosilicate Glass
- 10.1.2. Soda-Lime Glass
- 10.1.3. Other Ty
- 10.2. Market Analysis, Insights and Forecast - by Applications
- 10.2.1. Lighting
- 10.2.2. Ophthamalic Lenses
- 10.2.3. Display Screens
- 10.2.4. Telecommunication
- 10.2.5. Architecture
- 10.2.6. Medical Equipments
- 10.2.7. Renewable Energy
- 10.2.8. Other Ap
- 10.1. Market Analysis, Insights and Forecast - by Type
- 11. Middle East and Africa Glass Market Analysis, Insights and Forecast, 2020-2032
- 11.1. Market Analysis, Insights and Forecast - by Type
- 11.1.1. Borosilicate Glass
- 11.1.2. Soda-Lime Glass
- 11.1.3. Other Ty
- 11.2. Market Analysis, Insights and Forecast - by Applications
- 11.2.1. Lighting
- 11.2.2. Ophthamalic Lenses
- 11.2.3. Display Screens
- 11.2.4. Telecommunication
- 11.2.5. Architecture
- 11.2.6. Medical Equipments
- 11.2.7. Renewable Energy
- 11.2.8. Other Ap
- 11.1. Market Analysis, Insights and Forecast - by Type
- 12. Competitive Analysis
- 12.1. Company Profiles
- 12.1.1 CSG HOLDING CO LTD
- 12.1.1.1. Company Overview
- 12.1.1.2. Products
- 12.1.1.3. Company Financials
- 12.1.1.4. SWOT Analysis
- 12.1.2 Kanger Enterprise
- 12.1.2.1. Company Overview
- 12.1.2.2. Products
- 12.1.2.3. Company Financials
- 12.1.2.4. SWOT Analysis
- 12.1.3 Ta Hsiang*List Not Exhaustive
- 12.1.3.1. Company Overview
- 12.1.3.2. Products
- 12.1.3.3. Company Financials
- 12.1.3.4. SWOT Analysis
- 12.1.4 AGI Glaspec
- 12.1.4.1. Company Overview
- 12.1.4.2. Products
- 12.1.4.3. Company Financials
- 12.1.4.4. SWOT Analysis
- 12.1.5 Saint-Gobain
- 12.1.5.1. Company Overview
- 12.1.5.2. Products
- 12.1.5.3. Company Financials
- 12.1.5.4. SWOT Analysis
- 12.1.6 DWK Life Sciences
- 12.1.6.1. Company Overview
- 12.1.6.2. Products
- 12.1.6.3. Company Financials
- 12.1.6.4. SWOT Analysis
- 12.1.7 Cardinal Glass Industries Inc
- 12.1.7.1. Company Overview
- 12.1.7.2. Products
- 12.1.7.3. Company Financials
- 12.1.7.4. SWOT Analysis
- 12.1.8 Fuyao Glass Industry
- 12.1.8.1. Company Overview
- 12.1.8.2. Products
- 12.1.8.3. Company Financials
- 12.1.8.4. SWOT Analysis
- 12.1.9 Sichuan Shubo (Group) Co Ltd
- 12.1.9.1. Company Overview
- 12.1.9.2. Products
- 12.1.9.3. Company Financials
- 12.1.9.4. SWOT Analysis
- 12.1.10 Nippon Electric Glass Co Ltd
- 12.1.10.1. Company Overview
- 12.1.10.2. Products
- 12.1.10.3. Company Financials
- 12.1.10.4. SWOT Analysis
- 12.1.11 AGC Inc
- 12.1.11.1. Company Overview
- 12.1.11.2. Products
- 12.1.11.3. Company Financials
- 12.1.11.4. SWOT Analysis
- 12.1.12 Gerresheimer AG
- 12.1.12.1. Company Overview
- 12.1.12.2. Products
- 12.1.12.3. Company Financials
- 12.1.12.4. SWOT Analysis
- 12.1.13 Lino
- 12.1.13.1. Company Overview
- 12.1.13.2. Products
- 12.1.13.3. Company Financials
- 12.1.13.4. SWOT Analysis
- 12.1.14 Corning Incorporated
- 12.1.14.1. Company Overview
- 12.1.14.2. Products
- 12.1.14.3. Company Financials
- 12.1.14.4. SWOT Analysis
- 12.1.15 SCHOTT AG
- 12.1.15.1. Company Overview
- 12.1.15.2. Products
- 12.1.15.3. Company Financials
- 12.1.15.4. SWOT Analysis
- 12.1.1 CSG HOLDING CO LTD
- 12.2. Market Entropy
- 12.2.1 Company's Key Areas Served
- 12.2.2 Recent Developments
- 12.3. Company Market Share Analysis 2025
- 12.3.1 Top 5 Companies Market Share Analysis
- 12.3.2 Top 3 Companies Market Share Analysis
- 12.4. List of Potential Customers
- 13. Research Methodology
List of Figures
- Figure 1: Global Glass Market Revenue Breakdown (Million, %) by Region 2025 & 2033
- Figure 2: Asia Pacific Glass Market Revenue (Million), by Type 2025 & 2033
- Figure 3: Asia Pacific Glass Market Revenue Share (%), by Type 2025 & 2033
- Figure 4: Asia Pacific Glass Market Revenue (Million), by Applications 2025 & 2033
- Figure 5: Asia Pacific Glass Market Revenue Share (%), by Applications 2025 & 2033
- Figure 6: Asia Pacific Glass Market Revenue (Million), by Country 2025 & 2033
- Figure 7: Asia Pacific Glass Market Revenue Share (%), by Country 2025 & 2033
- Figure 8: North America Glass Market Revenue (Million), by Type 2025 & 2033
- Figure 9: North America Glass Market Revenue Share (%), by Type 2025 & 2033
- Figure 10: North America Glass Market Revenue (Million), by Applications 2025 & 2033
- Figure 11: North America Glass Market Revenue Share (%), by Applications 2025 & 2033
- Figure 12: North America Glass Market Revenue (Million), by Country 2025 & 2033
- Figure 13: North America Glass Market Revenue Share (%), by Country 2025 & 2033
- Figure 14: Europe Glass Market Revenue (Million), by Type 2025 & 2033
- Figure 15: Europe Glass Market Revenue Share (%), by Type 2025 & 2033
- Figure 16: Europe Glass Market Revenue (Million), by Applications 2025 & 2033
- Figure 17: Europe Glass Market Revenue Share (%), by Applications 2025 & 2033
- Figure 18: Europe Glass Market Revenue (Million), by Country 2025 & 2033
- Figure 19: Europe Glass Market Revenue Share (%), by Country 2025 & 2033
- Figure 20: South America Glass Market Revenue (Million), by Type 2025 & 2033
- Figure 21: South America Glass Market Revenue Share (%), by Type 2025 & 2033
- Figure 22: South America Glass Market Revenue (Million), by Applications 2025 & 2033
- Figure 23: South America Glass Market Revenue Share (%), by Applications 2025 & 2033
- Figure 24: South America Glass Market Revenue (Million), by Country 2025 & 2033
- Figure 25: South America Glass Market Revenue Share (%), by Country 2025 & 2033
- Figure 26: Middle East and Africa Glass Market Revenue (Million), by Type 2025 & 2033
- Figure 27: Middle East and Africa Glass Market Revenue Share (%), by Type 2025 & 2033
- Figure 28: Middle East and Africa Glass Market Revenue (Million), by Applications 2025 & 2033
- Figure 29: Middle East and Africa Glass Market Revenue Share (%), by Applications 2025 & 2033
- Figure 30: Middle East and Africa Glass Market Revenue (Million), by Country 2025 & 2033
- Figure 31: Middle East and Africa Glass Market Revenue Share (%), by Country 2025 & 2033
List of Tables
- Table 1: Global Glass Market Revenue Million Forecast, by Type 2020 & 2033
- Table 2: Global Glass Market Revenue Million Forecast, by Applications 2020 & 2033
- Table 3: Global Glass Market Revenue Million Forecast, by Region 2020 & 2033
- Table 4: Global Glass Market Revenue Million Forecast, by Type 2020 & 2033
- Table 5: Global Glass Market Revenue Million Forecast, by Applications 2020 & 2033
- Table 6: Global Glass Market Revenue Million Forecast, by Country 2020 & 2033
- Table 7: China Glass Market Revenue (Million) Forecast, by Application 2020 & 2033
- Table 8: India Glass Market Revenue (Million) Forecast, by Application 2020 & 2033
- Table 9: Japan Glass Market Revenue (Million) Forecast, by Application 2020 & 2033
- Table 10: South Korea Glass Market Revenue (Million) Forecast, by Application 2020 & 2033
- Table 11: Malaysia Glass Market Revenue (Million) Forecast, by Application 2020 & 2033
- Table 12: Thailand Glass Market Revenue (Million) Forecast, by Application 2020 & 2033
- Table 13: Indonesia Glass Market Revenue (Million) Forecast, by Application 2020 & 2033
- Table 14: Vietnam Glass Market Revenue (Million) Forecast, by Application 2020 & 2033
- Table 15: Rest of Asia Pacific Glass Market Revenue (Million) Forecast, by Application 2020 & 2033
- Table 16: Global Glass Market Revenue Million Forecast, by Type 2020 & 2033
- Table 17: Global Glass Market Revenue Million Forecast, by Applications 2020 & 2033
- Table 18: Global Glass Market Revenue Million Forecast, by Country 2020 & 2033
- Table 19: United States Glass Market Revenue (Million) Forecast, by Application 2020 & 2033
- Table 20: Canada Glass Market Revenue (Million) Forecast, by Application 2020 & 2033
- Table 21: Mexico Glass Market Revenue (Million) Forecast, by Application 2020 & 2033
- Table 22: Global Glass Market Revenue Million Forecast, by Type 2020 & 2033
- Table 23: Global Glass Market Revenue Million Forecast, by Applications 2020 & 2033
- Table 24: Global Glass Market Revenue Million Forecast, by Country 2020 & 2033
- Table 25: Germany Glass Market Revenue (Million) Forecast, by Application 2020 & 2033
- Table 26: United Kingdom Glass Market Revenue (Million) Forecast, by Application 2020 & 2033
- Table 27: Italy Glass Market Revenue (Million) Forecast, by Application 2020 & 2033
- Table 28: France Glass Market Revenue (Million) Forecast, by Application 2020 & 2033
- Table 29: Spain Glass Market Revenue (Million) Forecast, by Application 2020 & 2033
- Table 30: NORDIC Glass Market Revenue (Million) Forecast, by Application 2020 & 2033
- Table 31: Turkey Glass Market Revenue (Million) Forecast, by Application 2020 & 2033
- Table 32: Russia Glass Market Revenue (Million) Forecast, by Application 2020 & 2033
- Table 33: Rest of Europe Glass Market Revenue (Million) Forecast, by Application 2020 & 2033
- Table 34: Global Glass Market Revenue Million Forecast, by Type 2020 & 2033
- Table 35: Global Glass Market Revenue Million Forecast, by Applications 2020 & 2033
- Table 36: Global Glass Market Revenue Million Forecast, by Country 2020 & 2033
- Table 37: Brazil Glass Market Revenue (Million) Forecast, by Application 2020 & 2033
- Table 38: Argentina Glass Market Revenue (Million) Forecast, by Application 2020 & 2033
- Table 39: Colombia Glass Market Revenue (Million) Forecast, by Application 2020 & 2033
- Table 40: Rest of South America Glass Market Revenue (Million) Forecast, by Application 2020 & 2033
- Table 41: Global Glass Market Revenue Million Forecast, by Type 2020 & 2033
- Table 42: Global Glass Market Revenue Million Forecast, by Applications 2020 & 2033
- Table 43: Global Glass Market Revenue Million Forecast, by Country 2020 & 2033
- Table 44: Saudi Arabia Glass Market Revenue (Million) Forecast, by Application 2020 & 2033
- Table 45: South Africa Glass Market Revenue (Million) Forecast, by Application 2020 & 2033
- Table 46: Nigeria Glass Market Revenue (Million) Forecast, by Application 2020 & 2033
- Table 47: Qatar Glass Market Revenue (Million) Forecast, by Application 2020 & 2033
- Table 48: Egypt Glass Market Revenue (Million) Forecast, by Application 2020 & 2033
- Table 49: UAE Glass Market Revenue (Million) Forecast, by Application 2020 & 2033
- Table 50: Rest of Middle East and Africa Glass Market Revenue (Million) Forecast, by Application 2020 & 2033
Frequently Asked Questions
1. What is the projected Compound Annual Growth Rate (CAGR) of the Glass Market?
The projected CAGR is approximately > 3.00%.
2. Which companies are prominent players in the Glass Market?
Key companies in the market include CSG HOLDING CO LTD, Kanger Enterprise, Ta Hsiang*List Not Exhaustive, AGI Glaspec, Saint-Gobain, DWK Life Sciences, Cardinal Glass Industries Inc, Fuyao Glass Industry, Sichuan Shubo (Group) Co Ltd, Nippon Electric Glass Co Ltd, AGC Inc, Gerresheimer AG, Lino, Corning Incorporated, SCHOTT AG.
3. What are the main segments of the Glass Market?
The market segments include Type, Applications.
4. Can you provide details about the market size?
The market size is estimated to be USD 2.97 Million as of 2022.
5. What are some drivers contributing to market growth?
Rising Demand for Solar Glass in the Renewable Energy and Construction Sector; Increasing Developments in Healthcare Sector; Other Drivers.
6. What are the notable trends driving market growth?
Increasing Emphasis on Utilizing Solar Glass Architecture Construction Application.
7. Are there any restraints impacting market growth?
Stringent environmental regulation regarding air and water pollution standards; Other Restraints.
8. Can you provide examples of recent developments in the market?
January 2022: AGI Glasspec of India inaugurated its specialty glass division with an investment of USD 4000 million. The investment will help the company to expand its specialty glass market in the Asia-Pacific region.
9. What pricing options are available for accessing the report?
Pricing options include single-user, multi-user, and enterprise licenses priced at USD 4750, USD 5250, and USD 8750 respectively.
10. Is the market size provided in terms of value or volume?
The market size is provided in terms of value, measured in Million.
11. Are there any specific market keywords associated with the report?
Yes, the market keyword associated with the report is "Glass Market," which aids in identifying and referencing the specific market segment covered.
12. How do I determine which pricing option suits my needs best?
The pricing options vary based on user requirements and access needs. Individual users may opt for single-user licenses, while businesses requiring broader access may choose multi-user or enterprise licenses for cost-effective access to the report.
13. Are there any additional resources or data provided in the Glass Market report?
While the report offers comprehensive insights, it's advisable to review the specific contents or supplementary materials provided to ascertain if additional resources or data are available.
14. How can I stay updated on further developments or reports in the Glass Market?
To stay informed about further developments, trends, and reports in the Glass Market, consider subscribing to industry newsletters, following relevant companies and organizations, or regularly checking reputable industry news sources and publications.
Methodology
Step 1 - Identification of Relevant Samples Size from Population Database


Step 2 - Approaches for Defining Global Market Size (Value, Volume* & Price*)

Note*: In applicable scenarios
Step 3 - Data Sources
Primary Research
- Web Analytics
- Survey Reports
- Research Institute
- Latest Research Reports
- Opinion Leaders
Secondary Research
- Annual Reports
- White Paper
- Latest Press Release
- Industry Association
- Paid Database
- Investor Presentations

Step 4 - Data Triangulation
Involves using different sources of information in order to increase the validity of a study
These sources are likely to be stakeholders in a program - participants, other researchers, program staff, other community members, and so on.
Then we put all data in single framework & apply various statistical tools to find out the dynamic on the market.
During the analysis stage, feedback from the stakeholder groups would be compared to determine areas of agreement as well as areas of divergence