

Key Insights
The Gold Nanorods market is experiencing robust growth, driven by its expanding applications across diverse sectors. The market's Compound Annual Growth Rate (CAGR) exceeding 10% from 2019 to 2024 indicates significant market expansion. This growth is fueled primarily by advancements in nanotechnology, leading to improved material properties and functionalities of gold nanorods, making them increasingly attractive for various applications. The sensing sector, leveraging the unique optical and electrical properties of gold nanorods for highly sensitive detection, is a key driver. Furthermore, the increasing demand for precise diagnostic tools and targeted drug delivery systems in the medical and healthcare sector is significantly boosting market growth. The electronics industry's adoption of gold nanorods for enhanced performance in devices further contributes to market expansion. While the market faces challenges such as the high cost of production and potential toxicity concerns, ongoing research and development initiatives are addressing these limitations, paving the way for wider adoption. The market is segmented geographically, with North America and Asia-Pacific regions anticipated to hold significant market shares due to the presence of key manufacturers and substantial research investments in these regions.
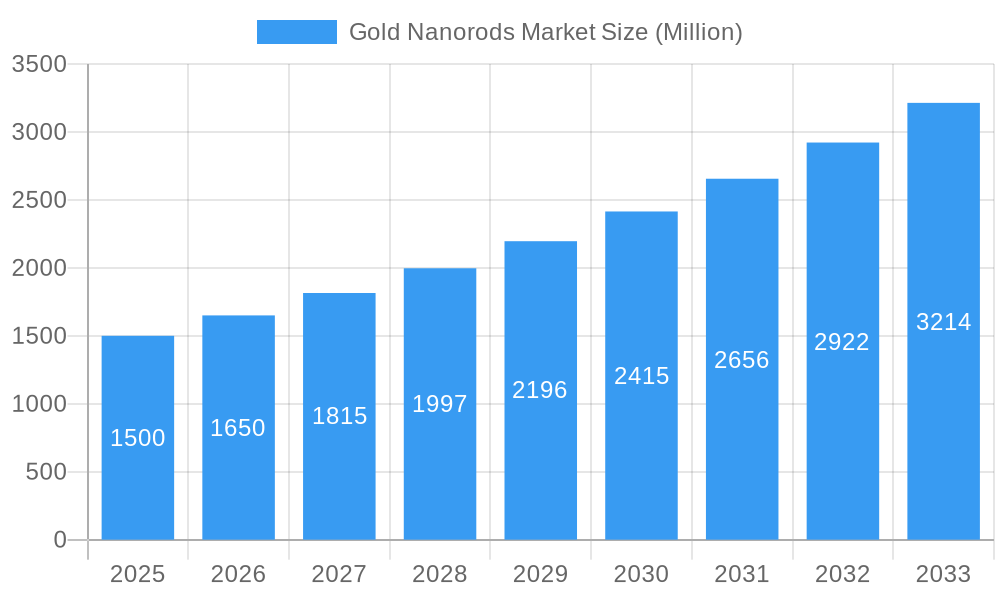
Gold Nanorods Market Market Size (In Billion)
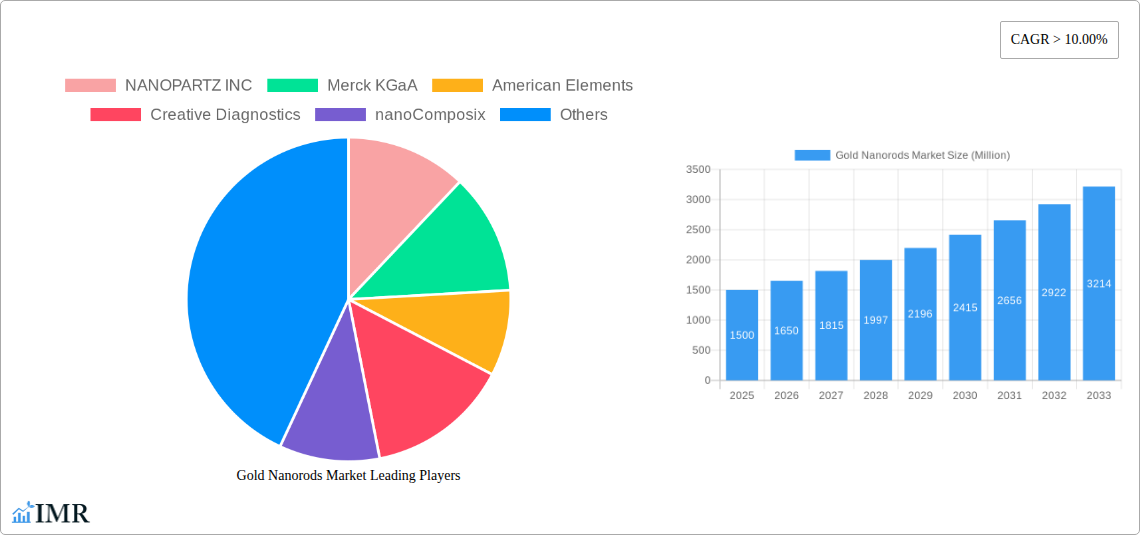
The forecast period of 2025-2033 projects continued expansion of the Gold Nanorods market, with the CAGR projected to remain above 10%. This sustained growth reflects a strong market outlook, driven by the ongoing development of new applications, particularly in areas like biomedical imaging, photothermal therapy, and advanced electronics. The ongoing exploration of gold nanorods' unique properties and their integration into innovative technologies ensure consistent demand across diverse sectors. The competitive landscape involves several key players including NANOPARTZ INC, Merck KGaA, American Elements, and others, fostering market innovation and diversification. Strategies for market penetration and expansion will likely include collaborations, partnerships, and mergers and acquisitions to enhance product portfolios and market reach. Regulatory approvals and safety standards, however, remain important factors influencing market dynamics in the medical and healthcare sectors.
Gold Nanorods Market Company Market Share
Gold Nanorods Market: A Comprehensive Market Report (2019-2033)
This comprehensive report provides an in-depth analysis of the Gold Nanorods Market, encompassing market dynamics, growth trends, regional dominance, product landscape, key players, and future outlook. The report covers the period from 2019 to 2033, with 2025 serving as the base and estimated year. The study meticulously analyzes the parent market of nanomaterials and the child market of gold nanorods, offering a granular understanding of this rapidly evolving sector. Market values are presented in million units.
Gold Nanorods Market Market Dynamics & Structure
This section delves into the intricate structure of the Gold Nanorods Market, analyzing its concentration, innovation drivers, regulatory landscape, competitive substitutes, and end-user demographics. We also examine the impact of mergers and acquisitions (M&A) activities on market dynamics. The market is characterized by a moderately fragmented competitive landscape with several key players vying for market share.
- Market Concentration: The market exhibits moderate concentration, with the top five players holding approximately xx% of the market share in 2025.
- Technological Innovation: Advancements in nanotechnology, particularly in synthesis and functionalization techniques, are major growth drivers. Innovation barriers include the high cost of specialized equipment and skilled labor.
- Regulatory Framework: Stringent regulations regarding the safety and handling of nanomaterials are expected to influence market growth, particularly in the medical and healthcare sectors.
- Competitive Substitutes: Silver nanoparticles and other metallic nanostructures pose competitive threats, offering alternative functionalities at potentially lower costs.
- End-User Demographics: The primary end-users include researchers, manufacturers in the electronics, biomedical, and optics industries, and healthcare providers.
- M&A Trends: The number of M&A deals in the nanomaterials sector has shown a xx% increase from 2021-2024, indicating increased consolidation and strategic partnerships within the industry.
Gold Nanorods Market Growth Trends & Insights
This section offers a detailed examination of Gold Nanorods Market growth trajectories, analyzing market size evolution, adoption rates, technological disruptions, and consumer behavior shifts. The market has witnessed robust growth in recent years, driven by the expanding applications of gold nanorods in various fields.
The global gold nanorods market size was valued at xx million in 2024 and is projected to reach xx million by 2033, exhibiting a CAGR of xx% during the forecast period (2025-2033). This growth is fueled by increasing demand from the medical and healthcare sector for diagnostic and therapeutic applications, coupled with advancements in nanofabrication techniques. Market penetration in emerging economies is also anticipated to increase significantly. Technological advancements such as improved synthesis methods and surface functionalization techniques are further driving market expansion. Shifting consumer preferences towards advanced diagnostic tools and personalized medicine are also contributing to the growing demand for gold nanorods.
Dominant Regions, Countries, or Segments in Gold Nanorods Market
This section pinpoints the leading regions, countries, and segments within the Gold Nanorods Market, focusing on the drivers behind their dominance.
North America holds a significant market share, primarily due to the presence of well-established research institutions and advanced manufacturing capabilities. The strong regulatory environment and high adoption rates in the medical and healthcare sector are further boosting the regional market.
Europe is another key region, driven by significant research and development activities and the presence of major players. Government support for nanotechnology research and development is further bolstering regional growth.
Asia Pacific is projected to witness the fastest growth during the forecast period, fueled by increasing industrialization, growing healthcare spending, and a burgeoning electronics industry.
Segment Dominance: The Medical & Healthcare application segment currently holds the largest market share, driven by the increasing use of gold nanorods in drug delivery, diagnostics, and biosensors. The Electronic Industry segment is also projected to witness significant growth due to their use in advanced electronic devices and components.
Gold Nanorods Market Product Landscape
Gold nanorods are characterized by their unique optical properties, offering tunable plasmon resonance frequencies depending on their aspect ratio. Recent innovations focus on enhancing their biocompatibility and improving their surface functionalization for targeted drug delivery and sensing applications. Advances in synthesis techniques allow for precise control over the size and shape of nanorods, leading to improved performance metrics in various applications. These advancements are reflected in the increasing diversity of products available, catering to the specific requirements of different industries and applications.
Key Drivers, Barriers & Challenges in Gold Nanorods Market
Key Drivers:
- Increasing demand from biomedical applications (diagnostics and therapeutics).
- Advancements in nanofabrication and surface functionalization technologies.
- Growing investments in nanotechnology research and development.
- Expanding electronics and optics industries.
Key Challenges and Restraints:
- High production costs associated with specialized equipment and skilled labor.
- Concerns about the potential toxicity and environmental impact of nanomaterials.
- Stringent regulatory approvals required for medical and healthcare applications.
- Intense competition from substitute materials.
Emerging Opportunities in Gold Nanorods Market
Emerging opportunities include the exploration of novel applications in areas such as personalized medicine, advanced sensing technologies, and improved photothermal therapy. Expanding into untapped markets like developing economies presents significant growth potential. The development of more sustainable and biocompatible gold nanorods is also a key area of focus.
Growth Accelerators in the Gold Nanorods Market Industry
Strategic partnerships between research institutions and industry players are accelerating the development and commercialization of innovative gold nanorod-based products. The continued investment in research and development, coupled with the adoption of advanced manufacturing techniques, is driving long-term market growth.
Key Players Shaping the Gold Nanorods Market Market
Notable Milestones in Gold Nanorods Market Sector
- 2022 Q3: Significant advancements in the synthesis of highly monodisperse gold nanorods with enhanced optical properties reported.
- 2023 Q1: Launch of a new gold nanorod-based diagnostic platform by a major player.
- 2024 Q2: Successful clinical trial results for a gold nanorod-based cancer therapy announced.
In-Depth Gold Nanorods Market Market Outlook
The Gold Nanorods Market is poised for significant growth over the next decade, driven by technological advancements, increased R&D investments, and expanding applications across various industries. Strategic partnerships, coupled with increased market penetration in emerging economies, will further fuel market expansion. Companies focusing on innovation, cost-effectiveness, and regulatory compliance will be best positioned to capitalize on the considerable opportunities within this dynamic sector.
Gold Nanorods Market Segmentation
-
1. Application
- 1.1. Sensing
- 1.2. Medical & Healthcare
- 1.3. Electronic Industry
- 1.4. Optical Applications
- 1.5. Others
Gold Nanorods Market Segmentation By Geography
-
1. Asia Pacific
- 1.1. China
- 1.2. India
- 1.3. Japan
- 1.4. South Korea
- 1.5. Rest of Asia Pacific
-
2. North America
- 2.1. United States
- 2.2. Canada
- 2.3. Mexico
-
3. Europe
- 3.1. Germany
- 3.2. United Kingdom
- 3.3. Italy
- 3.4. France
- 3.5. Rest of Europe
-
4. South America
- 4.1. Brazil
- 4.2. Argentina
- 4.3. Rest of South America
- 5. Middle East
-
6. Saudi Arabia
- 6.1. South Africa
- 6.2. Rest of Middle East
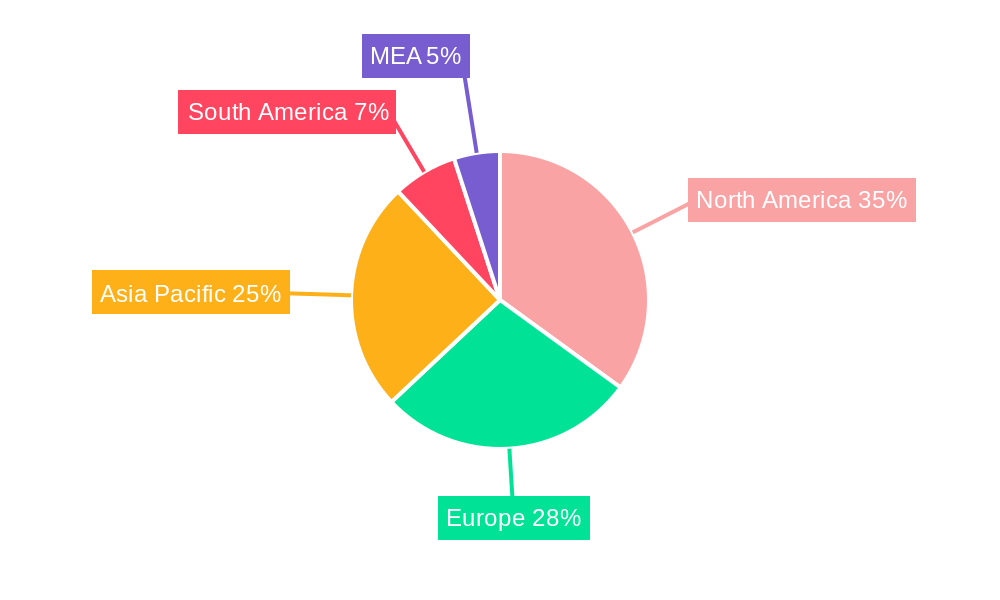
Gold Nanorods Market Regional Market Share
Geographic Coverage of Gold Nanorods Market
Gold Nanorods Market REPORT HIGHLIGHTS
| Aspects | Details |
|---|---|
| Study Period | 2020-2034 |
| Base Year | 2025 |
| Estimated Year | 2026 |
| Forecast Period | 2026-2034 |
| Historical Period | 2020-2025 |
| Growth Rate | CAGR of 11.7% from 2020-2034 |
| Segmentation |
|
Table of Contents
- 1. Introduction
- 1.1. Research Scope
- 1.2. Market Segmentation
- 1.3. Research Objective
- 1.4. Definitions and Assumptions
- 2. Executive Summary
- 2.1. Market Snapshot
- 3. Market Dynamics
- 3.1. Market Drivers
- 3.2. Market Restrains
- 3.3. Market Trends
- 3.4. Market Opportunities
- 4. Market Factor Analysis
- 4.1. Porters Five Forces
- 4.1.1. Bargaining Power of Suppliers
- 4.1.2. Bargaining Power of Buyers
- 4.1.3. Threat of New Entrants
- 4.1.4. Threat of Substitutes
- 4.1.5. Competitive Rivalry
- 4.2. PESTEL analysis
- 4.3. BCG Analysis
- 4.3.1. Stars (High Growth, High Market Share)
- 4.3.2. Cash Cows (Low Growth, High Market Share)
- 4.3.3. Question Mark (High Growth, Low Market Share)
- 4.3.4. Dogs (Low Growth, Low Market Share)
- 4.4. Ansoff Matrix Analysis
- 4.5. Supply Chain Analysis
- 4.6. Regulatory Landscape
- 4.7. Current Market Potential and Opportunity Assessment (TAM–SAM–SOM Framework)
- 4.8. IMR Analyst Note
- 4.1. Porters Five Forces
- 5. Market Analysis, Insights and Forecast 2021-2033
- 5.1. Market Analysis, Insights and Forecast - by Application
- 5.1.1. Sensing
- 5.1.2. Medical & Healthcare
- 5.1.3. Electronic Industry
- 5.1.4. Optical Applications
- 5.1.5. Others
- 5.2. Market Analysis, Insights and Forecast - by Region
- 5.2.1. Asia Pacific
- 5.2.2. North America
- 5.2.3. Europe
- 5.2.4. South America
- 5.2.5. Middle East
- 5.2.6. Saudi Arabia
- 5.1. Market Analysis, Insights and Forecast - by Application
- 6. Global Gold Nanorods Market Analysis, Insights and Forecast, 2021-2033
- 6.1. Market Analysis, Insights and Forecast - by Application
- 6.1.1. Sensing
- 6.1.2. Medical & Healthcare
- 6.1.3. Electronic Industry
- 6.1.4. Optical Applications
- 6.1.5. Others
- 6.1. Market Analysis, Insights and Forecast - by Application
- 7. Asia Pacific Gold Nanorods Market Analysis, Insights and Forecast, 2020-2032
- 7.1. Market Analysis, Insights and Forecast - by Application
- 7.1.1. Sensing
- 7.1.2. Medical & Healthcare
- 7.1.3. Electronic Industry
- 7.1.4. Optical Applications
- 7.1.5. Others
- 7.1. Market Analysis, Insights and Forecast - by Application
- 8. North America Gold Nanorods Market Analysis, Insights and Forecast, 2020-2032
- 8.1. Market Analysis, Insights and Forecast - by Application
- 8.1.1. Sensing
- 8.1.2. Medical & Healthcare
- 8.1.3. Electronic Industry
- 8.1.4. Optical Applications
- 8.1.5. Others
- 8.1. Market Analysis, Insights and Forecast - by Application
- 9. Europe Gold Nanorods Market Analysis, Insights and Forecast, 2020-2032
- 9.1. Market Analysis, Insights and Forecast - by Application
- 9.1.1. Sensing
- 9.1.2. Medical & Healthcare
- 9.1.3. Electronic Industry
- 9.1.4. Optical Applications
- 9.1.5. Others
- 9.1. Market Analysis, Insights and Forecast - by Application
- 10. South America Gold Nanorods Market Analysis, Insights and Forecast, 2020-2032
- 10.1. Market Analysis, Insights and Forecast - by Application
- 10.1.1. Sensing
- 10.1.2. Medical & Healthcare
- 10.1.3. Electronic Industry
- 10.1.4. Optical Applications
- 10.1.5. Others
- 10.1. Market Analysis, Insights and Forecast - by Application
- 11. Middle East Gold Nanorods Market Analysis, Insights and Forecast, 2020-2032
- 11.1. Market Analysis, Insights and Forecast - by Application
- 11.1.1. Sensing
- 11.1.2. Medical & Healthcare
- 11.1.3. Electronic Industry
- 11.1.4. Optical Applications
- 11.1.5. Others
- 11.1. Market Analysis, Insights and Forecast - by Application
- 12. Saudi Arabia Gold Nanorods Market Analysis, Insights and Forecast, 2020-2032
- 12.1. Market Analysis, Insights and Forecast - by Application
- 12.1.1. Sensing
- 12.1.2. Medical & Healthcare
- 12.1.3. Electronic Industry
- 12.1.4. Optical Applications
- 12.1.5. Others
- 12.1. Market Analysis, Insights and Forecast - by Application
- 13. Competitive Analysis
- 13.1. Company Profiles
- 13.1.1 NANOPARTZ INC
- 13.1.1.1. Company Overview
- 13.1.1.2. Products
- 13.1.1.3. Company Financials
- 13.1.1.4. SWOT Analysis
- 13.1.2 Merck KGaA
- 13.1.2.1. Company Overview
- 13.1.2.2. Products
- 13.1.2.3. Company Financials
- 13.1.2.4. SWOT Analysis
- 13.1.3 American Elements
- 13.1.3.1. Company Overview
- 13.1.3.2. Products
- 13.1.3.3. Company Financials
- 13.1.3.4. SWOT Analysis
- 13.1.4 Creative Diagnostics
- 13.1.4.1. Company Overview
- 13.1.4.2. Products
- 13.1.4.3. Company Financials
- 13.1.4.4. SWOT Analysis
- 13.1.5 nanoComposix
- 13.1.5.1. Company Overview
- 13.1.5.2. Products
- 13.1.5.3. Company Financials
- 13.1.5.4. SWOT Analysis
- 13.1.6 Sona Nanotech Inc
- 13.1.6.1. Company Overview
- 13.1.6.2. Products
- 13.1.6.3. Company Financials
- 13.1.6.4. SWOT Analysis
- 13.1.7 Strem Chemicals Inc
- 13.1.7.1. Company Overview
- 13.1.7.2. Products
- 13.1.7.3. Company Financials
- 13.1.7.4. SWOT Analysis
- 13.1.8 Cytodiagnostics Inc
- 13.1.8.1. Company Overview
- 13.1.8.2. Products
- 13.1.8.3. Company Financials
- 13.1.8.4. SWOT Analysis
- 13.1.1 NANOPARTZ INC
- 13.2. Market Entropy
- 13.2.1 Company's Key Areas Served
- 13.2.2 Recent Developments
- 13.3. Company Market Share Analysis 2025
- 13.3.1 Top 5 Companies Market Share Analysis
- 13.3.2 Top 3 Companies Market Share Analysis
- 13.4. List of Potential Customers
- 14. Research Methodology
List of Figures
- Figure 1: Global Gold Nanorods Market Revenue Breakdown (million, %) by Region 2025 & 2033
- Figure 2: Global Gold Nanorods Market Volume Breakdown (K Tons, %) by Region 2025 & 2033
- Figure 3: Asia Pacific Gold Nanorods Market Revenue (million), by Application 2025 & 2033
- Figure 4: Asia Pacific Gold Nanorods Market Volume (K Tons), by Application 2025 & 2033
- Figure 5: Asia Pacific Gold Nanorods Market Revenue Share (%), by Application 2025 & 2033
- Figure 6: Asia Pacific Gold Nanorods Market Volume Share (%), by Application 2025 & 2033
- Figure 7: Asia Pacific Gold Nanorods Market Revenue (million), by Country 2025 & 2033
- Figure 8: Asia Pacific Gold Nanorods Market Volume (K Tons), by Country 2025 & 2033
- Figure 9: Asia Pacific Gold Nanorods Market Revenue Share (%), by Country 2025 & 2033
- Figure 10: Asia Pacific Gold Nanorods Market Volume Share (%), by Country 2025 & 2033
- Figure 11: North America Gold Nanorods Market Revenue (million), by Application 2025 & 2033
- Figure 12: North America Gold Nanorods Market Volume (K Tons), by Application 2025 & 2033
- Figure 13: North America Gold Nanorods Market Revenue Share (%), by Application 2025 & 2033
- Figure 14: North America Gold Nanorods Market Volume Share (%), by Application 2025 & 2033
- Figure 15: North America Gold Nanorods Market Revenue (million), by Country 2025 & 2033
- Figure 16: North America Gold Nanorods Market Volume (K Tons), by Country 2025 & 2033
- Figure 17: North America Gold Nanorods Market Revenue Share (%), by Country 2025 & 2033
- Figure 18: North America Gold Nanorods Market Volume Share (%), by Country 2025 & 2033
- Figure 19: Europe Gold Nanorods Market Revenue (million), by Application 2025 & 2033
- Figure 20: Europe Gold Nanorods Market Volume (K Tons), by Application 2025 & 2033
- Figure 21: Europe Gold Nanorods Market Revenue Share (%), by Application 2025 & 2033
- Figure 22: Europe Gold Nanorods Market Volume Share (%), by Application 2025 & 2033
- Figure 23: Europe Gold Nanorods Market Revenue (million), by Country 2025 & 2033
- Figure 24: Europe Gold Nanorods Market Volume (K Tons), by Country 2025 & 2033
- Figure 25: Europe Gold Nanorods Market Revenue Share (%), by Country 2025 & 2033
- Figure 26: Europe Gold Nanorods Market Volume Share (%), by Country 2025 & 2033
- Figure 27: South America Gold Nanorods Market Revenue (million), by Application 2025 & 2033
- Figure 28: South America Gold Nanorods Market Volume (K Tons), by Application 2025 & 2033
- Figure 29: South America Gold Nanorods Market Revenue Share (%), by Application 2025 & 2033
- Figure 30: South America Gold Nanorods Market Volume Share (%), by Application 2025 & 2033
- Figure 31: South America Gold Nanorods Market Revenue (million), by Country 2025 & 2033
- Figure 32: South America Gold Nanorods Market Volume (K Tons), by Country 2025 & 2033
- Figure 33: South America Gold Nanorods Market Revenue Share (%), by Country 2025 & 2033
- Figure 34: South America Gold Nanorods Market Volume Share (%), by Country 2025 & 2033
- Figure 35: Middle East Gold Nanorods Market Revenue (million), by Application 2025 & 2033
- Figure 36: Middle East Gold Nanorods Market Volume (K Tons), by Application 2025 & 2033
- Figure 37: Middle East Gold Nanorods Market Revenue Share (%), by Application 2025 & 2033
- Figure 38: Middle East Gold Nanorods Market Volume Share (%), by Application 2025 & 2033
- Figure 39: Middle East Gold Nanorods Market Revenue (million), by Country 2025 & 2033
- Figure 40: Middle East Gold Nanorods Market Volume (K Tons), by Country 2025 & 2033
- Figure 41: Middle East Gold Nanorods Market Revenue Share (%), by Country 2025 & 2033
- Figure 42: Middle East Gold Nanorods Market Volume Share (%), by Country 2025 & 2033
- Figure 43: Saudi Arabia Gold Nanorods Market Revenue (million), by Application 2025 & 2033
- Figure 44: Saudi Arabia Gold Nanorods Market Volume (K Tons), by Application 2025 & 2033
- Figure 45: Saudi Arabia Gold Nanorods Market Revenue Share (%), by Application 2025 & 2033
- Figure 46: Saudi Arabia Gold Nanorods Market Volume Share (%), by Application 2025 & 2033
- Figure 47: Saudi Arabia Gold Nanorods Market Revenue (million), by Country 2025 & 2033
- Figure 48: Saudi Arabia Gold Nanorods Market Volume (K Tons), by Country 2025 & 2033
- Figure 49: Saudi Arabia Gold Nanorods Market Revenue Share (%), by Country 2025 & 2033
- Figure 50: Saudi Arabia Gold Nanorods Market Volume Share (%), by Country 2025 & 2033
List of Tables
- Table 1: Global Gold Nanorods Market Revenue million Forecast, by Application 2020 & 2033
- Table 2: Global Gold Nanorods Market Volume K Tons Forecast, by Application 2020 & 2033
- Table 3: Global Gold Nanorods Market Revenue million Forecast, by Region 2020 & 2033
- Table 4: Global Gold Nanorods Market Volume K Tons Forecast, by Region 2020 & 2033
- Table 5: Global Gold Nanorods Market Revenue million Forecast, by Application 2020 & 2033
- Table 6: Global Gold Nanorods Market Volume K Tons Forecast, by Application 2020 & 2033
- Table 7: Global Gold Nanorods Market Revenue million Forecast, by Country 2020 & 2033
- Table 8: Global Gold Nanorods Market Volume K Tons Forecast, by Country 2020 & 2033
- Table 9: China Gold Nanorods Market Revenue (million) Forecast, by Application 2020 & 2033
- Table 10: China Gold Nanorods Market Volume (K Tons) Forecast, by Application 2020 & 2033
- Table 11: India Gold Nanorods Market Revenue (million) Forecast, by Application 2020 & 2033
- Table 12: India Gold Nanorods Market Volume (K Tons) Forecast, by Application 2020 & 2033
- Table 13: Japan Gold Nanorods Market Revenue (million) Forecast, by Application 2020 & 2033
- Table 14: Japan Gold Nanorods Market Volume (K Tons) Forecast, by Application 2020 & 2033
- Table 15: South Korea Gold Nanorods Market Revenue (million) Forecast, by Application 2020 & 2033
- Table 16: South Korea Gold Nanorods Market Volume (K Tons) Forecast, by Application 2020 & 2033
- Table 17: Rest of Asia Pacific Gold Nanorods Market Revenue (million) Forecast, by Application 2020 & 2033
- Table 18: Rest of Asia Pacific Gold Nanorods Market Volume (K Tons) Forecast, by Application 2020 & 2033
- Table 19: Global Gold Nanorods Market Revenue million Forecast, by Application 2020 & 2033
- Table 20: Global Gold Nanorods Market Volume K Tons Forecast, by Application 2020 & 2033
- Table 21: Global Gold Nanorods Market Revenue million Forecast, by Country 2020 & 2033
- Table 22: Global Gold Nanorods Market Volume K Tons Forecast, by Country 2020 & 2033
- Table 23: United States Gold Nanorods Market Revenue (million) Forecast, by Application 2020 & 2033
- Table 24: United States Gold Nanorods Market Volume (K Tons) Forecast, by Application 2020 & 2033
- Table 25: Canada Gold Nanorods Market Revenue (million) Forecast, by Application 2020 & 2033
- Table 26: Canada Gold Nanorods Market Volume (K Tons) Forecast, by Application 2020 & 2033
- Table 27: Mexico Gold Nanorods Market Revenue (million) Forecast, by Application 2020 & 2033
- Table 28: Mexico Gold Nanorods Market Volume (K Tons) Forecast, by Application 2020 & 2033
- Table 29: Global Gold Nanorods Market Revenue million Forecast, by Application 2020 & 2033
- Table 30: Global Gold Nanorods Market Volume K Tons Forecast, by Application 2020 & 2033
- Table 31: Global Gold Nanorods Market Revenue million Forecast, by Country 2020 & 2033
- Table 32: Global Gold Nanorods Market Volume K Tons Forecast, by Country 2020 & 2033
- Table 33: Germany Gold Nanorods Market Revenue (million) Forecast, by Application 2020 & 2033
- Table 34: Germany Gold Nanorods Market Volume (K Tons) Forecast, by Application 2020 & 2033
- Table 35: United Kingdom Gold Nanorods Market Revenue (million) Forecast, by Application 2020 & 2033
- Table 36: United Kingdom Gold Nanorods Market Volume (K Tons) Forecast, by Application 2020 & 2033
- Table 37: Italy Gold Nanorods Market Revenue (million) Forecast, by Application 2020 & 2033
- Table 38: Italy Gold Nanorods Market Volume (K Tons) Forecast, by Application 2020 & 2033
- Table 39: France Gold Nanorods Market Revenue (million) Forecast, by Application 2020 & 2033
- Table 40: France Gold Nanorods Market Volume (K Tons) Forecast, by Application 2020 & 2033
- Table 41: Rest of Europe Gold Nanorods Market Revenue (million) Forecast, by Application 2020 & 2033
- Table 42: Rest of Europe Gold Nanorods Market Volume (K Tons) Forecast, by Application 2020 & 2033
- Table 43: Global Gold Nanorods Market Revenue million Forecast, by Application 2020 & 2033
- Table 44: Global Gold Nanorods Market Volume K Tons Forecast, by Application 2020 & 2033
- Table 45: Global Gold Nanorods Market Revenue million Forecast, by Country 2020 & 2033
- Table 46: Global Gold Nanorods Market Volume K Tons Forecast, by Country 2020 & 2033
- Table 47: Brazil Gold Nanorods Market Revenue (million) Forecast, by Application 2020 & 2033
- Table 48: Brazil Gold Nanorods Market Volume (K Tons) Forecast, by Application 2020 & 2033
- Table 49: Argentina Gold Nanorods Market Revenue (million) Forecast, by Application 2020 & 2033
- Table 50: Argentina Gold Nanorods Market Volume (K Tons) Forecast, by Application 2020 & 2033
- Table 51: Rest of South America Gold Nanorods Market Revenue (million) Forecast, by Application 2020 & 2033
- Table 52: Rest of South America Gold Nanorods Market Volume (K Tons) Forecast, by Application 2020 & 2033
- Table 53: Global Gold Nanorods Market Revenue million Forecast, by Application 2020 & 2033
- Table 54: Global Gold Nanorods Market Volume K Tons Forecast, by Application 2020 & 2033
- Table 55: Global Gold Nanorods Market Revenue million Forecast, by Country 2020 & 2033
- Table 56: Global Gold Nanorods Market Volume K Tons Forecast, by Country 2020 & 2033
- Table 57: Global Gold Nanorods Market Revenue million Forecast, by Application 2020 & 2033
- Table 58: Global Gold Nanorods Market Volume K Tons Forecast, by Application 2020 & 2033
- Table 59: Global Gold Nanorods Market Revenue million Forecast, by Country 2020 & 2033
- Table 60: Global Gold Nanorods Market Volume K Tons Forecast, by Country 2020 & 2033
- Table 61: South Africa Gold Nanorods Market Revenue (million) Forecast, by Application 2020 & 2033
- Table 62: South Africa Gold Nanorods Market Volume (K Tons) Forecast, by Application 2020 & 2033
- Table 63: Rest of Middle East Gold Nanorods Market Revenue (million) Forecast, by Application 2020 & 2033
- Table 64: Rest of Middle East Gold Nanorods Market Volume (K Tons) Forecast, by Application 2020 & 2033
Frequently Asked Questions
1. What is the projected Compound Annual Growth Rate (CAGR) of the Gold Nanorods Market?
The projected CAGR is approximately 11.7%.
2. Which companies are prominent players in the Gold Nanorods Market?
Key companies in the market include NANOPARTZ INC, Merck KGaA, American Elements, Creative Diagnostics, nanoComposix, Sona Nanotech Inc, Strem Chemicals Inc, Cytodiagnostics Inc.
3. What are the main segments of the Gold Nanorods Market?
The market segments include Application.
4. Can you provide details about the market size?
The market size is estimated to be USD 189.6 million as of 2022.
5. What are some drivers contributing to market growth?
; Growing Demand From Medical & Healthcare Sector; Other Drivers.
6. What are the notable trends driving market growth?
Increasing Demand from Medical and Healthcare Sector.
7. Are there any restraints impacting market growth?
; Fluctuations In the Prices of Gold; Other Restraints.
8. Can you provide examples of recent developments in the market?
N/A
9. What pricing options are available for accessing the report?
Pricing options include single-user, multi-user, and enterprise licenses priced at USD 4750, USD 5250, and USD 8750 respectively.
10. Is the market size provided in terms of value or volume?
The market size is provided in terms of value, measured in million and volume, measured in K Tons.
11. Are there any specific market keywords associated with the report?
Yes, the market keyword associated with the report is "Gold Nanorods Market," which aids in identifying and referencing the specific market segment covered.
12. How do I determine which pricing option suits my needs best?
The pricing options vary based on user requirements and access needs. Individual users may opt for single-user licenses, while businesses requiring broader access may choose multi-user or enterprise licenses for cost-effective access to the report.
13. Are there any additional resources or data provided in the Gold Nanorods Market report?
While the report offers comprehensive insights, it's advisable to review the specific contents or supplementary materials provided to ascertain if additional resources or data are available.
14. How can I stay updated on further developments or reports in the Gold Nanorods Market?
To stay informed about further developments, trends, and reports in the Gold Nanorods Market, consider subscribing to industry newsletters, following relevant companies and organizations, or regularly checking reputable industry news sources and publications.
Methodology
Step 1 - Identification of Relevant Samples Size from Population Database


Step 2 - Approaches for Defining Global Market Size (Value, Volume* & Price*)

Note*: In applicable scenarios
Step 3 - Data Sources
Primary Research
- Web Analytics
- Survey Reports
- Research Institute
- Latest Research Reports
- Opinion Leaders
Secondary Research
- Annual Reports
- White Paper
- Latest Press Release
- Industry Association
- Paid Database
- Investor Presentations

Step 4 - Data Triangulation
Involves using different sources of information in order to increase the validity of a study
These sources are likely to be stakeholders in a program - participants, other researchers, program staff, other community members, and so on.
Then we put all data in single framework & apply various statistical tools to find out the dynamic on the market.
During the analysis stage, feedback from the stakeholder groups would be compared to determine areas of agreement as well as areas of divergence