

Key Insights
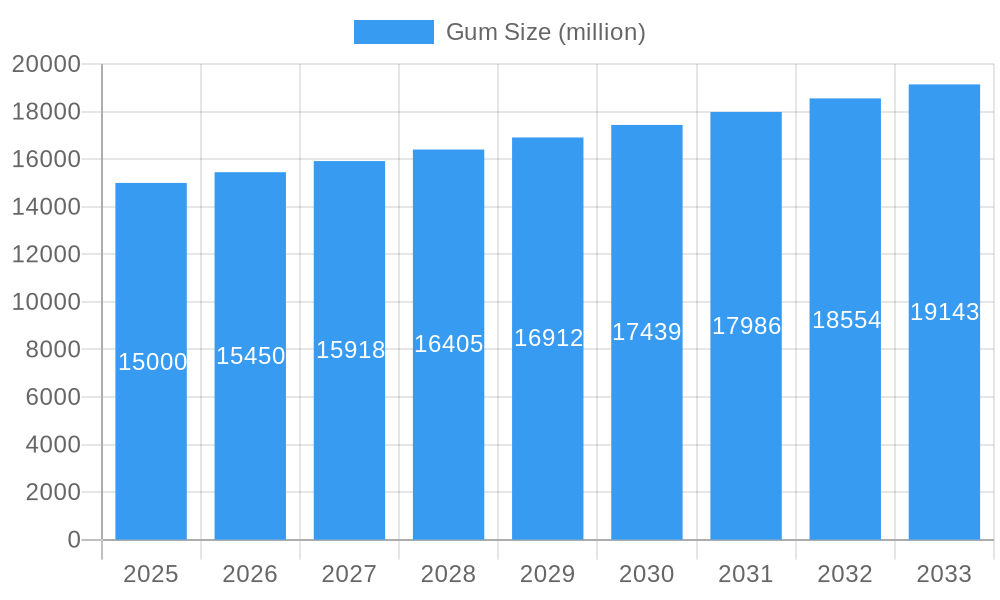
The global chewing gum market, a multi-billion dollar industry, is characterized by steady growth driven by several key factors. Consumer demand for convenient, readily available confectionery products remains robust, particularly among younger demographics. Furthermore, the increasing popularity of sugar-free and functional chewing gums, offering benefits such as dental hygiene improvement and breath freshening, is fueling market expansion. Innovation in flavors, formats (e.g., liquid-filled gums), and packaging also plays a crucial role in attracting and retaining consumers. Major players like Lotte, Meiji Holdings, Mondelez International, Perfetti Van Melle, and Wrigley are actively engaged in product diversification and strategic acquisitions to maintain their market positions and tap into emerging trends. However, increasing health consciousness among consumers, leading to a preference for healthier snack alternatives, poses a challenge. Government regulations on sugar content and artificial sweeteners also present a restraint. The market is segmented by product type (sugar-free, sugar-containing, functional), flavor, distribution channel (retail, online), and region, offering diverse opportunities for growth. We estimate the market size in 2025 to be around $15 billion, based on readily available data of similar confectionery markets and considering its historical growth patterns. A moderate CAGR of 3-4% is projected for the forecast period (2025-2033), indicating a continued, albeit slower, expansion.
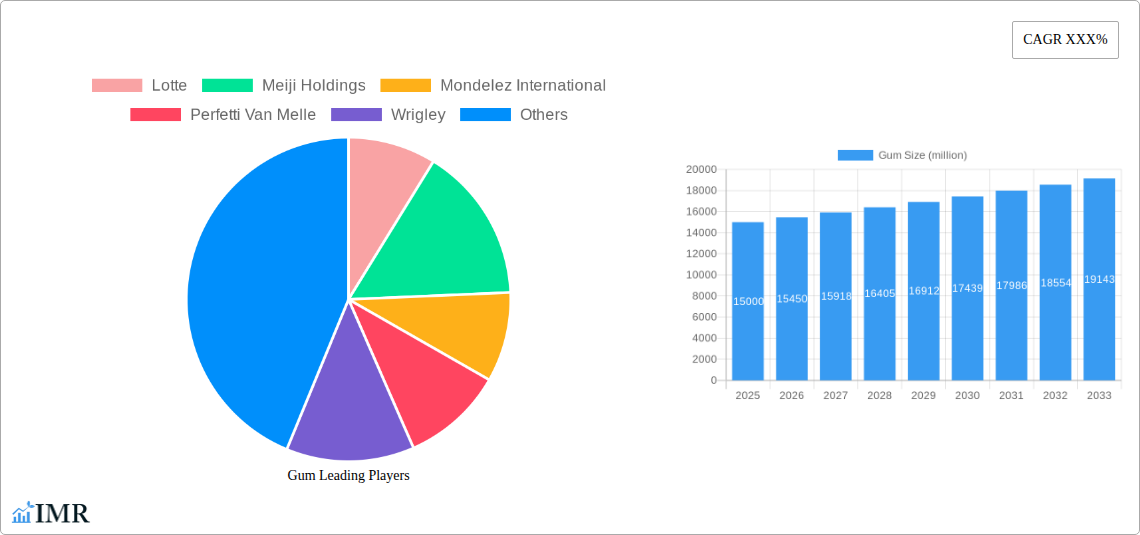
Gum Market Size (In Billion)
Geographic distribution shows varied market penetration. Developed markets in North America and Europe have reached relative maturity, exhibiting a stable, slightly declining growth. Conversely, emerging markets in Asia-Pacific and Latin America are showing significant promise, driven by rising disposable incomes and increasing urbanization. The competitive landscape is characterized by intense rivalry among established players, with continuous efforts to enhance brand awareness, engage in effective marketing campaigns, and establish a strong distribution network. The success of players depends on their ability to adapt to evolving consumer preferences and regulations, innovate with product offerings, and expand their market reach in high-growth regions. Future growth hinges on successful strategies in product differentiation, marketing, and expansion into new markets, complemented by a flexible response to evolving regulatory landscapes.
Gum Company Market Share
Gum Market Report: A Comprehensive Analysis (2019-2033)
This in-depth report provides a comprehensive analysis of the global gum market, offering invaluable insights for industry professionals, investors, and strategic decision-makers. Leveraging extensive market research and data analysis covering the period 2019-2033 (base year 2025, forecast period 2025-2033), this report dissects market dynamics, growth trends, competitive landscape, and future opportunities within the confectionery sector (parent market) and the chewing gum segment (child market). The report features detailed analysis of key players including Lotte, Meiji Holdings, Mondelez International, Perfetti Van Melle, and Wrigley.
Gum Market Dynamics & Structure
This section analyzes the global gum market's structure, identifying key dynamics that shape its trajectory. We delve into market concentration, exploring the market share held by leading players like Wrigley and Mondelez International, and examining the prevalence of mergers and acquisitions (M&A). Technological innovations, such as sugar-free formulations and novel flavor profiles, are assessed for their impact on market growth. Regulatory frameworks concerning sugar content and labeling are also scrutinized, alongside an examination of competitive substitutes (e.g., mints, breath fresheners). Finally, we analyze end-user demographics and their evolving preferences, revealing shifts in consumption patterns and regional variations.
- Market Concentration: Wrigley and Mondelez hold approximately xx% combined market share in 2025, indicating a moderately concentrated market.
- M&A Activity: A total of xx M&A deals were recorded between 2019 and 2024, primarily driven by efforts to expand product portfolios and geographic reach.
- Innovation Barriers: High R&D costs and the challenge of balancing consumer preference for taste with health concerns pose significant innovation barriers.
- Regulatory Landscape: Varying regulations across regions regarding sugar content and marketing to children influence product formulations and marketing strategies.
Gum Growth Trends & Insights
This section provides a comprehensive analysis of the global gum market's growth trajectory from 2019 to 2033. We analyze historical data (2019-2024) to establish baseline growth rates and project future expansion based on various influencing factors. Key performance indicators (KPIs) such as compound annual growth rate (CAGR), market penetration rates, and adoption rates in different regions are presented and analyzed. The impact of technological advancements, such as novel flavor delivery systems and sustainable packaging solutions, on consumer behaviour and adoption are detailed. We also examine the changing preferences of consumers (e.g., rising demand for sugar-free and functional gum) and identify their impact on market segmentation. The report utilizes proprietary data and forecasts to offer a nuanced perspective on market evolution. This analysis pinpoints key factors driving market growth and identifies potential challenges that could impact future expansion. The report provides detailed insights into consumer segments, identifying key trends and drivers shaping demand within various demographics and regions.
- Market Size (2025): xx million units
- CAGR (2025-2033): xx%
- Market Penetration (2025): xx%
Dominant Regions, Countries, or Segments in Gum
This section identifies the key regions, countries, and segments driving the growth of the gum market. We analyze factors contributing to the dominance of these regions through an examination of economic policies, infrastructure development, and consumer preferences. The section features a detailed breakdown of market share and growth potential for each leading region and segment. This includes examining the impact of cultural factors and consumer behavior on market performance. The report meticulously unpacks the reasons for specific regions outperforming others, providing granular data to support its findings.
- Leading Region (2025): North America (xx% market share)
- Key Growth Drivers: Strong consumer demand for functional gum, extensive distribution networks, and high disposable incomes.
- Emerging Markets: Asia-Pacific and Latin America show high growth potential due to rising middle-class populations and increasing urbanization.
Gum Product Landscape
This section details the diverse product offerings within the gum market. We examine product innovations, focusing on unique selling propositions (USPs), including sugar-free options, functional gums with added health benefits, and novel flavor profiles. Technological advancements in gum manufacturing, such as improved flavor encapsulation and sustainable packaging materials, are discussed. Analysis includes a range of products within the market, categorizing by key features, such as sugar content, functional ingredients, and flavor profiles.
Key Drivers, Barriers & Challenges in Gum
This section outlines the key factors driving market growth, including technological advancements, changing consumer preferences, and favorable economic conditions. We examine specific examples, quantifying their influence on the market's expansion. The analysis further identifies challenges, including supply chain disruptions, rising raw material costs, and increased competition. The impacts of these challenges are measured and assessed for their potential to hinder future growth.
- Key Drivers: Innovation in flavors and functionalities, increasing health consciousness, and expanding distribution channels.
- Key Challenges: Fluctuations in raw material prices, stringent regulations on sugar content, and intense competition from substitute products. The impact of these challenges is estimated to reduce market growth by xx% by 2033.
Emerging Opportunities in Gum
This section identifies emerging trends and untapped market opportunities within the gum industry. We highlight evolving consumer preferences, such as a growing demand for sustainable and ethically sourced products. New applications for gum, including integration with oral health technologies and personalized gum formulations, are examined. Emerging markets with high growth potential are also highlighted.
- Untapped Markets: Expansion into developing economies with high population density and increasing disposable incomes presents significant opportunities.
- Product Innovation: Development of functional gums with added vitamins, probiotics, or other health benefits.
Growth Accelerators in the Gum Industry
This section discusses factors driving long-term growth within the gum market. We focus on technological innovations that enable the development of new products and enhance the consumer experience. Strategic partnerships and mergers & acquisitions are discussed as key growth catalysts. Expansion into new geographic markets and diversification of product offerings are also highlighted.
Key Players Shaping the Gum Market
Notable Milestones in Gum Sector
- 2020: Launch of a new sugar-free gum line by Wrigley, featuring innovative flavor technology.
- 2022: Acquisition of a smaller gum manufacturer by Mondelez International, expanding its market share.
- 2023: Introduction of sustainable packaging for gum by Lotte.
In-Depth Gum Market Outlook
The gum market is poised for continued growth driven by several key factors, including the ongoing development of innovative products and flavors, expansion into new geographic markets, and increasing consumer demand for functional gum. The market is anticipated to demonstrate robust growth over the next decade, presenting significant opportunities for established players and new entrants alike. Strategic partnerships and mergers & acquisitions will continue to shape the market landscape, and companies focusing on sustainable and ethical practices will gain a competitive advantage.
Gum Segmentation
-
1. Application
- 1.1. Hypermarkets
- 1.2. Supermarkets
- 1.3. Convenience Stores
- 1.4. Departmental Stores
- 1.5. Specialty Stores
- 1.6. Online Purchases
-
2. Type
- 2.1. Chewing Gum
- 2.2. Bubble Gum
Gum Segmentation By Geography
-
1. North America
- 1.1. United States
- 1.2. Canada
- 1.3. Mexico
-
2. South America
- 2.1. Brazil
- 2.2. Argentina
- 2.3. Rest of South America
-
3. Europe
- 3.1. United Kingdom
- 3.2. Germany
- 3.3. France
- 3.4. Italy
- 3.5. Spain
- 3.6. Russia
- 3.7. Benelux
- 3.8. Nordics
- 3.9. Rest of Europe
-
4. Middle East & Africa
- 4.1. Turkey
- 4.2. Israel
- 4.3. GCC
- 4.4. North Africa
- 4.5. South Africa
- 4.6. Rest of Middle East & Africa
-
5. Asia Pacific
- 5.1. China
- 5.2. India
- 5.3. Japan
- 5.4. South Korea
- 5.5. ASEAN
- 5.6. Oceania
- 5.7. Rest of Asia Pacific
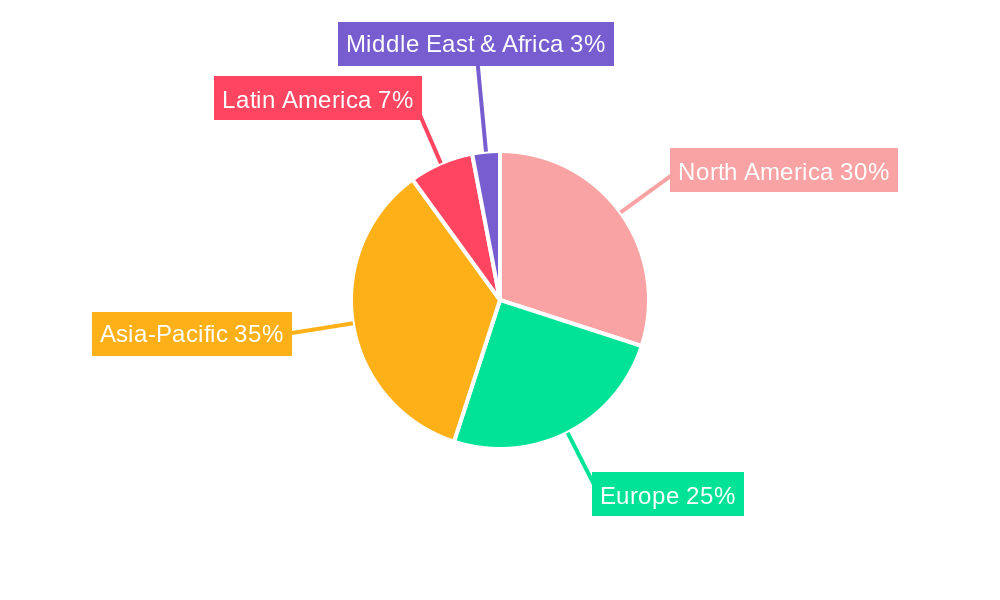
Gum Regional Market Share
Geographic Coverage of Gum
Gum REPORT HIGHLIGHTS
| Aspects | Details |
|---|---|
| Study Period | 2020-2034 |
| Base Year | 2025 |
| Estimated Year | 2026 |
| Forecast Period | 2026-2034 |
| Historical Period | 2020-2025 |
| Growth Rate | CAGR of 4.5% from 2020-2034 |
| Segmentation |
|
Table of Contents
- 1. Introduction
- 1.1. Research Scope
- 1.2. Market Segmentation
- 1.3. Research Objective
- 1.4. Definitions and Assumptions
- 2. Executive Summary
- 2.1. Market Snapshot
- 3. Market Dynamics
- 3.1. Market Drivers
- 3.2. Market Restrains
- 3.3. Market Trends
- 3.4. Market Opportunities
- 4. Market Factor Analysis
- 4.1. Porters Five Forces
- 4.1.1. Bargaining Power of Suppliers
- 4.1.2. Bargaining Power of Buyers
- 4.1.3. Threat of New Entrants
- 4.1.4. Threat of Substitutes
- 4.1.5. Competitive Rivalry
- 4.2. PESTEL analysis
- 4.3. BCG Analysis
- 4.3.1. Stars (High Growth, High Market Share)
- 4.3.2. Cash Cows (Low Growth, High Market Share)
- 4.3.3. Question Mark (High Growth, Low Market Share)
- 4.3.4. Dogs (Low Growth, Low Market Share)
- 4.4. Ansoff Matrix Analysis
- 4.5. Supply Chain Analysis
- 4.6. Regulatory Landscape
- 4.7. Current Market Potential and Opportunity Assessment (TAM–SAM–SOM Framework)
- 4.8. IMR Analyst Note
- 4.1. Porters Five Forces
- 5. Market Analysis, Insights and Forecast 2021-2033
- 5.1. Market Analysis, Insights and Forecast - by Application
- 5.1.1. Hypermarkets
- 5.1.2. Supermarkets
- 5.1.3. Convenience Stores
- 5.1.4. Departmental Stores
- 5.1.5. Specialty Stores
- 5.1.6. Online Purchases
- 5.2. Market Analysis, Insights and Forecast - by Type
- 5.2.1. Chewing Gum
- 5.2.2. Bubble Gum
- 5.3. Market Analysis, Insights and Forecast - by Region
- 5.3.1. North America
- 5.3.2. South America
- 5.3.3. Europe
- 5.3.4. Middle East & Africa
- 5.3.5. Asia Pacific
- 5.1. Market Analysis, Insights and Forecast - by Application
- 6. Global Gum Analysis, Insights and Forecast, 2021-2033
- 6.1. Market Analysis, Insights and Forecast - by Application
- 6.1.1. Hypermarkets
- 6.1.2. Supermarkets
- 6.1.3. Convenience Stores
- 6.1.4. Departmental Stores
- 6.1.5. Specialty Stores
- 6.1.6. Online Purchases
- 6.2. Market Analysis, Insights and Forecast - by Type
- 6.2.1. Chewing Gum
- 6.2.2. Bubble Gum
- 6.1. Market Analysis, Insights and Forecast - by Application
- 7. North America Gum Analysis, Insights and Forecast, 2020-2032
- 7.1. Market Analysis, Insights and Forecast - by Application
- 7.1.1. Hypermarkets
- 7.1.2. Supermarkets
- 7.1.3. Convenience Stores
- 7.1.4. Departmental Stores
- 7.1.5. Specialty Stores
- 7.1.6. Online Purchases
- 7.2. Market Analysis, Insights and Forecast - by Type
- 7.2.1. Chewing Gum
- 7.2.2. Bubble Gum
- 7.1. Market Analysis, Insights and Forecast - by Application
- 8. South America Gum Analysis, Insights and Forecast, 2020-2032
- 8.1. Market Analysis, Insights and Forecast - by Application
- 8.1.1. Hypermarkets
- 8.1.2. Supermarkets
- 8.1.3. Convenience Stores
- 8.1.4. Departmental Stores
- 8.1.5. Specialty Stores
- 8.1.6. Online Purchases
- 8.2. Market Analysis, Insights and Forecast - by Type
- 8.2.1. Chewing Gum
- 8.2.2. Bubble Gum
- 8.1. Market Analysis, Insights and Forecast - by Application
- 9. Europe Gum Analysis, Insights and Forecast, 2020-2032
- 9.1. Market Analysis, Insights and Forecast - by Application
- 9.1.1. Hypermarkets
- 9.1.2. Supermarkets
- 9.1.3. Convenience Stores
- 9.1.4. Departmental Stores
- 9.1.5. Specialty Stores
- 9.1.6. Online Purchases
- 9.2. Market Analysis, Insights and Forecast - by Type
- 9.2.1. Chewing Gum
- 9.2.2. Bubble Gum
- 9.1. Market Analysis, Insights and Forecast - by Application
- 10. Middle East & Africa Gum Analysis, Insights and Forecast, 2020-2032
- 10.1. Market Analysis, Insights and Forecast - by Application
- 10.1.1. Hypermarkets
- 10.1.2. Supermarkets
- 10.1.3. Convenience Stores
- 10.1.4. Departmental Stores
- 10.1.5. Specialty Stores
- 10.1.6. Online Purchases
- 10.2. Market Analysis, Insights and Forecast - by Type
- 10.2.1. Chewing Gum
- 10.2.2. Bubble Gum
- 10.1. Market Analysis, Insights and Forecast - by Application
- 11. Asia Pacific Gum Analysis, Insights and Forecast, 2020-2032
- 11.1. Market Analysis, Insights and Forecast - by Application
- 11.1.1. Hypermarkets
- 11.1.2. Supermarkets
- 11.1.3. Convenience Stores
- 11.1.4. Departmental Stores
- 11.1.5. Specialty Stores
- 11.1.6. Online Purchases
- 11.2. Market Analysis, Insights and Forecast - by Type
- 11.2.1. Chewing Gum
- 11.2.2. Bubble Gum
- 11.1. Market Analysis, Insights and Forecast - by Application
- 12. Competitive Analysis
- 12.1. Company Profiles
- 12.1.1 Lotte
- 12.1.1.1. Company Overview
- 12.1.1.2. Products
- 12.1.1.3. Company Financials
- 12.1.1.4. SWOT Analysis
- 12.1.2 Meiji Holdings
- 12.1.2.1. Company Overview
- 12.1.2.2. Products
- 12.1.2.3. Company Financials
- 12.1.2.4. SWOT Analysis
- 12.1.3 Mondelez International
- 12.1.3.1. Company Overview
- 12.1.3.2. Products
- 12.1.3.3. Company Financials
- 12.1.3.4. SWOT Analysis
- 12.1.4 Perfetti Van Melle
- 12.1.4.1. Company Overview
- 12.1.4.2. Products
- 12.1.4.3. Company Financials
- 12.1.4.4. SWOT Analysis
- 12.1.5 Wrigley
- 12.1.5.1. Company Overview
- 12.1.5.2. Products
- 12.1.5.3. Company Financials
- 12.1.5.4. SWOT Analysis
- 12.1.1 Lotte
- 12.2. Market Entropy
- 12.2.1 Company's Key Areas Served
- 12.2.2 Recent Developments
- 12.3. Company Market Share Analysis 2025
- 12.3.1 Top 5 Companies Market Share Analysis
- 12.3.2 Top 3 Companies Market Share Analysis
- 12.4. List of Potential Customers
- 13. Research Methodology
List of Figures
- Figure 1: Global Gum Revenue Breakdown (undefined, %) by Region 2025 & 2033
- Figure 2: Global Gum Volume Breakdown (K, %) by Region 2025 & 2033
- Figure 3: North America Gum Revenue (undefined), by Application 2025 & 2033
- Figure 4: North America Gum Volume (K), by Application 2025 & 2033
- Figure 5: North America Gum Revenue Share (%), by Application 2025 & 2033
- Figure 6: North America Gum Volume Share (%), by Application 2025 & 2033
- Figure 7: North America Gum Revenue (undefined), by Type 2025 & 2033
- Figure 8: North America Gum Volume (K), by Type 2025 & 2033
- Figure 9: North America Gum Revenue Share (%), by Type 2025 & 2033
- Figure 10: North America Gum Volume Share (%), by Type 2025 & 2033
- Figure 11: North America Gum Revenue (undefined), by Country 2025 & 2033
- Figure 12: North America Gum Volume (K), by Country 2025 & 2033
- Figure 13: North America Gum Revenue Share (%), by Country 2025 & 2033
- Figure 14: North America Gum Volume Share (%), by Country 2025 & 2033
- Figure 15: South America Gum Revenue (undefined), by Application 2025 & 2033
- Figure 16: South America Gum Volume (K), by Application 2025 & 2033
- Figure 17: South America Gum Revenue Share (%), by Application 2025 & 2033
- Figure 18: South America Gum Volume Share (%), by Application 2025 & 2033
- Figure 19: South America Gum Revenue (undefined), by Type 2025 & 2033
- Figure 20: South America Gum Volume (K), by Type 2025 & 2033
- Figure 21: South America Gum Revenue Share (%), by Type 2025 & 2033
- Figure 22: South America Gum Volume Share (%), by Type 2025 & 2033
- Figure 23: South America Gum Revenue (undefined), by Country 2025 & 2033
- Figure 24: South America Gum Volume (K), by Country 2025 & 2033
- Figure 25: South America Gum Revenue Share (%), by Country 2025 & 2033
- Figure 26: South America Gum Volume Share (%), by Country 2025 & 2033
- Figure 27: Europe Gum Revenue (undefined), by Application 2025 & 2033
- Figure 28: Europe Gum Volume (K), by Application 2025 & 2033
- Figure 29: Europe Gum Revenue Share (%), by Application 2025 & 2033
- Figure 30: Europe Gum Volume Share (%), by Application 2025 & 2033
- Figure 31: Europe Gum Revenue (undefined), by Type 2025 & 2033
- Figure 32: Europe Gum Volume (K), by Type 2025 & 2033
- Figure 33: Europe Gum Revenue Share (%), by Type 2025 & 2033
- Figure 34: Europe Gum Volume Share (%), by Type 2025 & 2033
- Figure 35: Europe Gum Revenue (undefined), by Country 2025 & 2033
- Figure 36: Europe Gum Volume (K), by Country 2025 & 2033
- Figure 37: Europe Gum Revenue Share (%), by Country 2025 & 2033
- Figure 38: Europe Gum Volume Share (%), by Country 2025 & 2033
- Figure 39: Middle East & Africa Gum Revenue (undefined), by Application 2025 & 2033
- Figure 40: Middle East & Africa Gum Volume (K), by Application 2025 & 2033
- Figure 41: Middle East & Africa Gum Revenue Share (%), by Application 2025 & 2033
- Figure 42: Middle East & Africa Gum Volume Share (%), by Application 2025 & 2033
- Figure 43: Middle East & Africa Gum Revenue (undefined), by Type 2025 & 2033
- Figure 44: Middle East & Africa Gum Volume (K), by Type 2025 & 2033
- Figure 45: Middle East & Africa Gum Revenue Share (%), by Type 2025 & 2033
- Figure 46: Middle East & Africa Gum Volume Share (%), by Type 2025 & 2033
- Figure 47: Middle East & Africa Gum Revenue (undefined), by Country 2025 & 2033
- Figure 48: Middle East & Africa Gum Volume (K), by Country 2025 & 2033
- Figure 49: Middle East & Africa Gum Revenue Share (%), by Country 2025 & 2033
- Figure 50: Middle East & Africa Gum Volume Share (%), by Country 2025 & 2033
- Figure 51: Asia Pacific Gum Revenue (undefined), by Application 2025 & 2033
- Figure 52: Asia Pacific Gum Volume (K), by Application 2025 & 2033
- Figure 53: Asia Pacific Gum Revenue Share (%), by Application 2025 & 2033
- Figure 54: Asia Pacific Gum Volume Share (%), by Application 2025 & 2033
- Figure 55: Asia Pacific Gum Revenue (undefined), by Type 2025 & 2033
- Figure 56: Asia Pacific Gum Volume (K), by Type 2025 & 2033
- Figure 57: Asia Pacific Gum Revenue Share (%), by Type 2025 & 2033
- Figure 58: Asia Pacific Gum Volume Share (%), by Type 2025 & 2033
- Figure 59: Asia Pacific Gum Revenue (undefined), by Country 2025 & 2033
- Figure 60: Asia Pacific Gum Volume (K), by Country 2025 & 2033
- Figure 61: Asia Pacific Gum Revenue Share (%), by Country 2025 & 2033
- Figure 62: Asia Pacific Gum Volume Share (%), by Country 2025 & 2033
List of Tables
- Table 1: Global Gum Revenue undefined Forecast, by Application 2020 & 2033
- Table 2: Global Gum Volume K Forecast, by Application 2020 & 2033
- Table 3: Global Gum Revenue undefined Forecast, by Type 2020 & 2033
- Table 4: Global Gum Volume K Forecast, by Type 2020 & 2033
- Table 5: Global Gum Revenue undefined Forecast, by Region 2020 & 2033
- Table 6: Global Gum Volume K Forecast, by Region 2020 & 2033
- Table 7: Global Gum Revenue undefined Forecast, by Application 2020 & 2033
- Table 8: Global Gum Volume K Forecast, by Application 2020 & 2033
- Table 9: Global Gum Revenue undefined Forecast, by Type 2020 & 2033
- Table 10: Global Gum Volume K Forecast, by Type 2020 & 2033
- Table 11: Global Gum Revenue undefined Forecast, by Country 2020 & 2033
- Table 12: Global Gum Volume K Forecast, by Country 2020 & 2033
- Table 13: United States Gum Revenue (undefined) Forecast, by Application 2020 & 2033
- Table 14: United States Gum Volume (K) Forecast, by Application 2020 & 2033
- Table 15: Canada Gum Revenue (undefined) Forecast, by Application 2020 & 2033
- Table 16: Canada Gum Volume (K) Forecast, by Application 2020 & 2033
- Table 17: Mexico Gum Revenue (undefined) Forecast, by Application 2020 & 2033
- Table 18: Mexico Gum Volume (K) Forecast, by Application 2020 & 2033
- Table 19: Global Gum Revenue undefined Forecast, by Application 2020 & 2033
- Table 20: Global Gum Volume K Forecast, by Application 2020 & 2033
- Table 21: Global Gum Revenue undefined Forecast, by Type 2020 & 2033
- Table 22: Global Gum Volume K Forecast, by Type 2020 & 2033
- Table 23: Global Gum Revenue undefined Forecast, by Country 2020 & 2033
- Table 24: Global Gum Volume K Forecast, by Country 2020 & 2033
- Table 25: Brazil Gum Revenue (undefined) Forecast, by Application 2020 & 2033
- Table 26: Brazil Gum Volume (K) Forecast, by Application 2020 & 2033
- Table 27: Argentina Gum Revenue (undefined) Forecast, by Application 2020 & 2033
- Table 28: Argentina Gum Volume (K) Forecast, by Application 2020 & 2033
- Table 29: Rest of South America Gum Revenue (undefined) Forecast, by Application 2020 & 2033
- Table 30: Rest of South America Gum Volume (K) Forecast, by Application 2020 & 2033
- Table 31: Global Gum Revenue undefined Forecast, by Application 2020 & 2033
- Table 32: Global Gum Volume K Forecast, by Application 2020 & 2033
- Table 33: Global Gum Revenue undefined Forecast, by Type 2020 & 2033
- Table 34: Global Gum Volume K Forecast, by Type 2020 & 2033
- Table 35: Global Gum Revenue undefined Forecast, by Country 2020 & 2033
- Table 36: Global Gum Volume K Forecast, by Country 2020 & 2033
- Table 37: United Kingdom Gum Revenue (undefined) Forecast, by Application 2020 & 2033
- Table 38: United Kingdom Gum Volume (K) Forecast, by Application 2020 & 2033
- Table 39: Germany Gum Revenue (undefined) Forecast, by Application 2020 & 2033
- Table 40: Germany Gum Volume (K) Forecast, by Application 2020 & 2033
- Table 41: France Gum Revenue (undefined) Forecast, by Application 2020 & 2033
- Table 42: France Gum Volume (K) Forecast, by Application 2020 & 2033
- Table 43: Italy Gum Revenue (undefined) Forecast, by Application 2020 & 2033
- Table 44: Italy Gum Volume (K) Forecast, by Application 2020 & 2033
- Table 45: Spain Gum Revenue (undefined) Forecast, by Application 2020 & 2033
- Table 46: Spain Gum Volume (K) Forecast, by Application 2020 & 2033
- Table 47: Russia Gum Revenue (undefined) Forecast, by Application 2020 & 2033
- Table 48: Russia Gum Volume (K) Forecast, by Application 2020 & 2033
- Table 49: Benelux Gum Revenue (undefined) Forecast, by Application 2020 & 2033
- Table 50: Benelux Gum Volume (K) Forecast, by Application 2020 & 2033
- Table 51: Nordics Gum Revenue (undefined) Forecast, by Application 2020 & 2033
- Table 52: Nordics Gum Volume (K) Forecast, by Application 2020 & 2033
- Table 53: Rest of Europe Gum Revenue (undefined) Forecast, by Application 2020 & 2033
- Table 54: Rest of Europe Gum Volume (K) Forecast, by Application 2020 & 2033
- Table 55: Global Gum Revenue undefined Forecast, by Application 2020 & 2033
- Table 56: Global Gum Volume K Forecast, by Application 2020 & 2033
- Table 57: Global Gum Revenue undefined Forecast, by Type 2020 & 2033
- Table 58: Global Gum Volume K Forecast, by Type 2020 & 2033
- Table 59: Global Gum Revenue undefined Forecast, by Country 2020 & 2033
- Table 60: Global Gum Volume K Forecast, by Country 2020 & 2033
- Table 61: Turkey Gum Revenue (undefined) Forecast, by Application 2020 & 2033
- Table 62: Turkey Gum Volume (K) Forecast, by Application 2020 & 2033
- Table 63: Israel Gum Revenue (undefined) Forecast, by Application 2020 & 2033
- Table 64: Israel Gum Volume (K) Forecast, by Application 2020 & 2033
- Table 65: GCC Gum Revenue (undefined) Forecast, by Application 2020 & 2033
- Table 66: GCC Gum Volume (K) Forecast, by Application 2020 & 2033
- Table 67: North Africa Gum Revenue (undefined) Forecast, by Application 2020 & 2033
- Table 68: North Africa Gum Volume (K) Forecast, by Application 2020 & 2033
- Table 69: South Africa Gum Revenue (undefined) Forecast, by Application 2020 & 2033
- Table 70: South Africa Gum Volume (K) Forecast, by Application 2020 & 2033
- Table 71: Rest of Middle East & Africa Gum Revenue (undefined) Forecast, by Application 2020 & 2033
- Table 72: Rest of Middle East & Africa Gum Volume (K) Forecast, by Application 2020 & 2033
- Table 73: Global Gum Revenue undefined Forecast, by Application 2020 & 2033
- Table 74: Global Gum Volume K Forecast, by Application 2020 & 2033
- Table 75: Global Gum Revenue undefined Forecast, by Type 2020 & 2033
- Table 76: Global Gum Volume K Forecast, by Type 2020 & 2033
- Table 77: Global Gum Revenue undefined Forecast, by Country 2020 & 2033
- Table 78: Global Gum Volume K Forecast, by Country 2020 & 2033
- Table 79: China Gum Revenue (undefined) Forecast, by Application 2020 & 2033
- Table 80: China Gum Volume (K) Forecast, by Application 2020 & 2033
- Table 81: India Gum Revenue (undefined) Forecast, by Application 2020 & 2033
- Table 82: India Gum Volume (K) Forecast, by Application 2020 & 2033
- Table 83: Japan Gum Revenue (undefined) Forecast, by Application 2020 & 2033
- Table 84: Japan Gum Volume (K) Forecast, by Application 2020 & 2033
- Table 85: South Korea Gum Revenue (undefined) Forecast, by Application 2020 & 2033
- Table 86: South Korea Gum Volume (K) Forecast, by Application 2020 & 2033
- Table 87: ASEAN Gum Revenue (undefined) Forecast, by Application 2020 & 2033
- Table 88: ASEAN Gum Volume (K) Forecast, by Application 2020 & 2033
- Table 89: Oceania Gum Revenue (undefined) Forecast, by Application 2020 & 2033
- Table 90: Oceania Gum Volume (K) Forecast, by Application 2020 & 2033
- Table 91: Rest of Asia Pacific Gum Revenue (undefined) Forecast, by Application 2020 & 2033
- Table 92: Rest of Asia Pacific Gum Volume (K) Forecast, by Application 2020 & 2033
Frequently Asked Questions
1. What is the projected Compound Annual Growth Rate (CAGR) of the Gum?
The projected CAGR is approximately 4.5%.
2. Which companies are prominent players in the Gum?
Key companies in the market include Lotte, Meiji Holdings, Mondelez International, Perfetti Van Melle, Wrigley.
3. What are the main segments of the Gum?
The market segments include Application, Type.
4. Can you provide details about the market size?
The market size is estimated to be USD XXX N/A as of 2022.
5. What are some drivers contributing to market growth?
N/A
6. What are the notable trends driving market growth?
N/A
7. Are there any restraints impacting market growth?
N/A
8. Can you provide examples of recent developments in the market?
N/A
9. What pricing options are available for accessing the report?
Pricing options include single-user, multi-user, and enterprise licenses priced at USD 3950.00, USD 5925.00, and USD 7900.00 respectively.
10. Is the market size provided in terms of value or volume?
The market size is provided in terms of value, measured in N/A and volume, measured in K.
11. Are there any specific market keywords associated with the report?
Yes, the market keyword associated with the report is "Gum," which aids in identifying and referencing the specific market segment covered.
12. How do I determine which pricing option suits my needs best?
The pricing options vary based on user requirements and access needs. Individual users may opt for single-user licenses, while businesses requiring broader access may choose multi-user or enterprise licenses for cost-effective access to the report.
13. Are there any additional resources or data provided in the Gum report?
While the report offers comprehensive insights, it's advisable to review the specific contents or supplementary materials provided to ascertain if additional resources or data are available.
14. How can I stay updated on further developments or reports in the Gum?
To stay informed about further developments, trends, and reports in the Gum, consider subscribing to industry newsletters, following relevant companies and organizations, or regularly checking reputable industry news sources and publications.
Methodology
Step 1 - Identification of Relevant Samples Size from Population Database


Step 2 - Approaches for Defining Global Market Size (Value, Volume* & Price*)

Note*: In applicable scenarios
Step 3 - Data Sources
Primary Research
- Web Analytics
- Survey Reports
- Research Institute
- Latest Research Reports
- Opinion Leaders
Secondary Research
- Annual Reports
- White Paper
- Latest Press Release
- Industry Association
- Paid Database
- Investor Presentations

Step 4 - Data Triangulation
Involves using different sources of information in order to increase the validity of a study
These sources are likely to be stakeholders in a program - participants, other researchers, program staff, other community members, and so on.
Then we put all data in single framework & apply various statistical tools to find out the dynamic on the market.
During the analysis stage, feedback from the stakeholder groups would be compared to determine areas of agreement as well as areas of divergence