

Key Insights
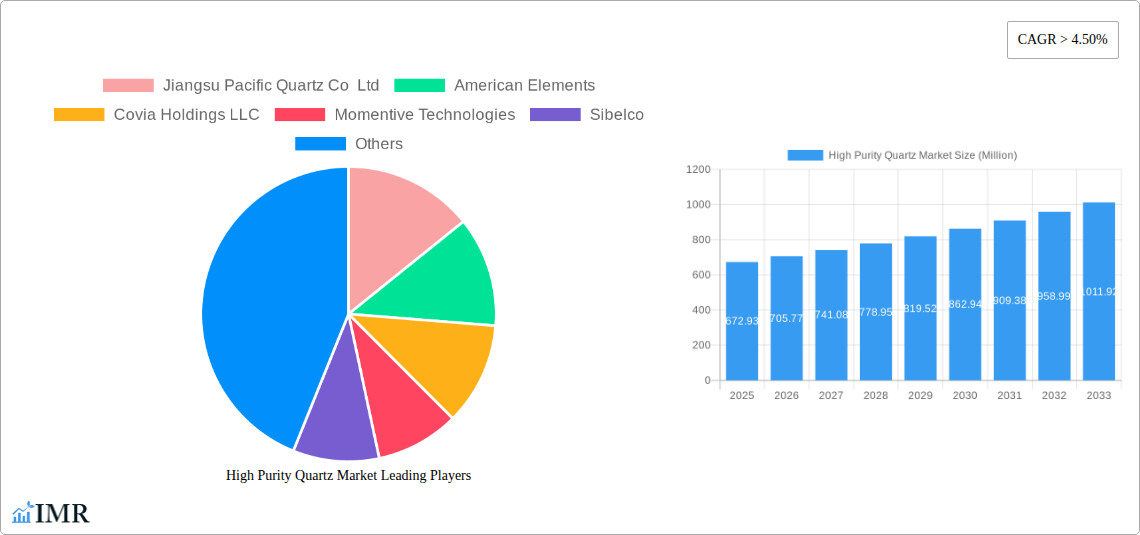
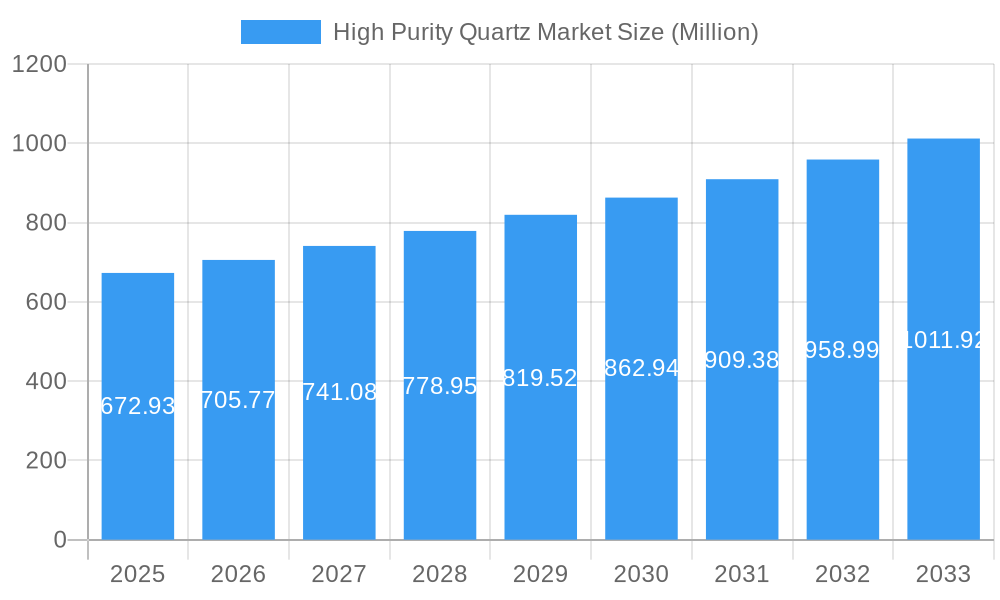
The high-purity quartz market, valued at $672.93 million in 2025, is projected to experience robust growth, exhibiting a compound annual growth rate (CAGR) exceeding 4.5% from 2025 to 2033. This expansion is driven by the burgeoning demand for high-purity quartz in several key applications. The semiconductor industry, a major consumer, requires high-purity quartz for crucial components like wafers and crucibles, fueling significant market growth. The solar energy sector's rapid expansion also contributes substantially, as high-purity quartz is essential in solar cell manufacturing to enhance efficiency and durability. Further bolstering demand are the growing telecom and optics industries, which utilize high-purity quartz in fiber optic cables and precision optical instruments. Technological advancements in microelectronics and the increasing adoption of LED lighting are also creating significant market opportunities. While the market faces potential constraints such as raw material availability and price volatility, the overall growth trajectory remains positive, particularly in regions like Asia-Pacific, driven by rapid industrialization and technological adoption. The competitive landscape features both established players and emerging companies, leading to innovation and a wider range of product offerings.
High Purity Quartz Market Market Size (In Million)
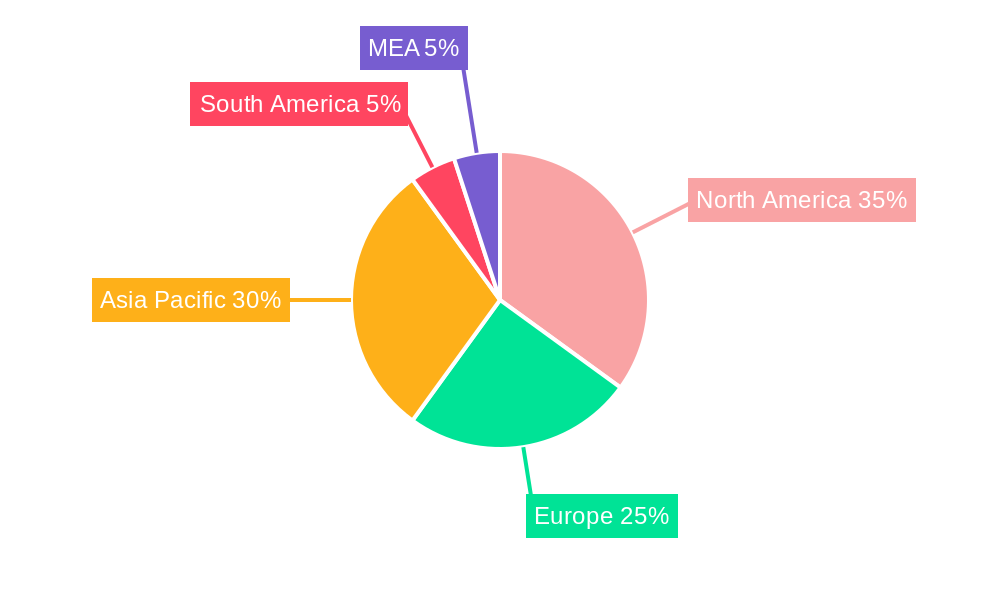
The market segmentation reveals a diverse landscape, with semiconductors holding the largest share of applications. This dominance is expected to continue throughout the forecast period due to ongoing technological advancements and miniaturization in the semiconductor industry. The solar and lighting segments are also predicted to witness strong growth, driven by government initiatives promoting renewable energy and energy efficiency. North America and Asia-Pacific currently represent the largest regional markets, but other regions like Europe and South America are expected to experience substantial growth over the coming years, reflecting the global adoption of technologies that rely on high-purity quartz. Competitive strategies will likely focus on vertical integration, technological advancements in purification processes, and strategic partnerships to secure raw materials and expand market reach.
High Purity Quartz Market Company Market Share
This comprehensive report provides a detailed analysis of the High Purity Quartz (HPQ) market, encompassing market dynamics, growth trends, regional dominance, product landscape, key players, and future outlook. The report covers the period from 2019 to 2033, with a focus on the 2025-2033 forecast period. The parent market is the broader quartz market, while the child market specifically focuses on high-purity quartz used in demanding applications. The market size is presented in million units.
High Purity Quartz Market Market Dynamics & Structure
The High Purity Quartz market exhibits a moderately concentrated structure, with a few major players holding significant market share. Technological innovation, particularly in refining techniques and purity levels, is a major driver. Stringent regulatory frameworks regarding material purity in specific applications (e.g., semiconductors) influence market growth. While there are few direct substitutes, alternative materials are emerging in niche applications, posing a competitive threat. End-user demographics are primarily driven by the electronics and solar industries, with continuous expansion expected in emerging technologies. The M&A landscape reveals moderate activity, with strategic acquisitions aimed at expanding capacity and securing raw material sources.
- Market Concentration: xx% controlled by top 5 players in 2024.
- Technological Innovation: Focus on improving purity levels (e.g., reducing metal impurities) and crystal size control.
- Regulatory Landscape: Stringent purity standards in semiconductor and solar industries.
- Competitive Substitutes: Limited direct substitutes, but alternative materials gaining traction in niche segments.
- M&A Activity: xx deals in the past 5 years, primarily focusing on capacity expansion.
- Innovation Barriers: High capital expenditure for advanced purification technologies.
High Purity Quartz Market Growth Trends & Insights
The High Purity Quartz (HPQ) market has demonstrated robust expansion from 2019 to 2024, primarily propelled by the escalating demand from the critical semiconductor and burgeoning solar industries. The market size reached an estimated [Insert Market Size Figure Here] million units in 2024, exhibiting a Compound Annual Growth Rate (CAGR) of [Insert Historical CAGR Here]% during the historical period. The widespread adoption of HPQ is intrinsically linked to the continuous advancements in electronics and the renewable energy sector. Furthermore, disruptive technologies, such as cutting-edge thin-film solar cells, are acting as significant catalysts for market growth. A discernible shift in consumer preferences towards energy-efficient and technologically sophisticated products is also contributing to a sustained and substantial demand. The forecast period spanning from 2025 to 2033 anticipates a continuation of this positive trajectory, fueled by substantial investments in expanding semiconductor manufacturing capabilities and the widespread deployment of solar power installations globally. Market penetration in emerging economies is also poised to be a considerable contributor to the overall market expansion. The projected CAGR for the period 2025-2033 is estimated at [Insert Forecast CAGR Here]%.
Dominant Regions, Countries, or Segments in High Purity Quartz Market
The Asia-Pacific region currently dominates the High Purity Quartz market, primarily driven by China's substantial semiconductor and solar manufacturing sectors. Strong government support for renewable energy initiatives and robust economic growth are key drivers. North America and Europe also hold significant market share, driven by a large existing installed base of electronics and solar industries. The Semiconductor segment within the application category currently represents the largest market share, driven by increasing demand for high-performance electronic devices.
- Asia-Pacific: Dominant market share due to large manufacturing base and government support.
- North America: Strong growth potential driven by technological innovation and investment.
- Europe: Stable market with growing adoption in renewable energy sector.
- Semiconductor Segment: Largest market share due to stringent purity requirements.
- Solar Segment: Significant growth expected due to increasing solar energy adoption.
High Purity Quartz Market Product Landscape
The diverse array of High Purity Quartz products is meticulously categorized based on their stringent purity levels, precise crystal size, and their specialized applications. Recent pioneering innovations are predominantly focused on the relentless enhancement of purity levels, catering to the ever-increasing and exacting demands of advanced technological applications. These products are extensively customized to precisely fulfill specific performance metrics, including exceptional optical transmission capabilities, superior thermal stability under extreme conditions, and remarkable resistance to impurities. The unique selling propositions of leading HPQ manufacturers often stem from their unparalleled purity, meticulously refined crystalline structures, and the development of bespoke solutions tailored for niche applications. Technological advancements are primarily concentrated on optimizing and refining purification processes to minimize defects and ensure a high degree of homogeneity across the material.
Key Drivers, Barriers & Challenges in High Purity Quartz Market
Key Drivers:
- Growing demand from the semiconductor industry for advanced electronics.
- Increasing adoption of solar energy globally.
- Technological advancements improving purity and refining efficiency.
Challenges & Restraints:
- Limited supply of high-quality raw quartz materials.
- High production costs associated with achieving extreme purity levels.
- Intense competition from existing players and emerging market entrants. Supply chain disruptions can lead to significant price fluctuations impacting profitability (e.g., a xx% increase in raw material costs can reduce profit margins by xx%).
Emerging Opportunities in High Purity Quartz Market
- Expansion into emerging markets with high growth potential in electronics and renewable energy.
- Development of new applications for HPQ in advanced technologies (e.g., 5G infrastructure).
- Exploring sustainable and environmentally friendly mining and processing techniques.
Growth Accelerators in the High Purity Quartz Market Industry
The establishment of strategic partnerships and robust collaborations between High Purity Quartz producers and their key end-users is identified as a pivotal factor for sustainable, long-term market growth. Continued innovation and refinement in purification techniques, alongside the proactive exploration of novel and high-quality raw material sources, are absolutely critical for maintaining a competitive edge. Strategic expansion into new and emerging geographic markets, coupled with intelligent diversification into higher-value, specialized applications, are expected to significantly amplify the market potential and profitability for industry players.
Key Players Shaping the High Purity Quartz Market Market
- Jiangsu Pacific Quartz Co Ltd
- American Elements
- Covia Holdings LLC
- Momentive Technologies
- Sibelco
- Imerys
- ULTRA HPQ
- Russian Quartz LLC
- Australian Silica Quartz Group Ltd
- The Quartz Corp
Notable Milestones in High Purity Quartz Market Sector
- April 2023: Sibelco announced a substantial investment of approximately USD 200 million dedicated to doubling the high purity quartz (HPQ) installed capacity at its strategic Spruce Pine facility located in North Carolina, United States. This significant financial commitment underscores a strong market confidence in future demand and signals a potential for enhanced supply capabilities and a more competitive pricing landscape within the market.
In-Depth High Purity Quartz Market Market Outlook
The High Purity Quartz market exhibits strong growth potential, driven by ongoing technological advancements and the expanding electronics and renewable energy sectors. Strategic investments in capacity expansion, coupled with R&D efforts focused on improving purity and efficiency, will shape the market landscape. Companies focusing on sustainable practices and supply chain diversification will gain a competitive edge. The market is expected to maintain a robust growth trajectory throughout the forecast period, presenting significant opportunities for both established players and new entrants.
High Purity Quartz Market Segmentation
-
1. Application
- 1.1. Semiconductor
- 1.2. Solar
- 1.3. Lighting
- 1.4. Telecom and Optics
- 1.5. Microelectronics
- 1.6. Others
High Purity Quartz Market Segmentation By Geography
-
1. Asia Pacific
- 1.1. China
- 1.2. India
- 1.3. Japan
- 1.4. South Korea
- 1.5. Rest of Asia Pacific
-
2. North America
- 2.1. United States
- 2.2. Canada
- 2.3. Mexico
-
3. Europe
- 3.1. Germany
- 3.2. United Kingdom
- 3.3. Italy
- 3.4. France
- 3.5. Rest of Europe
-
4. South America
- 4.1. Brazil
- 4.2. Argentina
- 4.3. Rest of South America
-
5. Middle East and Africa
- 5.1. Saudi Arabia
- 5.2. South Africa
- 5.3. Rest of Middle East and Africa
High Purity Quartz Market Regional Market Share
Geographic Coverage of High Purity Quartz Market
High Purity Quartz Market REPORT HIGHLIGHTS
| Aspects | Details |
|---|---|
| Study Period | 2020-2034 |
| Base Year | 2025 |
| Estimated Year | 2026 |
| Forecast Period | 2026-2034 |
| Historical Period | 2020-2025 |
| Growth Rate | CAGR of > 4.50% from 2020-2034 |
| Segmentation |
|
Table of Contents
- 1. Introduction
- 1.1. Research Scope
- 1.2. Market Segmentation
- 1.3. Research Objective
- 1.4. Definitions and Assumptions
- 2. Executive Summary
- 2.1. Market Snapshot
- 3. Market Dynamics
- 3.1. Market Drivers
- 3.2. Market Restrains
- 3.3. Market Trends
- 3.4. Market Opportunities
- 4. Market Factor Analysis
- 4.1. Porters Five Forces
- 4.1.1. Bargaining Power of Suppliers
- 4.1.2. Bargaining Power of Buyers
- 4.1.3. Threat of New Entrants
- 4.1.4. Threat of Substitutes
- 4.1.5. Competitive Rivalry
- 4.2. PESTEL analysis
- 4.3. BCG Analysis
- 4.3.1. Stars (High Growth, High Market Share)
- 4.3.2. Cash Cows (Low Growth, High Market Share)
- 4.3.3. Question Mark (High Growth, Low Market Share)
- 4.3.4. Dogs (Low Growth, Low Market Share)
- 4.4. Ansoff Matrix Analysis
- 4.5. Supply Chain Analysis
- 4.6. Regulatory Landscape
- 4.7. Current Market Potential and Opportunity Assessment (TAM–SAM–SOM Framework)
- 4.8. IMR Analyst Note
- 4.1. Porters Five Forces
- 5. Market Analysis, Insights and Forecast 2021-2033
- 5.1. Market Analysis, Insights and Forecast - by Application
- 5.1.1. Semiconductor
- 5.1.2. Solar
- 5.1.3. Lighting
- 5.1.4. Telecom and Optics
- 5.1.5. Microelectronics
- 5.1.6. Others
- 5.2. Market Analysis, Insights and Forecast - by Region
- 5.2.1. Asia Pacific
- 5.2.2. North America
- 5.2.3. Europe
- 5.2.4. South America
- 5.2.5. Middle East and Africa
- 5.1. Market Analysis, Insights and Forecast - by Application
- 6. Global High Purity Quartz Market Analysis, Insights and Forecast, 2021-2033
- 6.1. Market Analysis, Insights and Forecast - by Application
- 6.1.1. Semiconductor
- 6.1.2. Solar
- 6.1.3. Lighting
- 6.1.4. Telecom and Optics
- 6.1.5. Microelectronics
- 6.1.6. Others
- 6.1. Market Analysis, Insights and Forecast - by Application
- 7. Asia Pacific High Purity Quartz Market Analysis, Insights and Forecast, 2020-2032
- 7.1. Market Analysis, Insights and Forecast - by Application
- 7.1.1. Semiconductor
- 7.1.2. Solar
- 7.1.3. Lighting
- 7.1.4. Telecom and Optics
- 7.1.5. Microelectronics
- 7.1.6. Others
- 7.1. Market Analysis, Insights and Forecast - by Application
- 8. North America High Purity Quartz Market Analysis, Insights and Forecast, 2020-2032
- 8.1. Market Analysis, Insights and Forecast - by Application
- 8.1.1. Semiconductor
- 8.1.2. Solar
- 8.1.3. Lighting
- 8.1.4. Telecom and Optics
- 8.1.5. Microelectronics
- 8.1.6. Others
- 8.1. Market Analysis, Insights and Forecast - by Application
- 9. Europe High Purity Quartz Market Analysis, Insights and Forecast, 2020-2032
- 9.1. Market Analysis, Insights and Forecast - by Application
- 9.1.1. Semiconductor
- 9.1.2. Solar
- 9.1.3. Lighting
- 9.1.4. Telecom and Optics
- 9.1.5. Microelectronics
- 9.1.6. Others
- 9.1. Market Analysis, Insights and Forecast - by Application
- 10. South America High Purity Quartz Market Analysis, Insights and Forecast, 2020-2032
- 10.1. Market Analysis, Insights and Forecast - by Application
- 10.1.1. Semiconductor
- 10.1.2. Solar
- 10.1.3. Lighting
- 10.1.4. Telecom and Optics
- 10.1.5. Microelectronics
- 10.1.6. Others
- 10.1. Market Analysis, Insights and Forecast - by Application
- 11. Middle East and Africa High Purity Quartz Market Analysis, Insights and Forecast, 2020-2032
- 11.1. Market Analysis, Insights and Forecast - by Application
- 11.1.1. Semiconductor
- 11.1.2. Solar
- 11.1.3. Lighting
- 11.1.4. Telecom and Optics
- 11.1.5. Microelectronics
- 11.1.6. Others
- 11.1. Market Analysis, Insights and Forecast - by Application
- 12. Competitive Analysis
- 12.1. Company Profiles
- 12.1.1 Jiangsu Pacific Quartz Co Ltd
- 12.1.1.1. Company Overview
- 12.1.1.2. Products
- 12.1.1.3. Company Financials
- 12.1.1.4. SWOT Analysis
- 12.1.2 American Elements
- 12.1.2.1. Company Overview
- 12.1.2.2. Products
- 12.1.2.3. Company Financials
- 12.1.2.4. SWOT Analysis
- 12.1.3 Covia Holdings LLC
- 12.1.3.1. Company Overview
- 12.1.3.2. Products
- 12.1.3.3. Company Financials
- 12.1.3.4. SWOT Analysis
- 12.1.4 Momentive Technologies
- 12.1.4.1. Company Overview
- 12.1.4.2. Products
- 12.1.4.3. Company Financials
- 12.1.4.4. SWOT Analysis
- 12.1.5 Sibelco
- 12.1.5.1. Company Overview
- 12.1.5.2. Products
- 12.1.5.3. Company Financials
- 12.1.5.4. SWOT Analysis
- 12.1.6 Imerys
- 12.1.6.1. Company Overview
- 12.1.6.2. Products
- 12.1.6.3. Company Financials
- 12.1.6.4. SWOT Analysis
- 12.1.7 ULTRA HPQ
- 12.1.7.1. Company Overview
- 12.1.7.2. Products
- 12.1.7.3. Company Financials
- 12.1.7.4. SWOT Analysis
- 12.1.8 Russian Quartz LLC
- 12.1.8.1. Company Overview
- 12.1.8.2. Products
- 12.1.8.3. Company Financials
- 12.1.8.4. SWOT Analysis
- 12.1.9 Australian Silica Quartz Group Ltd
- 12.1.9.1. Company Overview
- 12.1.9.2. Products
- 12.1.9.3. Company Financials
- 12.1.9.4. SWOT Analysis
- 12.1.10 The Quartz Corp
- 12.1.10.1. Company Overview
- 12.1.10.2. Products
- 12.1.10.3. Company Financials
- 12.1.10.4. SWOT Analysis
- 12.1.1 Jiangsu Pacific Quartz Co Ltd
- 12.2. Market Entropy
- 12.2.1 Company's Key Areas Served
- 12.2.2 Recent Developments
- 12.3. Company Market Share Analysis 2025
- 12.3.1 Top 5 Companies Market Share Analysis
- 12.3.2 Top 3 Companies Market Share Analysis
- 12.4. List of Potential Customers
- 13. Research Methodology
List of Figures
- Figure 1: Global High Purity Quartz Market Revenue Breakdown (Million, %) by Region 2025 & 2033
- Figure 2: Global High Purity Quartz Market Volume Breakdown (K Tons, %) by Region 2025 & 2033
- Figure 3: Asia Pacific High Purity Quartz Market Revenue (Million), by Application 2025 & 2033
- Figure 4: Asia Pacific High Purity Quartz Market Volume (K Tons), by Application 2025 & 2033
- Figure 5: Asia Pacific High Purity Quartz Market Revenue Share (%), by Application 2025 & 2033
- Figure 6: Asia Pacific High Purity Quartz Market Volume Share (%), by Application 2025 & 2033
- Figure 7: Asia Pacific High Purity Quartz Market Revenue (Million), by Country 2025 & 2033
- Figure 8: Asia Pacific High Purity Quartz Market Volume (K Tons), by Country 2025 & 2033
- Figure 9: Asia Pacific High Purity Quartz Market Revenue Share (%), by Country 2025 & 2033
- Figure 10: Asia Pacific High Purity Quartz Market Volume Share (%), by Country 2025 & 2033
- Figure 11: North America High Purity Quartz Market Revenue (Million), by Application 2025 & 2033
- Figure 12: North America High Purity Quartz Market Volume (K Tons), by Application 2025 & 2033
- Figure 13: North America High Purity Quartz Market Revenue Share (%), by Application 2025 & 2033
- Figure 14: North America High Purity Quartz Market Volume Share (%), by Application 2025 & 2033
- Figure 15: North America High Purity Quartz Market Revenue (Million), by Country 2025 & 2033
- Figure 16: North America High Purity Quartz Market Volume (K Tons), by Country 2025 & 2033
- Figure 17: North America High Purity Quartz Market Revenue Share (%), by Country 2025 & 2033
- Figure 18: North America High Purity Quartz Market Volume Share (%), by Country 2025 & 2033
- Figure 19: Europe High Purity Quartz Market Revenue (Million), by Application 2025 & 2033
- Figure 20: Europe High Purity Quartz Market Volume (K Tons), by Application 2025 & 2033
- Figure 21: Europe High Purity Quartz Market Revenue Share (%), by Application 2025 & 2033
- Figure 22: Europe High Purity Quartz Market Volume Share (%), by Application 2025 & 2033
- Figure 23: Europe High Purity Quartz Market Revenue (Million), by Country 2025 & 2033
- Figure 24: Europe High Purity Quartz Market Volume (K Tons), by Country 2025 & 2033
- Figure 25: Europe High Purity Quartz Market Revenue Share (%), by Country 2025 & 2033
- Figure 26: Europe High Purity Quartz Market Volume Share (%), by Country 2025 & 2033
- Figure 27: South America High Purity Quartz Market Revenue (Million), by Application 2025 & 2033
- Figure 28: South America High Purity Quartz Market Volume (K Tons), by Application 2025 & 2033
- Figure 29: South America High Purity Quartz Market Revenue Share (%), by Application 2025 & 2033
- Figure 30: South America High Purity Quartz Market Volume Share (%), by Application 2025 & 2033
- Figure 31: South America High Purity Quartz Market Revenue (Million), by Country 2025 & 2033
- Figure 32: South America High Purity Quartz Market Volume (K Tons), by Country 2025 & 2033
- Figure 33: South America High Purity Quartz Market Revenue Share (%), by Country 2025 & 2033
- Figure 34: South America High Purity Quartz Market Volume Share (%), by Country 2025 & 2033
- Figure 35: Middle East and Africa High Purity Quartz Market Revenue (Million), by Application 2025 & 2033
- Figure 36: Middle East and Africa High Purity Quartz Market Volume (K Tons), by Application 2025 & 2033
- Figure 37: Middle East and Africa High Purity Quartz Market Revenue Share (%), by Application 2025 & 2033
- Figure 38: Middle East and Africa High Purity Quartz Market Volume Share (%), by Application 2025 & 2033
- Figure 39: Middle East and Africa High Purity Quartz Market Revenue (Million), by Country 2025 & 2033
- Figure 40: Middle East and Africa High Purity Quartz Market Volume (K Tons), by Country 2025 & 2033
- Figure 41: Middle East and Africa High Purity Quartz Market Revenue Share (%), by Country 2025 & 2033
- Figure 42: Middle East and Africa High Purity Quartz Market Volume Share (%), by Country 2025 & 2033
List of Tables
- Table 1: Global High Purity Quartz Market Revenue Million Forecast, by Application 2020 & 2033
- Table 2: Global High Purity Quartz Market Volume K Tons Forecast, by Application 2020 & 2033
- Table 3: Global High Purity Quartz Market Revenue Million Forecast, by Region 2020 & 2033
- Table 4: Global High Purity Quartz Market Volume K Tons Forecast, by Region 2020 & 2033
- Table 5: Global High Purity Quartz Market Revenue Million Forecast, by Application 2020 & 2033
- Table 6: Global High Purity Quartz Market Volume K Tons Forecast, by Application 2020 & 2033
- Table 7: Global High Purity Quartz Market Revenue Million Forecast, by Country 2020 & 2033
- Table 8: Global High Purity Quartz Market Volume K Tons Forecast, by Country 2020 & 2033
- Table 9: China High Purity Quartz Market Revenue (Million) Forecast, by Application 2020 & 2033
- Table 10: China High Purity Quartz Market Volume (K Tons) Forecast, by Application 2020 & 2033
- Table 11: India High Purity Quartz Market Revenue (Million) Forecast, by Application 2020 & 2033
- Table 12: India High Purity Quartz Market Volume (K Tons) Forecast, by Application 2020 & 2033
- Table 13: Japan High Purity Quartz Market Revenue (Million) Forecast, by Application 2020 & 2033
- Table 14: Japan High Purity Quartz Market Volume (K Tons) Forecast, by Application 2020 & 2033
- Table 15: South Korea High Purity Quartz Market Revenue (Million) Forecast, by Application 2020 & 2033
- Table 16: South Korea High Purity Quartz Market Volume (K Tons) Forecast, by Application 2020 & 2033
- Table 17: Rest of Asia Pacific High Purity Quartz Market Revenue (Million) Forecast, by Application 2020 & 2033
- Table 18: Rest of Asia Pacific High Purity Quartz Market Volume (K Tons) Forecast, by Application 2020 & 2033
- Table 19: Global High Purity Quartz Market Revenue Million Forecast, by Application 2020 & 2033
- Table 20: Global High Purity Quartz Market Volume K Tons Forecast, by Application 2020 & 2033
- Table 21: Global High Purity Quartz Market Revenue Million Forecast, by Country 2020 & 2033
- Table 22: Global High Purity Quartz Market Volume K Tons Forecast, by Country 2020 & 2033
- Table 23: United States High Purity Quartz Market Revenue (Million) Forecast, by Application 2020 & 2033
- Table 24: United States High Purity Quartz Market Volume (K Tons) Forecast, by Application 2020 & 2033
- Table 25: Canada High Purity Quartz Market Revenue (Million) Forecast, by Application 2020 & 2033
- Table 26: Canada High Purity Quartz Market Volume (K Tons) Forecast, by Application 2020 & 2033
- Table 27: Mexico High Purity Quartz Market Revenue (Million) Forecast, by Application 2020 & 2033
- Table 28: Mexico High Purity Quartz Market Volume (K Tons) Forecast, by Application 2020 & 2033
- Table 29: Global High Purity Quartz Market Revenue Million Forecast, by Application 2020 & 2033
- Table 30: Global High Purity Quartz Market Volume K Tons Forecast, by Application 2020 & 2033
- Table 31: Global High Purity Quartz Market Revenue Million Forecast, by Country 2020 & 2033
- Table 32: Global High Purity Quartz Market Volume K Tons Forecast, by Country 2020 & 2033
- Table 33: Germany High Purity Quartz Market Revenue (Million) Forecast, by Application 2020 & 2033
- Table 34: Germany High Purity Quartz Market Volume (K Tons) Forecast, by Application 2020 & 2033
- Table 35: United Kingdom High Purity Quartz Market Revenue (Million) Forecast, by Application 2020 & 2033
- Table 36: United Kingdom High Purity Quartz Market Volume (K Tons) Forecast, by Application 2020 & 2033
- Table 37: Italy High Purity Quartz Market Revenue (Million) Forecast, by Application 2020 & 2033
- Table 38: Italy High Purity Quartz Market Volume (K Tons) Forecast, by Application 2020 & 2033
- Table 39: France High Purity Quartz Market Revenue (Million) Forecast, by Application 2020 & 2033
- Table 40: France High Purity Quartz Market Volume (K Tons) Forecast, by Application 2020 & 2033
- Table 41: Rest of Europe High Purity Quartz Market Revenue (Million) Forecast, by Application 2020 & 2033
- Table 42: Rest of Europe High Purity Quartz Market Volume (K Tons) Forecast, by Application 2020 & 2033
- Table 43: Global High Purity Quartz Market Revenue Million Forecast, by Application 2020 & 2033
- Table 44: Global High Purity Quartz Market Volume K Tons Forecast, by Application 2020 & 2033
- Table 45: Global High Purity Quartz Market Revenue Million Forecast, by Country 2020 & 2033
- Table 46: Global High Purity Quartz Market Volume K Tons Forecast, by Country 2020 & 2033
- Table 47: Brazil High Purity Quartz Market Revenue (Million) Forecast, by Application 2020 & 2033
- Table 48: Brazil High Purity Quartz Market Volume (K Tons) Forecast, by Application 2020 & 2033
- Table 49: Argentina High Purity Quartz Market Revenue (Million) Forecast, by Application 2020 & 2033
- Table 50: Argentina High Purity Quartz Market Volume (K Tons) Forecast, by Application 2020 & 2033
- Table 51: Rest of South America High Purity Quartz Market Revenue (Million) Forecast, by Application 2020 & 2033
- Table 52: Rest of South America High Purity Quartz Market Volume (K Tons) Forecast, by Application 2020 & 2033
- Table 53: Global High Purity Quartz Market Revenue Million Forecast, by Application 2020 & 2033
- Table 54: Global High Purity Quartz Market Volume K Tons Forecast, by Application 2020 & 2033
- Table 55: Global High Purity Quartz Market Revenue Million Forecast, by Country 2020 & 2033
- Table 56: Global High Purity Quartz Market Volume K Tons Forecast, by Country 2020 & 2033
- Table 57: Saudi Arabia High Purity Quartz Market Revenue (Million) Forecast, by Application 2020 & 2033
- Table 58: Saudi Arabia High Purity Quartz Market Volume (K Tons) Forecast, by Application 2020 & 2033
- Table 59: South Africa High Purity Quartz Market Revenue (Million) Forecast, by Application 2020 & 2033
- Table 60: South Africa High Purity Quartz Market Volume (K Tons) Forecast, by Application 2020 & 2033
- Table 61: Rest of Middle East and Africa High Purity Quartz Market Revenue (Million) Forecast, by Application 2020 & 2033
- Table 62: Rest of Middle East and Africa High Purity Quartz Market Volume (K Tons) Forecast, by Application 2020 & 2033
Frequently Asked Questions
1. What is the projected Compound Annual Growth Rate (CAGR) of the High Purity Quartz Market?
The projected CAGR is approximately > 4.50%.
2. Which companies are prominent players in the High Purity Quartz Market?
Key companies in the market include Jiangsu Pacific Quartz Co Ltd, American Elements, Covia Holdings LLC, Momentive Technologies, Sibelco, Imerys, ULTRA HPQ, Russian Quartz LLC, Australian Silica Quartz Group Ltd, The Quartz Corp.
3. What are the main segments of the High Purity Quartz Market?
The market segments include Application.
4. Can you provide details about the market size?
The market size is estimated to be USD 672.93 Million as of 2022.
5. What are some drivers contributing to market growth?
Growing Demand for Semiconductor ICs; Increasing Adoption in Solar Industry; Other Drivers.
6. What are the notable trends driving market growth?
Growing Demand from Semiconductor Industry.
7. Are there any restraints impacting market growth?
The Fluctuating Prices of Raw Materials; Other Restraints.
8. Can you provide examples of recent developments in the market?
April 2023: Sibelco announced an investment of approx. USD 200 million to double high purity quartz (HPQ) installed capacity at its Spruce Pine facility in North Carolina, United States.
9. What pricing options are available for accessing the report?
Pricing options include single-user, multi-user, and enterprise licenses priced at USD 4750, USD 5250, and USD 8750 respectively.
10. Is the market size provided in terms of value or volume?
The market size is provided in terms of value, measured in Million and volume, measured in K Tons.
11. Are there any specific market keywords associated with the report?
Yes, the market keyword associated with the report is "High Purity Quartz Market," which aids in identifying and referencing the specific market segment covered.
12. How do I determine which pricing option suits my needs best?
The pricing options vary based on user requirements and access needs. Individual users may opt for single-user licenses, while businesses requiring broader access may choose multi-user or enterprise licenses for cost-effective access to the report.
13. Are there any additional resources or data provided in the High Purity Quartz Market report?
While the report offers comprehensive insights, it's advisable to review the specific contents or supplementary materials provided to ascertain if additional resources or data are available.
14. How can I stay updated on further developments or reports in the High Purity Quartz Market?
To stay informed about further developments, trends, and reports in the High Purity Quartz Market, consider subscribing to industry newsletters, following relevant companies and organizations, or regularly checking reputable industry news sources and publications.
Methodology
Step 1 - Identification of Relevant Samples Size from Population Database


Step 2 - Approaches for Defining Global Market Size (Value, Volume* & Price*)

Note*: In applicable scenarios
Step 3 - Data Sources
Primary Research
- Web Analytics
- Survey Reports
- Research Institute
- Latest Research Reports
- Opinion Leaders
Secondary Research
- Annual Reports
- White Paper
- Latest Press Release
- Industry Association
- Paid Database
- Investor Presentations

Step 4 - Data Triangulation
Involves using different sources of information in order to increase the validity of a study
These sources are likely to be stakeholders in a program - participants, other researchers, program staff, other community members, and so on.
Then we put all data in single framework & apply various statistical tools to find out the dynamic on the market.
During the analysis stage, feedback from the stakeholder groups would be compared to determine areas of agreement as well as areas of divergence