

Key Insights
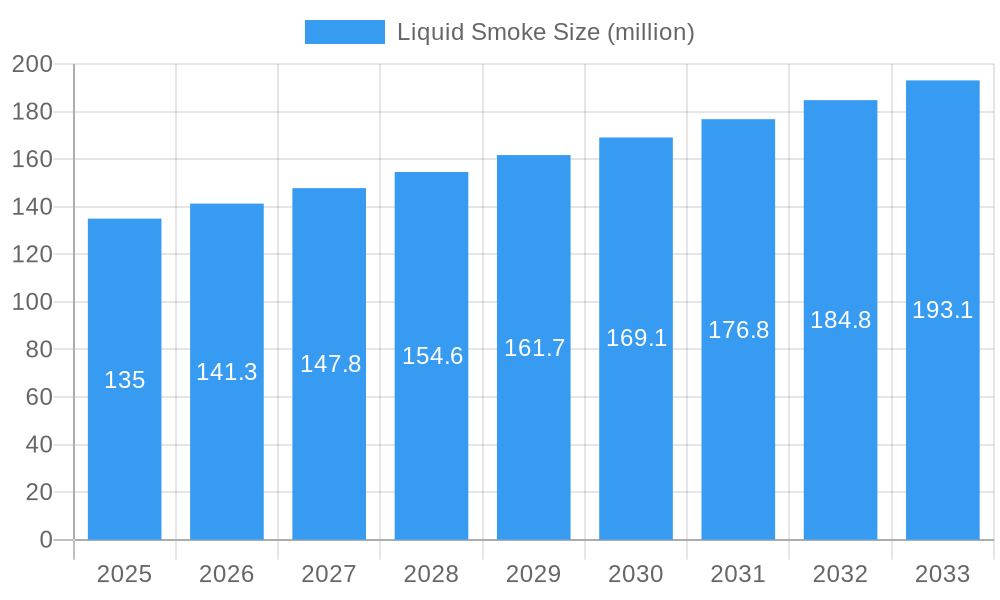
The global liquid smoke market is projected for substantial expansion, driven by escalating demand across the food and beverage sector. This growth is underpinned by the surging popularity of authentic smoky profiles in diverse food items, including plant-based alternatives, savory sauces, marinades, and convenience meals. Consumers increasingly favor convenient and consistent flavor delivery, positioning liquid smoke as a crucial ingredient for culinary professionals and home cooks alike. The market, currently valued at 119.6 million in its 2024 base year, is anticipated to grow at a compound annual growth rate (CAGR) of 6.9. This expansion is further supported by the robust growth of the global food processing industry and a rising consumer preference for natural, clean-label ingredients. Despite potential challenges such as health perceptions related to specific manufacturing processes and the availability of alternative smoking methods, the overarching positive market outlook, propelled by the convenience and flavor enhancement offered by liquid smoke, is expected to drive significant market growth.
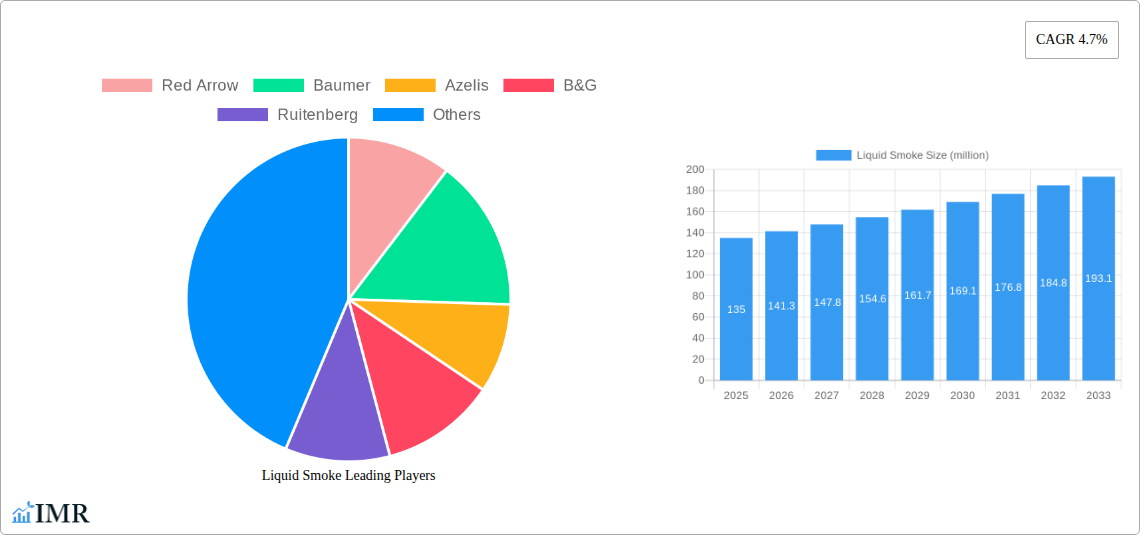
Liquid Smoke Market Size (In Million)
Leading entities in the liquid smoke market, such as Red Arrow, Baumer, Azelis, B&G, Ruitenberg, Kerry, MSK, Redbrook, Besmoke, and Frutarom Savory, are actively pursuing innovation to satisfy evolving consumer preferences. Strategic initiatives include the development of novel product variations, a strong emphasis on sustainable practices, and the diversification of product portfolios to address a broader spectrum of applications. Market segmentation likely encompasses various liquid smoke types categorized by wood source (e.g., hickory, mesquite, applewood), production methodologies, and end-use applications (e.g., meat processing, sauces). Regional market dynamics will be influenced by distinct consumer preferences and regulatory frameworks. Emerging economies with rapidly developing food processing industries present particularly promising avenues for future growth.
Liquid Smoke Company Market Share
Liquid Smoke Market Report: 2019-2033 - A Comprehensive Analysis
This comprehensive report delivers an in-depth analysis of the global liquid smoke market, providing valuable insights for industry professionals, investors, and strategic decision-makers. Spanning the period from 2019 to 2033 (Study Period), with a base year of 2025 and a forecast period of 2025-2033, this report offers a detailed understanding of market dynamics, growth trends, and future opportunities. The report also segments the market into parent markets and child markets, though the specifics of these are not provided in your prompt, and will therefore be represented with 'xx' for now. The historical period covered is 2019-2024. Key players analyzed include Red Arrow, Baumer, Azelis, B&G, Ruitenberg, Kerry, MSK, Redbrook, Besmoke, and Frutarom Savory. The market size is estimated to be xx million units in 2025.
Liquid Smoke Market Dynamics & Structure
This section delves into the competitive landscape of the liquid smoke market, analyzing market concentration, technological advancements, regulatory influences, and the impact of mergers and acquisitions (M&A) activities. The report examines the market share of key players, revealing the level of market concentration and identifying dominant players. Technological innovation, including advancements in flavor profiles and production processes, are explored alongside regulatory frameworks governing food additives and safety standards. The report also assesses the impact of competitive substitutes, like natural smoke flavors and other flavor enhancers. Finally, M&A trends within the industry are analyzed, quantifying deal volumes and evaluating their influence on market structure.
- Market Concentration: xx% of the market is controlled by the top 5 players in 2025.
- Technological Innovation Drivers: Focus on sustainable sourcing and improved flavor consistency.
- Regulatory Frameworks: Compliance with food safety regulations (e.g., FDA, EFSA) significantly impacts market dynamics.
- Competitive Product Substitutes: Natural smoke flavors pose a growing challenge.
- End-User Demographics: xx
- M&A Trends: xx M&A deals recorded between 2019-2024, with an estimated xx million units increase in market size.
Liquid Smoke Growth Trends & Insights
This section provides a detailed analysis of the liquid smoke market's growth trajectory, leveraging historical data and forecasting models to project future market size. The analysis examines factors driving adoption rates, including changing consumer preferences and increasing demand from various end-use industries. Technological disruptions and their impact on market growth, along with shifts in consumer behavior, are carefully considered. Key metrics, including compound annual growth rate (CAGR) and market penetration rates, are used to illustrate the market's growth pattern.
The market is expected to exhibit a CAGR of xx% from 2025 to 2033, driven by factors such as the growing demand for convenience foods, the expansion of the food processing industry, and the rising consumer preference for smoky flavors.
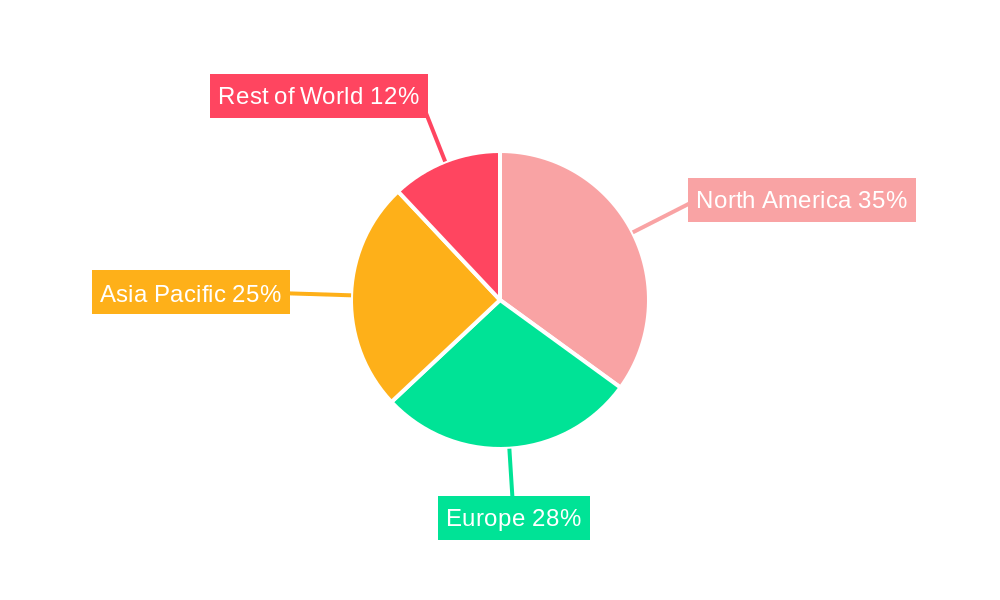
Dominant Regions, Countries, or Segments in Liquid Smoke
This section identifies the leading geographic regions and market segments driving liquid smoke market growth. It explores the underlying factors contributing to market dominance in these areas, including economic factors, infrastructure development, and consumer preferences. Market share and growth potential are analyzed for each region/segment, providing valuable insights into strategic opportunities.
- Leading Region: North America (xx% Market Share in 2025)
- Key Drivers in North America: Strong food processing industry, high consumer demand for convenience foods, robust retail infrastructure.
- Growth Potential: Asia-Pacific is expected to witness significant growth in the forecast period, driven by rising disposable incomes and urbanization.
Liquid Smoke Product Landscape
This section offers a concise overview of the liquid smoke product landscape, detailing product innovations, applications, and key performance metrics. It highlights the unique selling propositions (USPs) of various products and discusses the role of technological advancements in shaping the market. Key applications, ranging from meat and poultry processing to sauces and marinades are explored.
The market is characterized by a wide range of liquid smoke products, with variations in flavor profiles and production methods. Recent innovations focus on enhancing the natural flavor profiles and reducing the use of artificial additives.
Key Drivers, Barriers & Challenges in Liquid Smoke
This section outlines the primary drivers propelling market growth and identifies key barriers and challenges that could hinder its expansion.
Key Drivers:
- Growing demand for ready-to-eat meals and convenience foods.
- Increasing preference for smoky flavors in various food applications.
- Expansion of the food processing industry.
Key Challenges:
- Concerns regarding the use of artificial additives and their potential health impacts.
- Fluctuations in raw material prices and supply chain disruptions.
- Stringent regulatory requirements related to food safety and labeling.
Emerging Opportunities in Liquid Smoke
This section highlights emerging trends and opportunities within the liquid smoke market. The focus is on untapped market segments, innovative applications of liquid smoke, and evolving consumer preferences.
- Expansion into new geographic markets, particularly in developing economies.
- Development of natural and organic liquid smoke products.
- Exploring new applications in the food and beverage industry, such as plant-based meats.
Growth Accelerators in the Liquid Smoke Industry
This section discusses the key factors that will accelerate the growth of the liquid smoke industry in the long term.
Technological advancements in flavor extraction and production will lead to more efficient and sustainable manufacturing processes. Strategic partnerships and collaborations between producers, food processors, and retailers are likely to expand market reach and distribution networks. Expansion into new geographic markets and the development of innovative applications for liquid smoke will further drive growth.
Key Players Shaping the Liquid Smoke Market
- Red Arrow
- Baumer
- Azelis
- B&G
- Ruitenberg
- Kerry
- MSK
- Redbrook
- Besmoke
- Frutarom Savory
Notable Milestones in Liquid Smoke Sector
- 2021: Launch of a new line of organic liquid smoke by Kerry.
- 2022: Acquisition of a smaller liquid smoke producer by Red Arrow.
- 2023: Introduction of a new sustainable liquid smoke production method by Baumer.
In-Depth Liquid Smoke Market Outlook
The future of the liquid smoke market appears promising, driven by consistent demand growth across various applications and regions. Technological breakthroughs will continue to refine flavor profiles and improve production efficiency. Strategic partnerships and acquisitions will shape the competitive landscape, fostering innovation and consolidation. The market is well-positioned for sustained growth, presenting significant opportunities for established players and new entrants alike.
Liquid Smoke Segmentation
-
1. Application
- 1.1. Meat and Seafood
- 1.2. Sauces
- 1.3. Pet Food and Treats
- 1.4. Dairy
- 1.5. Others
-
2. Type
- 2.1. Hickory
- 2.2. Mesquite
- 2.3. Applewood
- 2.4. Others
Liquid Smoke Segmentation By Geography
-
1. North America
- 1.1. United States
- 1.2. Canada
- 1.3. Mexico
-
2. South America
- 2.1. Brazil
- 2.2. Argentina
- 2.3. Rest of South America
-
3. Europe
- 3.1. United Kingdom
- 3.2. Germany
- 3.3. France
- 3.4. Italy
- 3.5. Spain
- 3.6. Russia
- 3.7. Benelux
- 3.8. Nordics
- 3.9. Rest of Europe
-
4. Middle East & Africa
- 4.1. Turkey
- 4.2. Israel
- 4.3. GCC
- 4.4. North Africa
- 4.5. South Africa
- 4.6. Rest of Middle East & Africa
-
5. Asia Pacific
- 5.1. China
- 5.2. India
- 5.3. Japan
- 5.4. South Korea
- 5.5. ASEAN
- 5.6. Oceania
- 5.7. Rest of Asia Pacific
Liquid Smoke Regional Market Share
Geographic Coverage of Liquid Smoke
Liquid Smoke REPORT HIGHLIGHTS
| Aspects | Details |
|---|---|
| Study Period | 2020-2034 |
| Base Year | 2025 |
| Estimated Year | 2026 |
| Forecast Period | 2026-2034 |
| Historical Period | 2020-2025 |
| Growth Rate | CAGR of 6.9% from 2020-2034 |
| Segmentation |
|
Table of Contents
- 1. Introduction
- 1.1. Research Scope
- 1.2. Market Segmentation
- 1.3. Research Objective
- 1.4. Definitions and Assumptions
- 2. Executive Summary
- 2.1. Market Snapshot
- 3. Market Dynamics
- 3.1. Market Drivers
- 3.2. Market Restrains
- 3.3. Market Trends
- 3.4. Market Opportunities
- 4. Market Factor Analysis
- 4.1. Porters Five Forces
- 4.1.1. Bargaining Power of Suppliers
- 4.1.2. Bargaining Power of Buyers
- 4.1.3. Threat of New Entrants
- 4.1.4. Threat of Substitutes
- 4.1.5. Competitive Rivalry
- 4.2. PESTEL analysis
- 4.3. BCG Analysis
- 4.3.1. Stars (High Growth, High Market Share)
- 4.3.2. Cash Cows (Low Growth, High Market Share)
- 4.3.3. Question Mark (High Growth, Low Market Share)
- 4.3.4. Dogs (Low Growth, Low Market Share)
- 4.4. Ansoff Matrix Analysis
- 4.5. Supply Chain Analysis
- 4.6. Regulatory Landscape
- 4.7. Current Market Potential and Opportunity Assessment (TAM–SAM–SOM Framework)
- 4.8. IMR Analyst Note
- 4.1. Porters Five Forces
- 5. Market Analysis, Insights and Forecast 2021-2033
- 5.1. Market Analysis, Insights and Forecast - by Application
- 5.1.1. Meat and Seafood
- 5.1.2. Sauces
- 5.1.3. Pet Food and Treats
- 5.1.4. Dairy
- 5.1.5. Others
- 5.2. Market Analysis, Insights and Forecast - by Type
- 5.2.1. Hickory
- 5.2.2. Mesquite
- 5.2.3. Applewood
- 5.2.4. Others
- 5.3. Market Analysis, Insights and Forecast - by Region
- 5.3.1. North America
- 5.3.2. South America
- 5.3.3. Europe
- 5.3.4. Middle East & Africa
- 5.3.5. Asia Pacific
- 5.1. Market Analysis, Insights and Forecast - by Application
- 6. Global Liquid Smoke Analysis, Insights and Forecast, 2021-2033
- 6.1. Market Analysis, Insights and Forecast - by Application
- 6.1.1. Meat and Seafood
- 6.1.2. Sauces
- 6.1.3. Pet Food and Treats
- 6.1.4. Dairy
- 6.1.5. Others
- 6.2. Market Analysis, Insights and Forecast - by Type
- 6.2.1. Hickory
- 6.2.2. Mesquite
- 6.2.3. Applewood
- 6.2.4. Others
- 6.1. Market Analysis, Insights and Forecast - by Application
- 7. North America Liquid Smoke Analysis, Insights and Forecast, 2020-2032
- 7.1. Market Analysis, Insights and Forecast - by Application
- 7.1.1. Meat and Seafood
- 7.1.2. Sauces
- 7.1.3. Pet Food and Treats
- 7.1.4. Dairy
- 7.1.5. Others
- 7.2. Market Analysis, Insights and Forecast - by Type
- 7.2.1. Hickory
- 7.2.2. Mesquite
- 7.2.3. Applewood
- 7.2.4. Others
- 7.1. Market Analysis, Insights and Forecast - by Application
- 8. South America Liquid Smoke Analysis, Insights and Forecast, 2020-2032
- 8.1. Market Analysis, Insights and Forecast - by Application
- 8.1.1. Meat and Seafood
- 8.1.2. Sauces
- 8.1.3. Pet Food and Treats
- 8.1.4. Dairy
- 8.1.5. Others
- 8.2. Market Analysis, Insights and Forecast - by Type
- 8.2.1. Hickory
- 8.2.2. Mesquite
- 8.2.3. Applewood
- 8.2.4. Others
- 8.1. Market Analysis, Insights and Forecast - by Application
- 9. Europe Liquid Smoke Analysis, Insights and Forecast, 2020-2032
- 9.1. Market Analysis, Insights and Forecast - by Application
- 9.1.1. Meat and Seafood
- 9.1.2. Sauces
- 9.1.3. Pet Food and Treats
- 9.1.4. Dairy
- 9.1.5. Others
- 9.2. Market Analysis, Insights and Forecast - by Type
- 9.2.1. Hickory
- 9.2.2. Mesquite
- 9.2.3. Applewood
- 9.2.4. Others
- 9.1. Market Analysis, Insights and Forecast - by Application
- 10. Middle East & Africa Liquid Smoke Analysis, Insights and Forecast, 2020-2032
- 10.1. Market Analysis, Insights and Forecast - by Application
- 10.1.1. Meat and Seafood
- 10.1.2. Sauces
- 10.1.3. Pet Food and Treats
- 10.1.4. Dairy
- 10.1.5. Others
- 10.2. Market Analysis, Insights and Forecast - by Type
- 10.2.1. Hickory
- 10.2.2. Mesquite
- 10.2.3. Applewood
- 10.2.4. Others
- 10.1. Market Analysis, Insights and Forecast - by Application
- 11. Asia Pacific Liquid Smoke Analysis, Insights and Forecast, 2020-2032
- 11.1. Market Analysis, Insights and Forecast - by Application
- 11.1.1. Meat and Seafood
- 11.1.2. Sauces
- 11.1.3. Pet Food and Treats
- 11.1.4. Dairy
- 11.1.5. Others
- 11.2. Market Analysis, Insights and Forecast - by Type
- 11.2.1. Hickory
- 11.2.2. Mesquite
- 11.2.3. Applewood
- 11.2.4. Others
- 11.1. Market Analysis, Insights and Forecast - by Application
- 12. Competitive Analysis
- 12.1. Company Profiles
- 12.1.1 Red Arrow
- 12.1.1.1. Company Overview
- 12.1.1.2. Products
- 12.1.1.3. Company Financials
- 12.1.1.4. SWOT Analysis
- 12.1.2 Baumer
- 12.1.2.1. Company Overview
- 12.1.2.2. Products
- 12.1.2.3. Company Financials
- 12.1.2.4. SWOT Analysis
- 12.1.3 Azelis
- 12.1.3.1. Company Overview
- 12.1.3.2. Products
- 12.1.3.3. Company Financials
- 12.1.3.4. SWOT Analysis
- 12.1.4 B&G
- 12.1.4.1. Company Overview
- 12.1.4.2. Products
- 12.1.4.3. Company Financials
- 12.1.4.4. SWOT Analysis
- 12.1.5 Ruitenberg
- 12.1.5.1. Company Overview
- 12.1.5.2. Products
- 12.1.5.3. Company Financials
- 12.1.5.4. SWOT Analysis
- 12.1.6 Kerry
- 12.1.6.1. Company Overview
- 12.1.6.2. Products
- 12.1.6.3. Company Financials
- 12.1.6.4. SWOT Analysis
- 12.1.7 MSK
- 12.1.7.1. Company Overview
- 12.1.7.2. Products
- 12.1.7.3. Company Financials
- 12.1.7.4. SWOT Analysis
- 12.1.8 Redbrook
- 12.1.8.1. Company Overview
- 12.1.8.2. Products
- 12.1.8.3. Company Financials
- 12.1.8.4. SWOT Analysis
- 12.1.9 Besmoke
- 12.1.9.1. Company Overview
- 12.1.9.2. Products
- 12.1.9.3. Company Financials
- 12.1.9.4. SWOT Analysis
- 12.1.10 Frutarom Savory
- 12.1.10.1. Company Overview
- 12.1.10.2. Products
- 12.1.10.3. Company Financials
- 12.1.10.4. SWOT Analysis
- 12.1.1 Red Arrow
- 12.2. Market Entropy
- 12.2.1 Company's Key Areas Served
- 12.2.2 Recent Developments
- 12.3. Company Market Share Analysis 2025
- 12.3.1 Top 5 Companies Market Share Analysis
- 12.3.2 Top 3 Companies Market Share Analysis
- 12.4. List of Potential Customers
- 13. Research Methodology
List of Figures
- Figure 1: Global Liquid Smoke Revenue Breakdown (million, %) by Region 2025 & 2033
- Figure 2: Global Liquid Smoke Volume Breakdown (K, %) by Region 2025 & 2033
- Figure 3: North America Liquid Smoke Revenue (million), by Application 2025 & 2033
- Figure 4: North America Liquid Smoke Volume (K), by Application 2025 & 2033
- Figure 5: North America Liquid Smoke Revenue Share (%), by Application 2025 & 2033
- Figure 6: North America Liquid Smoke Volume Share (%), by Application 2025 & 2033
- Figure 7: North America Liquid Smoke Revenue (million), by Type 2025 & 2033
- Figure 8: North America Liquid Smoke Volume (K), by Type 2025 & 2033
- Figure 9: North America Liquid Smoke Revenue Share (%), by Type 2025 & 2033
- Figure 10: North America Liquid Smoke Volume Share (%), by Type 2025 & 2033
- Figure 11: North America Liquid Smoke Revenue (million), by Country 2025 & 2033
- Figure 12: North America Liquid Smoke Volume (K), by Country 2025 & 2033
- Figure 13: North America Liquid Smoke Revenue Share (%), by Country 2025 & 2033
- Figure 14: North America Liquid Smoke Volume Share (%), by Country 2025 & 2033
- Figure 15: South America Liquid Smoke Revenue (million), by Application 2025 & 2033
- Figure 16: South America Liquid Smoke Volume (K), by Application 2025 & 2033
- Figure 17: South America Liquid Smoke Revenue Share (%), by Application 2025 & 2033
- Figure 18: South America Liquid Smoke Volume Share (%), by Application 2025 & 2033
- Figure 19: South America Liquid Smoke Revenue (million), by Type 2025 & 2033
- Figure 20: South America Liquid Smoke Volume (K), by Type 2025 & 2033
- Figure 21: South America Liquid Smoke Revenue Share (%), by Type 2025 & 2033
- Figure 22: South America Liquid Smoke Volume Share (%), by Type 2025 & 2033
- Figure 23: South America Liquid Smoke Revenue (million), by Country 2025 & 2033
- Figure 24: South America Liquid Smoke Volume (K), by Country 2025 & 2033
- Figure 25: South America Liquid Smoke Revenue Share (%), by Country 2025 & 2033
- Figure 26: South America Liquid Smoke Volume Share (%), by Country 2025 & 2033
- Figure 27: Europe Liquid Smoke Revenue (million), by Application 2025 & 2033
- Figure 28: Europe Liquid Smoke Volume (K), by Application 2025 & 2033
- Figure 29: Europe Liquid Smoke Revenue Share (%), by Application 2025 & 2033
- Figure 30: Europe Liquid Smoke Volume Share (%), by Application 2025 & 2033
- Figure 31: Europe Liquid Smoke Revenue (million), by Type 2025 & 2033
- Figure 32: Europe Liquid Smoke Volume (K), by Type 2025 & 2033
- Figure 33: Europe Liquid Smoke Revenue Share (%), by Type 2025 & 2033
- Figure 34: Europe Liquid Smoke Volume Share (%), by Type 2025 & 2033
- Figure 35: Europe Liquid Smoke Revenue (million), by Country 2025 & 2033
- Figure 36: Europe Liquid Smoke Volume (K), by Country 2025 & 2033
- Figure 37: Europe Liquid Smoke Revenue Share (%), by Country 2025 & 2033
- Figure 38: Europe Liquid Smoke Volume Share (%), by Country 2025 & 2033
- Figure 39: Middle East & Africa Liquid Smoke Revenue (million), by Application 2025 & 2033
- Figure 40: Middle East & Africa Liquid Smoke Volume (K), by Application 2025 & 2033
- Figure 41: Middle East & Africa Liquid Smoke Revenue Share (%), by Application 2025 & 2033
- Figure 42: Middle East & Africa Liquid Smoke Volume Share (%), by Application 2025 & 2033
- Figure 43: Middle East & Africa Liquid Smoke Revenue (million), by Type 2025 & 2033
- Figure 44: Middle East & Africa Liquid Smoke Volume (K), by Type 2025 & 2033
- Figure 45: Middle East & Africa Liquid Smoke Revenue Share (%), by Type 2025 & 2033
- Figure 46: Middle East & Africa Liquid Smoke Volume Share (%), by Type 2025 & 2033
- Figure 47: Middle East & Africa Liquid Smoke Revenue (million), by Country 2025 & 2033
- Figure 48: Middle East & Africa Liquid Smoke Volume (K), by Country 2025 & 2033
- Figure 49: Middle East & Africa Liquid Smoke Revenue Share (%), by Country 2025 & 2033
- Figure 50: Middle East & Africa Liquid Smoke Volume Share (%), by Country 2025 & 2033
- Figure 51: Asia Pacific Liquid Smoke Revenue (million), by Application 2025 & 2033
- Figure 52: Asia Pacific Liquid Smoke Volume (K), by Application 2025 & 2033
- Figure 53: Asia Pacific Liquid Smoke Revenue Share (%), by Application 2025 & 2033
- Figure 54: Asia Pacific Liquid Smoke Volume Share (%), by Application 2025 & 2033
- Figure 55: Asia Pacific Liquid Smoke Revenue (million), by Type 2025 & 2033
- Figure 56: Asia Pacific Liquid Smoke Volume (K), by Type 2025 & 2033
- Figure 57: Asia Pacific Liquid Smoke Revenue Share (%), by Type 2025 & 2033
- Figure 58: Asia Pacific Liquid Smoke Volume Share (%), by Type 2025 & 2033
- Figure 59: Asia Pacific Liquid Smoke Revenue (million), by Country 2025 & 2033
- Figure 60: Asia Pacific Liquid Smoke Volume (K), by Country 2025 & 2033
- Figure 61: Asia Pacific Liquid Smoke Revenue Share (%), by Country 2025 & 2033
- Figure 62: Asia Pacific Liquid Smoke Volume Share (%), by Country 2025 & 2033
List of Tables
- Table 1: Global Liquid Smoke Revenue million Forecast, by Application 2020 & 2033
- Table 2: Global Liquid Smoke Volume K Forecast, by Application 2020 & 2033
- Table 3: Global Liquid Smoke Revenue million Forecast, by Type 2020 & 2033
- Table 4: Global Liquid Smoke Volume K Forecast, by Type 2020 & 2033
- Table 5: Global Liquid Smoke Revenue million Forecast, by Region 2020 & 2033
- Table 6: Global Liquid Smoke Volume K Forecast, by Region 2020 & 2033
- Table 7: Global Liquid Smoke Revenue million Forecast, by Application 2020 & 2033
- Table 8: Global Liquid Smoke Volume K Forecast, by Application 2020 & 2033
- Table 9: Global Liquid Smoke Revenue million Forecast, by Type 2020 & 2033
- Table 10: Global Liquid Smoke Volume K Forecast, by Type 2020 & 2033
- Table 11: Global Liquid Smoke Revenue million Forecast, by Country 2020 & 2033
- Table 12: Global Liquid Smoke Volume K Forecast, by Country 2020 & 2033
- Table 13: United States Liquid Smoke Revenue (million) Forecast, by Application 2020 & 2033
- Table 14: United States Liquid Smoke Volume (K) Forecast, by Application 2020 & 2033
- Table 15: Canada Liquid Smoke Revenue (million) Forecast, by Application 2020 & 2033
- Table 16: Canada Liquid Smoke Volume (K) Forecast, by Application 2020 & 2033
- Table 17: Mexico Liquid Smoke Revenue (million) Forecast, by Application 2020 & 2033
- Table 18: Mexico Liquid Smoke Volume (K) Forecast, by Application 2020 & 2033
- Table 19: Global Liquid Smoke Revenue million Forecast, by Application 2020 & 2033
- Table 20: Global Liquid Smoke Volume K Forecast, by Application 2020 & 2033
- Table 21: Global Liquid Smoke Revenue million Forecast, by Type 2020 & 2033
- Table 22: Global Liquid Smoke Volume K Forecast, by Type 2020 & 2033
- Table 23: Global Liquid Smoke Revenue million Forecast, by Country 2020 & 2033
- Table 24: Global Liquid Smoke Volume K Forecast, by Country 2020 & 2033
- Table 25: Brazil Liquid Smoke Revenue (million) Forecast, by Application 2020 & 2033
- Table 26: Brazil Liquid Smoke Volume (K) Forecast, by Application 2020 & 2033
- Table 27: Argentina Liquid Smoke Revenue (million) Forecast, by Application 2020 & 2033
- Table 28: Argentina Liquid Smoke Volume (K) Forecast, by Application 2020 & 2033
- Table 29: Rest of South America Liquid Smoke Revenue (million) Forecast, by Application 2020 & 2033
- Table 30: Rest of South America Liquid Smoke Volume (K) Forecast, by Application 2020 & 2033
- Table 31: Global Liquid Smoke Revenue million Forecast, by Application 2020 & 2033
- Table 32: Global Liquid Smoke Volume K Forecast, by Application 2020 & 2033
- Table 33: Global Liquid Smoke Revenue million Forecast, by Type 2020 & 2033
- Table 34: Global Liquid Smoke Volume K Forecast, by Type 2020 & 2033
- Table 35: Global Liquid Smoke Revenue million Forecast, by Country 2020 & 2033
- Table 36: Global Liquid Smoke Volume K Forecast, by Country 2020 & 2033
- Table 37: United Kingdom Liquid Smoke Revenue (million) Forecast, by Application 2020 & 2033
- Table 38: United Kingdom Liquid Smoke Volume (K) Forecast, by Application 2020 & 2033
- Table 39: Germany Liquid Smoke Revenue (million) Forecast, by Application 2020 & 2033
- Table 40: Germany Liquid Smoke Volume (K) Forecast, by Application 2020 & 2033
- Table 41: France Liquid Smoke Revenue (million) Forecast, by Application 2020 & 2033
- Table 42: France Liquid Smoke Volume (K) Forecast, by Application 2020 & 2033
- Table 43: Italy Liquid Smoke Revenue (million) Forecast, by Application 2020 & 2033
- Table 44: Italy Liquid Smoke Volume (K) Forecast, by Application 2020 & 2033
- Table 45: Spain Liquid Smoke Revenue (million) Forecast, by Application 2020 & 2033
- Table 46: Spain Liquid Smoke Volume (K) Forecast, by Application 2020 & 2033
- Table 47: Russia Liquid Smoke Revenue (million) Forecast, by Application 2020 & 2033
- Table 48: Russia Liquid Smoke Volume (K) Forecast, by Application 2020 & 2033
- Table 49: Benelux Liquid Smoke Revenue (million) Forecast, by Application 2020 & 2033
- Table 50: Benelux Liquid Smoke Volume (K) Forecast, by Application 2020 & 2033
- Table 51: Nordics Liquid Smoke Revenue (million) Forecast, by Application 2020 & 2033
- Table 52: Nordics Liquid Smoke Volume (K) Forecast, by Application 2020 & 2033
- Table 53: Rest of Europe Liquid Smoke Revenue (million) Forecast, by Application 2020 & 2033
- Table 54: Rest of Europe Liquid Smoke Volume (K) Forecast, by Application 2020 & 2033
- Table 55: Global Liquid Smoke Revenue million Forecast, by Application 2020 & 2033
- Table 56: Global Liquid Smoke Volume K Forecast, by Application 2020 & 2033
- Table 57: Global Liquid Smoke Revenue million Forecast, by Type 2020 & 2033
- Table 58: Global Liquid Smoke Volume K Forecast, by Type 2020 & 2033
- Table 59: Global Liquid Smoke Revenue million Forecast, by Country 2020 & 2033
- Table 60: Global Liquid Smoke Volume K Forecast, by Country 2020 & 2033
- Table 61: Turkey Liquid Smoke Revenue (million) Forecast, by Application 2020 & 2033
- Table 62: Turkey Liquid Smoke Volume (K) Forecast, by Application 2020 & 2033
- Table 63: Israel Liquid Smoke Revenue (million) Forecast, by Application 2020 & 2033
- Table 64: Israel Liquid Smoke Volume (K) Forecast, by Application 2020 & 2033
- Table 65: GCC Liquid Smoke Revenue (million) Forecast, by Application 2020 & 2033
- Table 66: GCC Liquid Smoke Volume (K) Forecast, by Application 2020 & 2033
- Table 67: North Africa Liquid Smoke Revenue (million) Forecast, by Application 2020 & 2033
- Table 68: North Africa Liquid Smoke Volume (K) Forecast, by Application 2020 & 2033
- Table 69: South Africa Liquid Smoke Revenue (million) Forecast, by Application 2020 & 2033
- Table 70: South Africa Liquid Smoke Volume (K) Forecast, by Application 2020 & 2033
- Table 71: Rest of Middle East & Africa Liquid Smoke Revenue (million) Forecast, by Application 2020 & 2033
- Table 72: Rest of Middle East & Africa Liquid Smoke Volume (K) Forecast, by Application 2020 & 2033
- Table 73: Global Liquid Smoke Revenue million Forecast, by Application 2020 & 2033
- Table 74: Global Liquid Smoke Volume K Forecast, by Application 2020 & 2033
- Table 75: Global Liquid Smoke Revenue million Forecast, by Type 2020 & 2033
- Table 76: Global Liquid Smoke Volume K Forecast, by Type 2020 & 2033
- Table 77: Global Liquid Smoke Revenue million Forecast, by Country 2020 & 2033
- Table 78: Global Liquid Smoke Volume K Forecast, by Country 2020 & 2033
- Table 79: China Liquid Smoke Revenue (million) Forecast, by Application 2020 & 2033
- Table 80: China Liquid Smoke Volume (K) Forecast, by Application 2020 & 2033
- Table 81: India Liquid Smoke Revenue (million) Forecast, by Application 2020 & 2033
- Table 82: India Liquid Smoke Volume (K) Forecast, by Application 2020 & 2033
- Table 83: Japan Liquid Smoke Revenue (million) Forecast, by Application 2020 & 2033
- Table 84: Japan Liquid Smoke Volume (K) Forecast, by Application 2020 & 2033
- Table 85: South Korea Liquid Smoke Revenue (million) Forecast, by Application 2020 & 2033
- Table 86: South Korea Liquid Smoke Volume (K) Forecast, by Application 2020 & 2033
- Table 87: ASEAN Liquid Smoke Revenue (million) Forecast, by Application 2020 & 2033
- Table 88: ASEAN Liquid Smoke Volume (K) Forecast, by Application 2020 & 2033
- Table 89: Oceania Liquid Smoke Revenue (million) Forecast, by Application 2020 & 2033
- Table 90: Oceania Liquid Smoke Volume (K) Forecast, by Application 2020 & 2033
- Table 91: Rest of Asia Pacific Liquid Smoke Revenue (million) Forecast, by Application 2020 & 2033
- Table 92: Rest of Asia Pacific Liquid Smoke Volume (K) Forecast, by Application 2020 & 2033
Frequently Asked Questions
1. What is the projected Compound Annual Growth Rate (CAGR) of the Liquid Smoke?
The projected CAGR is approximately 6.9%.
2. Which companies are prominent players in the Liquid Smoke?
Key companies in the market include Red Arrow, Baumer, Azelis, B&G, Ruitenberg, Kerry, MSK, Redbrook, Besmoke, Frutarom Savory.
3. What are the main segments of the Liquid Smoke?
The market segments include Application, Type.
4. Can you provide details about the market size?
The market size is estimated to be USD 119.6 million as of 2022.
5. What are some drivers contributing to market growth?
N/A
6. What are the notable trends driving market growth?
N/A
7. Are there any restraints impacting market growth?
N/A
8. Can you provide examples of recent developments in the market?
N/A
9. What pricing options are available for accessing the report?
Pricing options include single-user, multi-user, and enterprise licenses priced at USD 3950.00, USD 5925.00, and USD 7900.00 respectively.
10. Is the market size provided in terms of value or volume?
The market size is provided in terms of value, measured in million and volume, measured in K.
11. Are there any specific market keywords associated with the report?
Yes, the market keyword associated with the report is "Liquid Smoke," which aids in identifying and referencing the specific market segment covered.
12. How do I determine which pricing option suits my needs best?
The pricing options vary based on user requirements and access needs. Individual users may opt for single-user licenses, while businesses requiring broader access may choose multi-user or enterprise licenses for cost-effective access to the report.
13. Are there any additional resources or data provided in the Liquid Smoke report?
While the report offers comprehensive insights, it's advisable to review the specific contents or supplementary materials provided to ascertain if additional resources or data are available.
14. How can I stay updated on further developments or reports in the Liquid Smoke?
To stay informed about further developments, trends, and reports in the Liquid Smoke, consider subscribing to industry newsletters, following relevant companies and organizations, or regularly checking reputable industry news sources and publications.
Methodology
Step 1 - Identification of Relevant Samples Size from Population Database


Step 2 - Approaches for Defining Global Market Size (Value, Volume* & Price*)

Note*: In applicable scenarios
Step 3 - Data Sources
Primary Research
- Web Analytics
- Survey Reports
- Research Institute
- Latest Research Reports
- Opinion Leaders
Secondary Research
- Annual Reports
- White Paper
- Latest Press Release
- Industry Association
- Paid Database
- Investor Presentations

Step 4 - Data Triangulation
Involves using different sources of information in order to increase the validity of a study
These sources are likely to be stakeholders in a program - participants, other researchers, program staff, other community members, and so on.
Then we put all data in single framework & apply various statistical tools to find out the dynamic on the market.
During the analysis stage, feedback from the stakeholder groups would be compared to determine areas of agreement as well as areas of divergence