

Key Insights
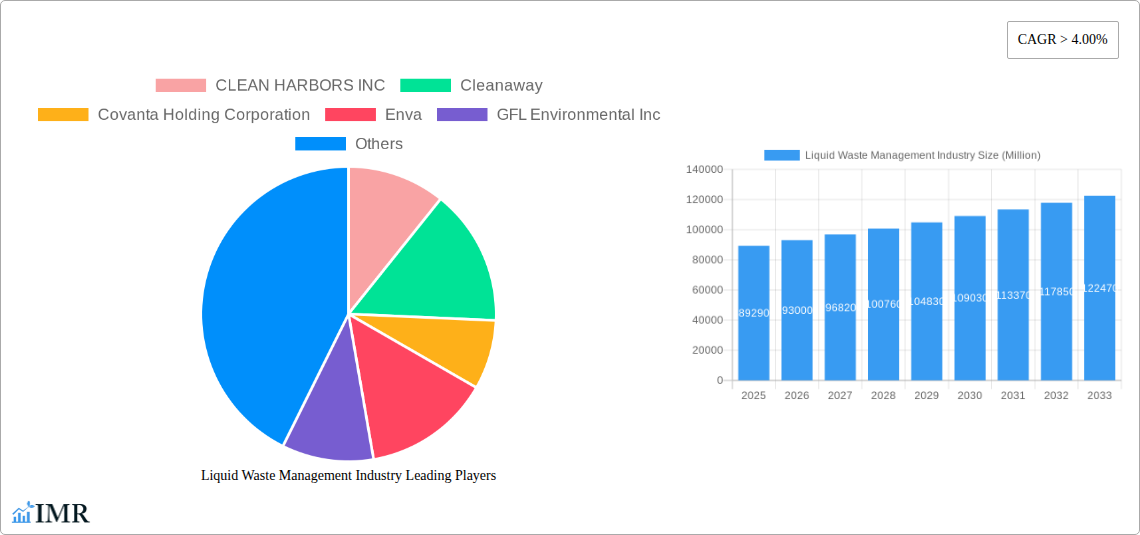
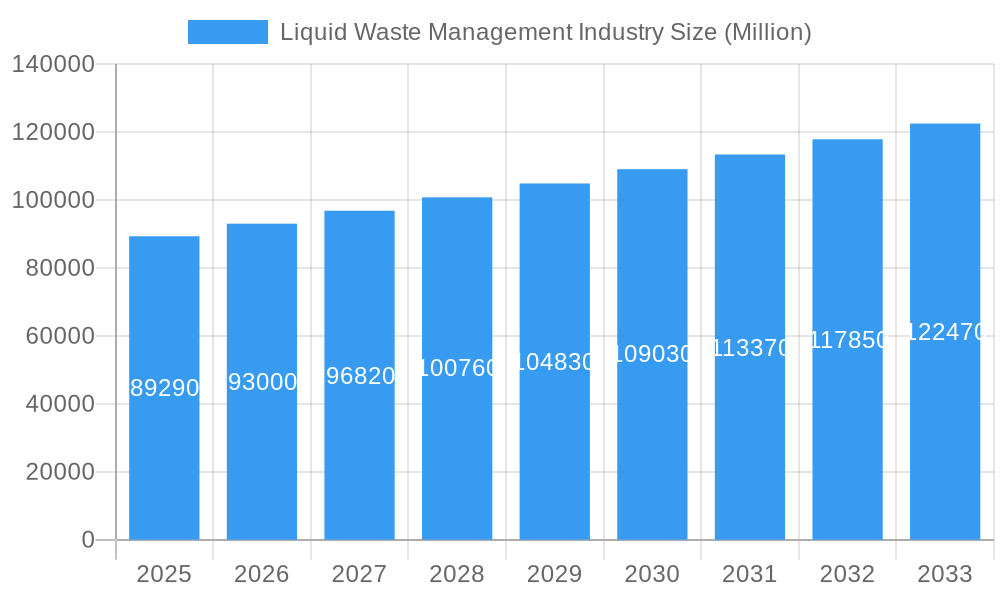
The liquid waste management industry is experiencing robust growth, projected to reach a market size of $89.29 billion in 2025 and maintain a Compound Annual Growth Rate (CAGR) exceeding 4% from 2025 to 2033. This expansion is driven by several key factors. Stringent government regulations regarding wastewater disposal and environmental protection are compelling businesses and municipalities to adopt more sophisticated and sustainable liquid waste management solutions. The increasing industrialization and urbanization across the globe are generating larger volumes of wastewater, necessitating advanced treatment and disposal capabilities. Furthermore, the rising awareness of the environmental impact of improper waste disposal and growing adoption of sustainable practices are fueling demand for eco-friendly technologies within the industry. Leading players such as Clean Harbors, Cleanaway, and Veolia are investing heavily in research and development to innovate treatment methods and improve efficiency, further contributing to market growth.
Liquid Waste Management Industry Market Size (In Billion)
The industry's segmentation is likely diverse, encompassing industrial, municipal, and commercial waste streams. Growth within each segment will be influenced by specific factors; for instance, industrial segments may be driven by the expansion of manufacturing sectors, while municipal segments will be shaped by population growth and infrastructure development. While challenges remain, including the high capital investment required for advanced treatment facilities and potential fluctuations in raw material costs, the long-term outlook for the liquid waste management industry remains positive, fueled by consistent demand and technological innovation. The industry's future success hinges on continuous improvement in efficiency, the adoption of sustainable practices, and the development of technologies capable of handling increasingly complex waste streams.
Liquid Waste Management Industry Company Market Share
Liquid Waste Management Industry Market Report: 2019-2033
This comprehensive report provides an in-depth analysis of the global Liquid Waste Management industry, encompassing market dynamics, growth trends, competitive landscape, and future outlook. With a focus on key players like CLEAN HARBORS INC, Cleanaway, Covanta Holding Corporation, Enva, GFL Environmental Inc, Hulsey (a Blue Flow Company), Ovivo, REMONDIS SE & Co KG, SUEZ, Veolia, and WM Intellectual Property Holdings L L C (list not exhaustive), this report offers invaluable insights for industry professionals, investors, and strategic decision-makers. The report covers the parent market of Waste Management and the child market of Liquid Waste Management, providing a granular view of this crucial sector. Study Period: 2019–2033; Base Year: 2025; Estimated Year: 2025; Forecast Period: 2025–2033; Historical Period: 2019–2024. Market values are presented in millions of units.
Liquid Waste Management Industry Market Dynamics & Structure
The liquid waste management market is characterized by a moderately concentrated structure, with a few large multinational companies holding significant market share. Technological innovation, particularly in areas like advanced treatment technologies and digitalization, is a key driver. Stringent regulatory frameworks, varying by region, significantly influence operational costs and investment strategies. Competitive pressures from substitute technologies and alternative waste disposal methods also shape market dynamics. End-user demographics, including industrial, commercial, and residential sectors, present distinct needs and market segments. Mergers and acquisitions (M&A) activity is frequent, reflecting consolidation trends and strategic expansion within the sector.
- Market Concentration: The top 5 players hold approximately xx% of the global market share (2025).
- Technological Innovation: Advancements in membrane filtration, anaerobic digestion, and resource recovery are driving efficiency gains.
- Regulatory Landscape: Compliance costs associated with discharge permits and environmental regulations are substantial.
- M&A Activity: The past five years witnessed xx M&A deals, valued at approximately $xx million (2019-2024).
- Innovation Barriers: High capital investment requirements and technological complexity can hinder smaller players.
Liquid Waste Management Industry Growth Trends & Insights
The global liquid waste management market is experiencing robust growth, driven by increasing industrialization, urbanization, and stricter environmental regulations. From 2019 to 2024, the market witnessed a CAGR of xx%, reaching a value of $xx million in 2024. This growth is anticipated to continue, with a projected CAGR of xx% from 2025 to 2033, reaching an estimated $xx million by 2033. Technological disruptions, such as the adoption of AI-powered monitoring systems and automated processes, are enhancing efficiency and reducing operational costs. Changing consumer behavior, including increasing environmental awareness and demand for sustainable solutions, is also shaping market trends. Market penetration of advanced treatment technologies is growing at an estimated xx% annually.
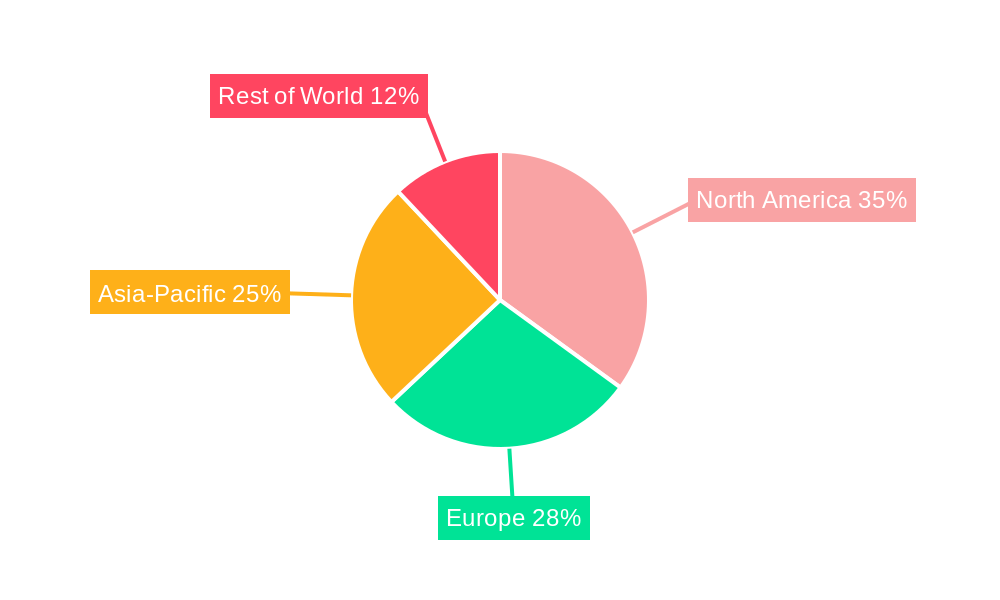
Dominant Regions, Countries, or Segments in Liquid Waste Management Industry
North America and Europe currently dominate the liquid waste management market, driven by robust infrastructure, stringent environmental regulations, and high industrial activity. However, Asia-Pacific is exhibiting the fastest growth, fueled by rapid urbanization and industrial expansion in emerging economies like China and India.
- North America: Strong regulatory environment and high per capita waste generation contribute to market dominance.
- Europe: Well-established infrastructure and a focus on circular economy principles drive market growth.
- Asia-Pacific: Rapid industrialization and urbanization are fueling significant market expansion.
- Key Drivers: Government policies promoting sustainable waste management, improving infrastructure, and increasing industrial activity.
Liquid Waste Management Industry Product Landscape
The liquid waste management product landscape encompasses a wide range of technologies, including wastewater treatment plants, industrial effluent treatment systems, and mobile treatment units. Recent innovations focus on improving treatment efficiency, reducing energy consumption, and maximizing resource recovery (e.g., energy from biogas). Unique selling propositions include enhanced treatment capabilities, reduced environmental impact, and cost-effectiveness.
Key Drivers, Barriers & Challenges in Liquid Waste Management Industry
Key Drivers: Increasing industrialization and urbanization, stringent environmental regulations, growing awareness of water scarcity, and technological advancements in treatment technologies are key drivers.
Challenges: High capital investment costs, complex regulatory compliance, competition from alternative disposal methods, and potential supply chain disruptions (e.g., equipment shortages) pose significant challenges. These challenges can impact profitability and growth, particularly for smaller players. The industry also faces skilled labor shortages and fluctuating energy costs.
Emerging Opportunities in Liquid Waste Management Industry
Emerging opportunities lie in the development of innovative technologies for resource recovery from liquid waste, expansion into underserved markets, and the provision of integrated water and waste management solutions. The increasing focus on circular economy principles creates significant opportunities for developing technologies that transform waste into valuable resources.
Growth Accelerators in the Liquid Waste Management Industry
Technological breakthroughs in advanced oxidation processes, membrane bioreactors, and AI-driven optimization are key growth accelerators. Strategic partnerships between waste management companies and technology providers will further drive innovation and market expansion. Governments' support for sustainable waste management practices and policies promoting resource recovery also accelerate growth.
Key Players Shaping the Liquid Waste Management Industry Market
- CLEAN HARBORS INC
- Cleanaway
- Covanta Holding Corporation
- Enva
- GFL Environmental Inc
- Hulsey (a Blue Flow Company)
- Ovivo
- REMONDIS SE & Co KG
- SUEZ
- Veolia
- WM Intellectual Property Holdings L L C
Notable Milestones in Liquid Waste Management Industry Sector
- October 2023: SUEZ Recycling and Recovery UK acquired Devon Contract Waste (DCW), strengthening its market position.
- September 2023: SUEZ secured contracts for water and waste projects in China, supporting its carbon neutrality goals.
- January 2022: Veolia completed the sale of the new SUEZ, reshaping the industry landscape.
In-Depth Liquid Waste Management Industry Market Outlook
The liquid waste management market is poised for continued growth, driven by ongoing technological advancements, increasing environmental awareness, and supportive government policies. Strategic investments in research and development, along with strategic partnerships and acquisitions, will further shape the industry landscape. The market presents significant opportunities for companies that can offer innovative, sustainable, and cost-effective solutions to address the growing challenges of liquid waste management.
Liquid Waste Management Industry Segmentation
-
1. Source
- 1.1. Residential
- 1.2. Commercial
- 1.3. Industrial
-
2. Service
- 2.1. Collection
- 2.2. Transportation/Hauling
- 2.3. Disposal/Recycling
-
3. End-user Industry
- 3.1. Automotive
- 3.2. Iron and Steel
- 3.3. Oil and Gas
- 3.4. Pharmaceutical
- 3.5. Textile
- 3.6. Other En
Liquid Waste Management Industry Segmentation By Geography
-
1. Asia Pacific
- 1.1. China
- 1.2. India
- 1.3. Japan
- 1.4. South Korea
- 1.5. Rest of Asia Pacific
-
2. North America
- 2.1. United States
- 2.2. Canada
- 2.3. Mexico
-
3. Europe
- 3.1. Germany
- 3.2. United Kingdom
- 3.3. France
- 3.4. Italy
- 3.5. Rest of Europe
-
4. South America
- 4.1. Brazil
- 4.2. Argentina
- 4.3. Rest of South America
-
5. Middle East and Africa
- 5.1. Saudi Arabia
- 5.2. South Africa
- 5.3. Rest of Middle East and Africa
Liquid Waste Management Industry Regional Market Share
Geographic Coverage of Liquid Waste Management Industry
Liquid Waste Management Industry REPORT HIGHLIGHTS
| Aspects | Details |
|---|---|
| Study Period | 2020-2034 |
| Base Year | 2025 |
| Estimated Year | 2026 |
| Forecast Period | 2026-2034 |
| Historical Period | 2020-2025 |
| Growth Rate | CAGR of > 4.00% from 2020-2034 |
| Segmentation |
|
Table of Contents
- 1. Introduction
- 1.1. Research Scope
- 1.2. Market Segmentation
- 1.3. Research Objective
- 1.4. Definitions and Assumptions
- 2. Executive Summary
- 2.1. Market Snapshot
- 3. Market Dynamics
- 3.1. Market Drivers
- 3.2. Market Restrains
- 3.3. Market Trends
- 3.4. Market Opportunities
- 4. Market Factor Analysis
- 4.1. Porters Five Forces
- 4.1.1. Bargaining Power of Suppliers
- 4.1.2. Bargaining Power of Buyers
- 4.1.3. Threat of New Entrants
- 4.1.4. Threat of Substitutes
- 4.1.5. Competitive Rivalry
- 4.2. PESTEL analysis
- 4.3. BCG Analysis
- 4.3.1. Stars (High Growth, High Market Share)
- 4.3.2. Cash Cows (Low Growth, High Market Share)
- 4.3.3. Question Mark (High Growth, Low Market Share)
- 4.3.4. Dogs (Low Growth, Low Market Share)
- 4.4. Ansoff Matrix Analysis
- 4.5. Supply Chain Analysis
- 4.6. Regulatory Landscape
- 4.7. Current Market Potential and Opportunity Assessment (TAM–SAM–SOM Framework)
- 4.8. IMR Analyst Note
- 4.1. Porters Five Forces
- 5. Market Analysis, Insights and Forecast 2021-2033
- 5.1. Market Analysis, Insights and Forecast - by Source
- 5.1.1. Residential
- 5.1.2. Commercial
- 5.1.3. Industrial
- 5.2. Market Analysis, Insights and Forecast - by Service
- 5.2.1. Collection
- 5.2.2. Transportation/Hauling
- 5.2.3. Disposal/Recycling
- 5.3. Market Analysis, Insights and Forecast - by End-user Industry
- 5.3.1. Automotive
- 5.3.2. Iron and Steel
- 5.3.3. Oil and Gas
- 5.3.4. Pharmaceutical
- 5.3.5. Textile
- 5.3.6. Other En
- 5.4. Market Analysis, Insights and Forecast - by Region
- 5.4.1. Asia Pacific
- 5.4.2. North America
- 5.4.3. Europe
- 5.4.4. South America
- 5.4.5. Middle East and Africa
- 5.1. Market Analysis, Insights and Forecast - by Source
- 6. Global Liquid Waste Management Industry Analysis, Insights and Forecast, 2021-2033
- 6.1. Market Analysis, Insights and Forecast - by Source
- 6.1.1. Residential
- 6.1.2. Commercial
- 6.1.3. Industrial
- 6.2. Market Analysis, Insights and Forecast - by Service
- 6.2.1. Collection
- 6.2.2. Transportation/Hauling
- 6.2.3. Disposal/Recycling
- 6.3. Market Analysis, Insights and Forecast - by End-user Industry
- 6.3.1. Automotive
- 6.3.2. Iron and Steel
- 6.3.3. Oil and Gas
- 6.3.4. Pharmaceutical
- 6.3.5. Textile
- 6.3.6. Other En
- 6.1. Market Analysis, Insights and Forecast - by Source
- 7. Asia Pacific Liquid Waste Management Industry Analysis, Insights and Forecast, 2020-2032
- 7.1. Market Analysis, Insights and Forecast - by Source
- 7.1.1. Residential
- 7.1.2. Commercial
- 7.1.3. Industrial
- 7.2. Market Analysis, Insights and Forecast - by Service
- 7.2.1. Collection
- 7.2.2. Transportation/Hauling
- 7.2.3. Disposal/Recycling
- 7.3. Market Analysis, Insights and Forecast - by End-user Industry
- 7.3.1. Automotive
- 7.3.2. Iron and Steel
- 7.3.3. Oil and Gas
- 7.3.4. Pharmaceutical
- 7.3.5. Textile
- 7.3.6. Other En
- 7.1. Market Analysis, Insights and Forecast - by Source
- 8. North America Liquid Waste Management Industry Analysis, Insights and Forecast, 2020-2032
- 8.1. Market Analysis, Insights and Forecast - by Source
- 8.1.1. Residential
- 8.1.2. Commercial
- 8.1.3. Industrial
- 8.2. Market Analysis, Insights and Forecast - by Service
- 8.2.1. Collection
- 8.2.2. Transportation/Hauling
- 8.2.3. Disposal/Recycling
- 8.3. Market Analysis, Insights and Forecast - by End-user Industry
- 8.3.1. Automotive
- 8.3.2. Iron and Steel
- 8.3.3. Oil and Gas
- 8.3.4. Pharmaceutical
- 8.3.5. Textile
- 8.3.6. Other En
- 8.1. Market Analysis, Insights and Forecast - by Source
- 9. Europe Liquid Waste Management Industry Analysis, Insights and Forecast, 2020-2032
- 9.1. Market Analysis, Insights and Forecast - by Source
- 9.1.1. Residential
- 9.1.2. Commercial
- 9.1.3. Industrial
- 9.2. Market Analysis, Insights and Forecast - by Service
- 9.2.1. Collection
- 9.2.2. Transportation/Hauling
- 9.2.3. Disposal/Recycling
- 9.3. Market Analysis, Insights and Forecast - by End-user Industry
- 9.3.1. Automotive
- 9.3.2. Iron and Steel
- 9.3.3. Oil and Gas
- 9.3.4. Pharmaceutical
- 9.3.5. Textile
- 9.3.6. Other En
- 9.1. Market Analysis, Insights and Forecast - by Source
- 10. South America Liquid Waste Management Industry Analysis, Insights and Forecast, 2020-2032
- 10.1. Market Analysis, Insights and Forecast - by Source
- 10.1.1. Residential
- 10.1.2. Commercial
- 10.1.3. Industrial
- 10.2. Market Analysis, Insights and Forecast - by Service
- 10.2.1. Collection
- 10.2.2. Transportation/Hauling
- 10.2.3. Disposal/Recycling
- 10.3. Market Analysis, Insights and Forecast - by End-user Industry
- 10.3.1. Automotive
- 10.3.2. Iron and Steel
- 10.3.3. Oil and Gas
- 10.3.4. Pharmaceutical
- 10.3.5. Textile
- 10.3.6. Other En
- 10.1. Market Analysis, Insights and Forecast - by Source
- 11. Middle East and Africa Liquid Waste Management Industry Analysis, Insights and Forecast, 2020-2032
- 11.1. Market Analysis, Insights and Forecast - by Source
- 11.1.1. Residential
- 11.1.2. Commercial
- 11.1.3. Industrial
- 11.2. Market Analysis, Insights and Forecast - by Service
- 11.2.1. Collection
- 11.2.2. Transportation/Hauling
- 11.2.3. Disposal/Recycling
- 11.3. Market Analysis, Insights and Forecast - by End-user Industry
- 11.3.1. Automotive
- 11.3.2. Iron and Steel
- 11.3.3. Oil and Gas
- 11.3.4. Pharmaceutical
- 11.3.5. Textile
- 11.3.6. Other En
- 11.1. Market Analysis, Insights and Forecast - by Source
- 12. Competitive Analysis
- 12.1. Company Profiles
- 12.1.1 CLEAN HARBORS INC
- 12.1.1.1. Company Overview
- 12.1.1.2. Products
- 12.1.1.3. Company Financials
- 12.1.1.4. SWOT Analysis
- 12.1.2 Cleanaway
- 12.1.2.1. Company Overview
- 12.1.2.2. Products
- 12.1.2.3. Company Financials
- 12.1.2.4. SWOT Analysis
- 12.1.3 Covanta Holding Corporation
- 12.1.3.1. Company Overview
- 12.1.3.2. Products
- 12.1.3.3. Company Financials
- 12.1.3.4. SWOT Analysis
- 12.1.4 Enva
- 12.1.4.1. Company Overview
- 12.1.4.2. Products
- 12.1.4.3. Company Financials
- 12.1.4.4. SWOT Analysis
- 12.1.5 GFL Environmental Inc
- 12.1.5.1. Company Overview
- 12.1.5.2. Products
- 12.1.5.3. Company Financials
- 12.1.5.4. SWOT Analysis
- 12.1.6 Hulsey (a Blue Flow Company)
- 12.1.6.1. Company Overview
- 12.1.6.2. Products
- 12.1.6.3. Company Financials
- 12.1.6.4. SWOT Analysis
- 12.1.7 Ovivo
- 12.1.7.1. Company Overview
- 12.1.7.2. Products
- 12.1.7.3. Company Financials
- 12.1.7.4. SWOT Analysis
- 12.1.8 REMONDIS SE & Co KG
- 12.1.8.1. Company Overview
- 12.1.8.2. Products
- 12.1.8.3. Company Financials
- 12.1.8.4. SWOT Analysis
- 12.1.9 SUEZ
- 12.1.9.1. Company Overview
- 12.1.9.2. Products
- 12.1.9.3. Company Financials
- 12.1.9.4. SWOT Analysis
- 12.1.10 Veolia
- 12.1.10.1. Company Overview
- 12.1.10.2. Products
- 12.1.10.3. Company Financials
- 12.1.10.4. SWOT Analysis
- 12.1.11 WM Intellectual Property Holdings L L C *List Not Exhaustive
- 12.1.11.1. Company Overview
- 12.1.11.2. Products
- 12.1.11.3. Company Financials
- 12.1.11.4. SWOT Analysis
- 12.1.1 CLEAN HARBORS INC
- 12.2. Market Entropy
- 12.2.1 Company's Key Areas Served
- 12.2.2 Recent Developments
- 12.3. Company Market Share Analysis 2025
- 12.3.1 Top 5 Companies Market Share Analysis
- 12.3.2 Top 3 Companies Market Share Analysis
- 12.4. List of Potential Customers
- 13. Research Methodology
List of Figures
- Figure 1: Global Liquid Waste Management Industry Revenue Breakdown (Million, %) by Region 2025 & 2033
- Figure 2: Global Liquid Waste Management Industry Volume Breakdown (Billion, %) by Region 2025 & 2033
- Figure 3: Asia Pacific Liquid Waste Management Industry Revenue (Million), by Source 2025 & 2033
- Figure 4: Asia Pacific Liquid Waste Management Industry Volume (Billion), by Source 2025 & 2033
- Figure 5: Asia Pacific Liquid Waste Management Industry Revenue Share (%), by Source 2025 & 2033
- Figure 6: Asia Pacific Liquid Waste Management Industry Volume Share (%), by Source 2025 & 2033
- Figure 7: Asia Pacific Liquid Waste Management Industry Revenue (Million), by Service 2025 & 2033
- Figure 8: Asia Pacific Liquid Waste Management Industry Volume (Billion), by Service 2025 & 2033
- Figure 9: Asia Pacific Liquid Waste Management Industry Revenue Share (%), by Service 2025 & 2033
- Figure 10: Asia Pacific Liquid Waste Management Industry Volume Share (%), by Service 2025 & 2033
- Figure 11: Asia Pacific Liquid Waste Management Industry Revenue (Million), by End-user Industry 2025 & 2033
- Figure 12: Asia Pacific Liquid Waste Management Industry Volume (Billion), by End-user Industry 2025 & 2033
- Figure 13: Asia Pacific Liquid Waste Management Industry Revenue Share (%), by End-user Industry 2025 & 2033
- Figure 14: Asia Pacific Liquid Waste Management Industry Volume Share (%), by End-user Industry 2025 & 2033
- Figure 15: Asia Pacific Liquid Waste Management Industry Revenue (Million), by Country 2025 & 2033
- Figure 16: Asia Pacific Liquid Waste Management Industry Volume (Billion), by Country 2025 & 2033
- Figure 17: Asia Pacific Liquid Waste Management Industry Revenue Share (%), by Country 2025 & 2033
- Figure 18: Asia Pacific Liquid Waste Management Industry Volume Share (%), by Country 2025 & 2033
- Figure 19: North America Liquid Waste Management Industry Revenue (Million), by Source 2025 & 2033
- Figure 20: North America Liquid Waste Management Industry Volume (Billion), by Source 2025 & 2033
- Figure 21: North America Liquid Waste Management Industry Revenue Share (%), by Source 2025 & 2033
- Figure 22: North America Liquid Waste Management Industry Volume Share (%), by Source 2025 & 2033
- Figure 23: North America Liquid Waste Management Industry Revenue (Million), by Service 2025 & 2033
- Figure 24: North America Liquid Waste Management Industry Volume (Billion), by Service 2025 & 2033
- Figure 25: North America Liquid Waste Management Industry Revenue Share (%), by Service 2025 & 2033
- Figure 26: North America Liquid Waste Management Industry Volume Share (%), by Service 2025 & 2033
- Figure 27: North America Liquid Waste Management Industry Revenue (Million), by End-user Industry 2025 & 2033
- Figure 28: North America Liquid Waste Management Industry Volume (Billion), by End-user Industry 2025 & 2033
- Figure 29: North America Liquid Waste Management Industry Revenue Share (%), by End-user Industry 2025 & 2033
- Figure 30: North America Liquid Waste Management Industry Volume Share (%), by End-user Industry 2025 & 2033
- Figure 31: North America Liquid Waste Management Industry Revenue (Million), by Country 2025 & 2033
- Figure 32: North America Liquid Waste Management Industry Volume (Billion), by Country 2025 & 2033
- Figure 33: North America Liquid Waste Management Industry Revenue Share (%), by Country 2025 & 2033
- Figure 34: North America Liquid Waste Management Industry Volume Share (%), by Country 2025 & 2033
- Figure 35: Europe Liquid Waste Management Industry Revenue (Million), by Source 2025 & 2033
- Figure 36: Europe Liquid Waste Management Industry Volume (Billion), by Source 2025 & 2033
- Figure 37: Europe Liquid Waste Management Industry Revenue Share (%), by Source 2025 & 2033
- Figure 38: Europe Liquid Waste Management Industry Volume Share (%), by Source 2025 & 2033
- Figure 39: Europe Liquid Waste Management Industry Revenue (Million), by Service 2025 & 2033
- Figure 40: Europe Liquid Waste Management Industry Volume (Billion), by Service 2025 & 2033
- Figure 41: Europe Liquid Waste Management Industry Revenue Share (%), by Service 2025 & 2033
- Figure 42: Europe Liquid Waste Management Industry Volume Share (%), by Service 2025 & 2033
- Figure 43: Europe Liquid Waste Management Industry Revenue (Million), by End-user Industry 2025 & 2033
- Figure 44: Europe Liquid Waste Management Industry Volume (Billion), by End-user Industry 2025 & 2033
- Figure 45: Europe Liquid Waste Management Industry Revenue Share (%), by End-user Industry 2025 & 2033
- Figure 46: Europe Liquid Waste Management Industry Volume Share (%), by End-user Industry 2025 & 2033
- Figure 47: Europe Liquid Waste Management Industry Revenue (Million), by Country 2025 & 2033
- Figure 48: Europe Liquid Waste Management Industry Volume (Billion), by Country 2025 & 2033
- Figure 49: Europe Liquid Waste Management Industry Revenue Share (%), by Country 2025 & 2033
- Figure 50: Europe Liquid Waste Management Industry Volume Share (%), by Country 2025 & 2033
- Figure 51: South America Liquid Waste Management Industry Revenue (Million), by Source 2025 & 2033
- Figure 52: South America Liquid Waste Management Industry Volume (Billion), by Source 2025 & 2033
- Figure 53: South America Liquid Waste Management Industry Revenue Share (%), by Source 2025 & 2033
- Figure 54: South America Liquid Waste Management Industry Volume Share (%), by Source 2025 & 2033
- Figure 55: South America Liquid Waste Management Industry Revenue (Million), by Service 2025 & 2033
- Figure 56: South America Liquid Waste Management Industry Volume (Billion), by Service 2025 & 2033
- Figure 57: South America Liquid Waste Management Industry Revenue Share (%), by Service 2025 & 2033
- Figure 58: South America Liquid Waste Management Industry Volume Share (%), by Service 2025 & 2033
- Figure 59: South America Liquid Waste Management Industry Revenue (Million), by End-user Industry 2025 & 2033
- Figure 60: South America Liquid Waste Management Industry Volume (Billion), by End-user Industry 2025 & 2033
- Figure 61: South America Liquid Waste Management Industry Revenue Share (%), by End-user Industry 2025 & 2033
- Figure 62: South America Liquid Waste Management Industry Volume Share (%), by End-user Industry 2025 & 2033
- Figure 63: South America Liquid Waste Management Industry Revenue (Million), by Country 2025 & 2033
- Figure 64: South America Liquid Waste Management Industry Volume (Billion), by Country 2025 & 2033
- Figure 65: South America Liquid Waste Management Industry Revenue Share (%), by Country 2025 & 2033
- Figure 66: South America Liquid Waste Management Industry Volume Share (%), by Country 2025 & 2033
- Figure 67: Middle East and Africa Liquid Waste Management Industry Revenue (Million), by Source 2025 & 2033
- Figure 68: Middle East and Africa Liquid Waste Management Industry Volume (Billion), by Source 2025 & 2033
- Figure 69: Middle East and Africa Liquid Waste Management Industry Revenue Share (%), by Source 2025 & 2033
- Figure 70: Middle East and Africa Liquid Waste Management Industry Volume Share (%), by Source 2025 & 2033
- Figure 71: Middle East and Africa Liquid Waste Management Industry Revenue (Million), by Service 2025 & 2033
- Figure 72: Middle East and Africa Liquid Waste Management Industry Volume (Billion), by Service 2025 & 2033
- Figure 73: Middle East and Africa Liquid Waste Management Industry Revenue Share (%), by Service 2025 & 2033
- Figure 74: Middle East and Africa Liquid Waste Management Industry Volume Share (%), by Service 2025 & 2033
- Figure 75: Middle East and Africa Liquid Waste Management Industry Revenue (Million), by End-user Industry 2025 & 2033
- Figure 76: Middle East and Africa Liquid Waste Management Industry Volume (Billion), by End-user Industry 2025 & 2033
- Figure 77: Middle East and Africa Liquid Waste Management Industry Revenue Share (%), by End-user Industry 2025 & 2033
- Figure 78: Middle East and Africa Liquid Waste Management Industry Volume Share (%), by End-user Industry 2025 & 2033
- Figure 79: Middle East and Africa Liquid Waste Management Industry Revenue (Million), by Country 2025 & 2033
- Figure 80: Middle East and Africa Liquid Waste Management Industry Volume (Billion), by Country 2025 & 2033
- Figure 81: Middle East and Africa Liquid Waste Management Industry Revenue Share (%), by Country 2025 & 2033
- Figure 82: Middle East and Africa Liquid Waste Management Industry Volume Share (%), by Country 2025 & 2033
List of Tables
- Table 1: Global Liquid Waste Management Industry Revenue Million Forecast, by Source 2020 & 2033
- Table 2: Global Liquid Waste Management Industry Volume Billion Forecast, by Source 2020 & 2033
- Table 3: Global Liquid Waste Management Industry Revenue Million Forecast, by Service 2020 & 2033
- Table 4: Global Liquid Waste Management Industry Volume Billion Forecast, by Service 2020 & 2033
- Table 5: Global Liquid Waste Management Industry Revenue Million Forecast, by End-user Industry 2020 & 2033
- Table 6: Global Liquid Waste Management Industry Volume Billion Forecast, by End-user Industry 2020 & 2033
- Table 7: Global Liquid Waste Management Industry Revenue Million Forecast, by Region 2020 & 2033
- Table 8: Global Liquid Waste Management Industry Volume Billion Forecast, by Region 2020 & 2033
- Table 9: Global Liquid Waste Management Industry Revenue Million Forecast, by Source 2020 & 2033
- Table 10: Global Liquid Waste Management Industry Volume Billion Forecast, by Source 2020 & 2033
- Table 11: Global Liquid Waste Management Industry Revenue Million Forecast, by Service 2020 & 2033
- Table 12: Global Liquid Waste Management Industry Volume Billion Forecast, by Service 2020 & 2033
- Table 13: Global Liquid Waste Management Industry Revenue Million Forecast, by End-user Industry 2020 & 2033
- Table 14: Global Liquid Waste Management Industry Volume Billion Forecast, by End-user Industry 2020 & 2033
- Table 15: Global Liquid Waste Management Industry Revenue Million Forecast, by Country 2020 & 2033
- Table 16: Global Liquid Waste Management Industry Volume Billion Forecast, by Country 2020 & 2033
- Table 17: China Liquid Waste Management Industry Revenue (Million) Forecast, by Application 2020 & 2033
- Table 18: China Liquid Waste Management Industry Volume (Billion) Forecast, by Application 2020 & 2033
- Table 19: India Liquid Waste Management Industry Revenue (Million) Forecast, by Application 2020 & 2033
- Table 20: India Liquid Waste Management Industry Volume (Billion) Forecast, by Application 2020 & 2033
- Table 21: Japan Liquid Waste Management Industry Revenue (Million) Forecast, by Application 2020 & 2033
- Table 22: Japan Liquid Waste Management Industry Volume (Billion) Forecast, by Application 2020 & 2033
- Table 23: South Korea Liquid Waste Management Industry Revenue (Million) Forecast, by Application 2020 & 2033
- Table 24: South Korea Liquid Waste Management Industry Volume (Billion) Forecast, by Application 2020 & 2033
- Table 25: Rest of Asia Pacific Liquid Waste Management Industry Revenue (Million) Forecast, by Application 2020 & 2033
- Table 26: Rest of Asia Pacific Liquid Waste Management Industry Volume (Billion) Forecast, by Application 2020 & 2033
- Table 27: Global Liquid Waste Management Industry Revenue Million Forecast, by Source 2020 & 2033
- Table 28: Global Liquid Waste Management Industry Volume Billion Forecast, by Source 2020 & 2033
- Table 29: Global Liquid Waste Management Industry Revenue Million Forecast, by Service 2020 & 2033
- Table 30: Global Liquid Waste Management Industry Volume Billion Forecast, by Service 2020 & 2033
- Table 31: Global Liquid Waste Management Industry Revenue Million Forecast, by End-user Industry 2020 & 2033
- Table 32: Global Liquid Waste Management Industry Volume Billion Forecast, by End-user Industry 2020 & 2033
- Table 33: Global Liquid Waste Management Industry Revenue Million Forecast, by Country 2020 & 2033
- Table 34: Global Liquid Waste Management Industry Volume Billion Forecast, by Country 2020 & 2033
- Table 35: United States Liquid Waste Management Industry Revenue (Million) Forecast, by Application 2020 & 2033
- Table 36: United States Liquid Waste Management Industry Volume (Billion) Forecast, by Application 2020 & 2033
- Table 37: Canada Liquid Waste Management Industry Revenue (Million) Forecast, by Application 2020 & 2033
- Table 38: Canada Liquid Waste Management Industry Volume (Billion) Forecast, by Application 2020 & 2033
- Table 39: Mexico Liquid Waste Management Industry Revenue (Million) Forecast, by Application 2020 & 2033
- Table 40: Mexico Liquid Waste Management Industry Volume (Billion) Forecast, by Application 2020 & 2033
- Table 41: Global Liquid Waste Management Industry Revenue Million Forecast, by Source 2020 & 2033
- Table 42: Global Liquid Waste Management Industry Volume Billion Forecast, by Source 2020 & 2033
- Table 43: Global Liquid Waste Management Industry Revenue Million Forecast, by Service 2020 & 2033
- Table 44: Global Liquid Waste Management Industry Volume Billion Forecast, by Service 2020 & 2033
- Table 45: Global Liquid Waste Management Industry Revenue Million Forecast, by End-user Industry 2020 & 2033
- Table 46: Global Liquid Waste Management Industry Volume Billion Forecast, by End-user Industry 2020 & 2033
- Table 47: Global Liquid Waste Management Industry Revenue Million Forecast, by Country 2020 & 2033
- Table 48: Global Liquid Waste Management Industry Volume Billion Forecast, by Country 2020 & 2033
- Table 49: Germany Liquid Waste Management Industry Revenue (Million) Forecast, by Application 2020 & 2033
- Table 50: Germany Liquid Waste Management Industry Volume (Billion) Forecast, by Application 2020 & 2033
- Table 51: United Kingdom Liquid Waste Management Industry Revenue (Million) Forecast, by Application 2020 & 2033
- Table 52: United Kingdom Liquid Waste Management Industry Volume (Billion) Forecast, by Application 2020 & 2033
- Table 53: France Liquid Waste Management Industry Revenue (Million) Forecast, by Application 2020 & 2033
- Table 54: France Liquid Waste Management Industry Volume (Billion) Forecast, by Application 2020 & 2033
- Table 55: Italy Liquid Waste Management Industry Revenue (Million) Forecast, by Application 2020 & 2033
- Table 56: Italy Liquid Waste Management Industry Volume (Billion) Forecast, by Application 2020 & 2033
- Table 57: Rest of Europe Liquid Waste Management Industry Revenue (Million) Forecast, by Application 2020 & 2033
- Table 58: Rest of Europe Liquid Waste Management Industry Volume (Billion) Forecast, by Application 2020 & 2033
- Table 59: Global Liquid Waste Management Industry Revenue Million Forecast, by Source 2020 & 2033
- Table 60: Global Liquid Waste Management Industry Volume Billion Forecast, by Source 2020 & 2033
- Table 61: Global Liquid Waste Management Industry Revenue Million Forecast, by Service 2020 & 2033
- Table 62: Global Liquid Waste Management Industry Volume Billion Forecast, by Service 2020 & 2033
- Table 63: Global Liquid Waste Management Industry Revenue Million Forecast, by End-user Industry 2020 & 2033
- Table 64: Global Liquid Waste Management Industry Volume Billion Forecast, by End-user Industry 2020 & 2033
- Table 65: Global Liquid Waste Management Industry Revenue Million Forecast, by Country 2020 & 2033
- Table 66: Global Liquid Waste Management Industry Volume Billion Forecast, by Country 2020 & 2033
- Table 67: Brazil Liquid Waste Management Industry Revenue (Million) Forecast, by Application 2020 & 2033
- Table 68: Brazil Liquid Waste Management Industry Volume (Billion) Forecast, by Application 2020 & 2033
- Table 69: Argentina Liquid Waste Management Industry Revenue (Million) Forecast, by Application 2020 & 2033
- Table 70: Argentina Liquid Waste Management Industry Volume (Billion) Forecast, by Application 2020 & 2033
- Table 71: Rest of South America Liquid Waste Management Industry Revenue (Million) Forecast, by Application 2020 & 2033
- Table 72: Rest of South America Liquid Waste Management Industry Volume (Billion) Forecast, by Application 2020 & 2033
- Table 73: Global Liquid Waste Management Industry Revenue Million Forecast, by Source 2020 & 2033
- Table 74: Global Liquid Waste Management Industry Volume Billion Forecast, by Source 2020 & 2033
- Table 75: Global Liquid Waste Management Industry Revenue Million Forecast, by Service 2020 & 2033
- Table 76: Global Liquid Waste Management Industry Volume Billion Forecast, by Service 2020 & 2033
- Table 77: Global Liquid Waste Management Industry Revenue Million Forecast, by End-user Industry 2020 & 2033
- Table 78: Global Liquid Waste Management Industry Volume Billion Forecast, by End-user Industry 2020 & 2033
- Table 79: Global Liquid Waste Management Industry Revenue Million Forecast, by Country 2020 & 2033
- Table 80: Global Liquid Waste Management Industry Volume Billion Forecast, by Country 2020 & 2033
- Table 81: Saudi Arabia Liquid Waste Management Industry Revenue (Million) Forecast, by Application 2020 & 2033
- Table 82: Saudi Arabia Liquid Waste Management Industry Volume (Billion) Forecast, by Application 2020 & 2033
- Table 83: South Africa Liquid Waste Management Industry Revenue (Million) Forecast, by Application 2020 & 2033
- Table 84: South Africa Liquid Waste Management Industry Volume (Billion) Forecast, by Application 2020 & 2033
- Table 85: Rest of Middle East and Africa Liquid Waste Management Industry Revenue (Million) Forecast, by Application 2020 & 2033
- Table 86: Rest of Middle East and Africa Liquid Waste Management Industry Volume (Billion) Forecast, by Application 2020 & 2033
Frequently Asked Questions
1. What is the projected Compound Annual Growth Rate (CAGR) of the Liquid Waste Management Industry?
The projected CAGR is approximately > 4.00%.
2. Which companies are prominent players in the Liquid Waste Management Industry?
Key companies in the market include CLEAN HARBORS INC, Cleanaway, Covanta Holding Corporation, Enva, GFL Environmental Inc, Hulsey (a Blue Flow Company), Ovivo, REMONDIS SE & Co KG, SUEZ, Veolia, WM Intellectual Property Holdings L L C *List Not Exhaustive.
3. What are the main segments of the Liquid Waste Management Industry?
The market segments include Source, Service, End-user Industry.
4. Can you provide details about the market size?
The market size is estimated to be USD 89.29 Million as of 2022.
5. What are some drivers contributing to market growth?
Growth in the Pharmaceutical and Healthcare Industry; Increased Manufacturing Activities Containing Toxic Chemicals Leading to Growing Liquid Effluent Management; Other Drivers.
6. What are the notable trends driving market growth?
Oil and Gas Segment to Dominate the Market.
7. Are there any restraints impacting market growth?
Growth in the Pharmaceutical and Healthcare Industry; Increased Manufacturing Activities Containing Toxic Chemicals Leading to Growing Liquid Effluent Management; Other Drivers.
8. Can you provide examples of recent developments in the market?
October 2023: SUEZ Recycling and Recovery UK completed the acquisition of Devon Contract Waste (DCW), a prominent recycling and waste management company. This strategic move is aimed at enhancing SUEZ's global position within the waste sector.
9. What pricing options are available for accessing the report?
Pricing options include single-user, multi-user, and enterprise licenses priced at USD 4750, USD 5250, and USD 8750 respectively.
10. Is the market size provided in terms of value or volume?
The market size is provided in terms of value, measured in Million and volume, measured in Billion.
11. Are there any specific market keywords associated with the report?
Yes, the market keyword associated with the report is "Liquid Waste Management Industry," which aids in identifying and referencing the specific market segment covered.
12. How do I determine which pricing option suits my needs best?
The pricing options vary based on user requirements and access needs. Individual users may opt for single-user licenses, while businesses requiring broader access may choose multi-user or enterprise licenses for cost-effective access to the report.
13. Are there any additional resources or data provided in the Liquid Waste Management Industry report?
While the report offers comprehensive insights, it's advisable to review the specific contents or supplementary materials provided to ascertain if additional resources or data are available.
14. How can I stay updated on further developments or reports in the Liquid Waste Management Industry?
To stay informed about further developments, trends, and reports in the Liquid Waste Management Industry, consider subscribing to industry newsletters, following relevant companies and organizations, or regularly checking reputable industry news sources and publications.
Methodology
Step 1 - Identification of Relevant Samples Size from Population Database


Step 2 - Approaches for Defining Global Market Size (Value, Volume* & Price*)

Note*: In applicable scenarios
Step 3 - Data Sources
Primary Research
- Web Analytics
- Survey Reports
- Research Institute
- Latest Research Reports
- Opinion Leaders
Secondary Research
- Annual Reports
- White Paper
- Latest Press Release
- Industry Association
- Paid Database
- Investor Presentations

Step 4 - Data Triangulation
Involves using different sources of information in order to increase the validity of a study
These sources are likely to be stakeholders in a program - participants, other researchers, program staff, other community members, and so on.
Then we put all data in single framework & apply various statistical tools to find out the dynamic on the market.
During the analysis stage, feedback from the stakeholder groups would be compared to determine areas of agreement as well as areas of divergence