

Key Insights
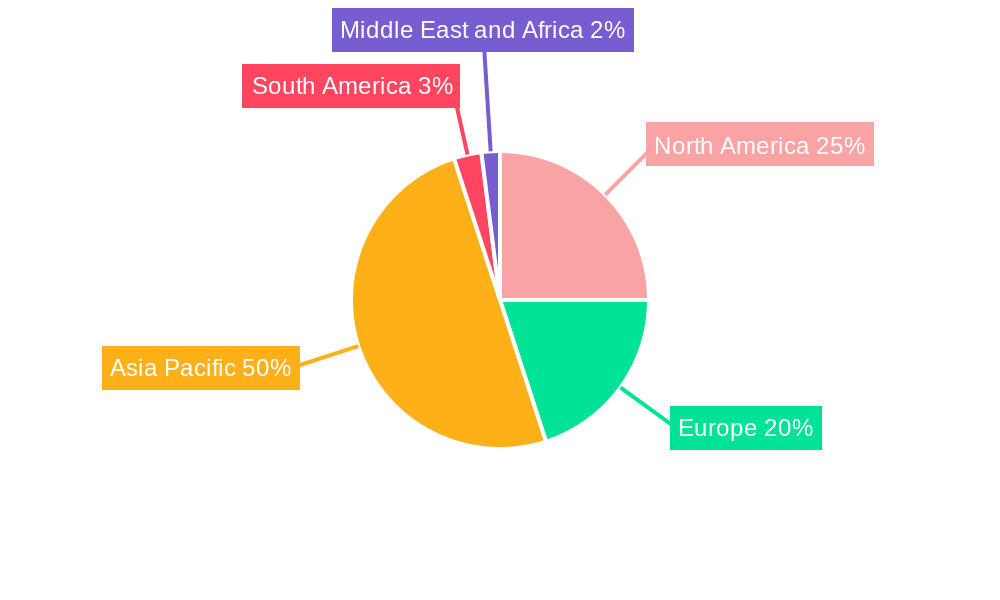
The lithium-ion battery electrolyte solvent market is poised for substantial growth, driven by escalating demand from electric vehicles (EVs), energy storage systems (ESS), and portable electronics. The market, projected to reach $8.369 billion by the base year of 2025, is expected to grow at a Compound Annual Growth Rate (CAGR) of 12.83%. This expansion is propelled by the global transition to sustainable energy, increased EV adoption, and continuous advancements in battery technology focused on enhancing energy density, safety, and longevity. The market is segmented by application, including power backups, mobile devices, laptops, electric mobility, and energy storage systems, and by solvent type, such as ethylene carbonate, diethyl carbonate, dimethyl carbonate, ethyl methyl carbonate, and propylene carbonate. The Asia-Pacific region, led by China and South Korea, currently dominates due to its robust battery manufacturing infrastructure and the rapid expansion of the EV sector. North America and Europe are also experiencing significant growth, supported by government incentives and rising consumer demand for EVs and ESS.
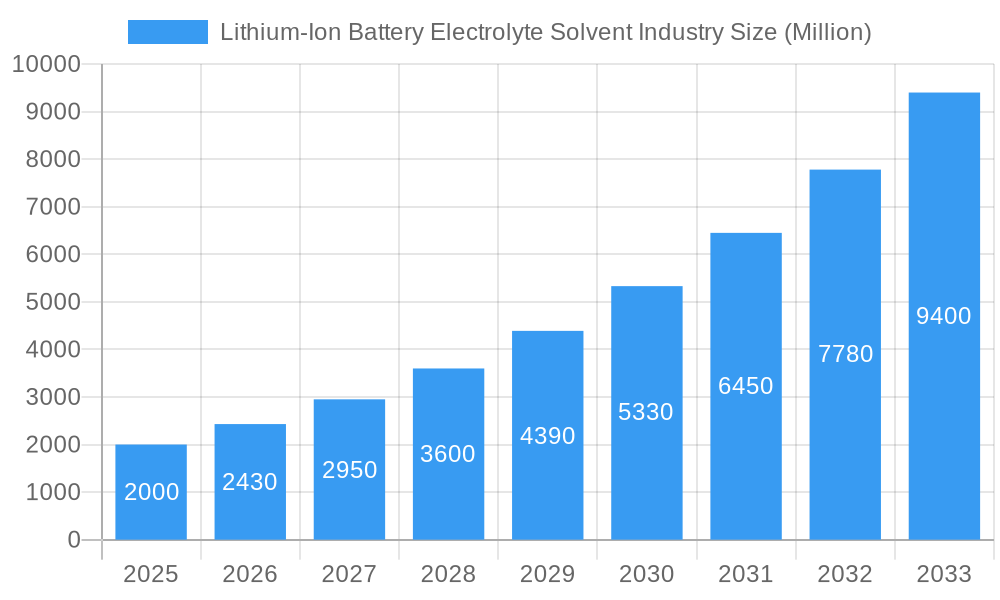
Lithium-Ion Battery Electrolyte Solvent Industry Market Size (In Billion)
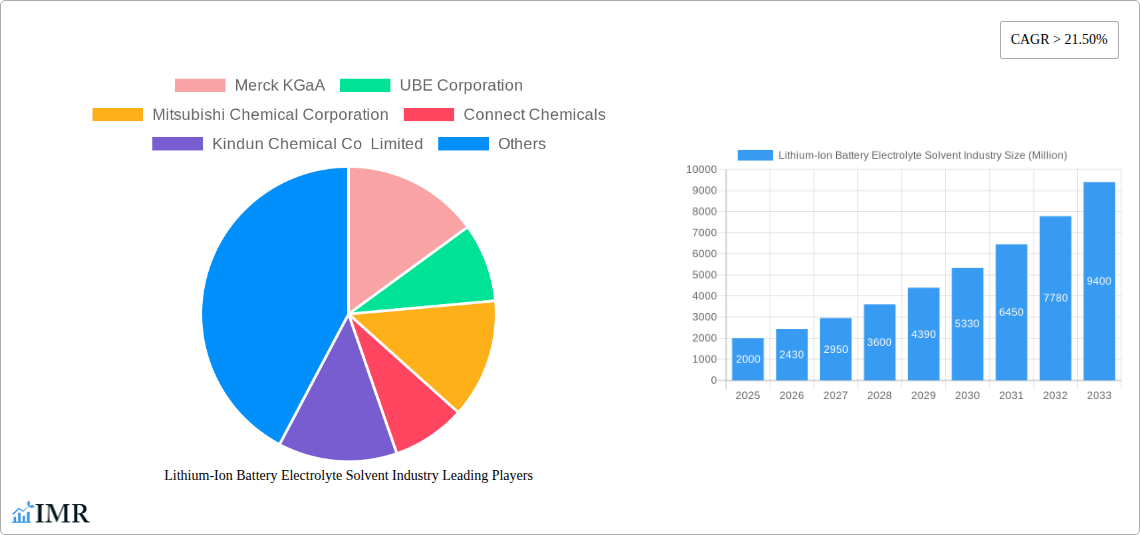
The competitive landscape features established chemical manufacturers and innovative new entrants. Key players include Merck KGaA, UBE Corporation, and Mitsubishi Chemical Corporation. While established companies leverage economies of scale, emerging players are driving innovation with new products and technologies. Challenges include raw material price volatility, environmental regulations, and the ongoing need for research and development to improve battery performance and safety. The long-term outlook for the lithium-ion battery electrolyte solvent market is highly optimistic, supported by sustained growth in the EV and renewable energy sectors. Future success will depend on technological advancements, sustainable sourcing, and effective navigation of regulatory frameworks.
Lithium-Ion Battery Electrolyte Solvent Industry Company Market Share
Lithium-Ion Battery Electrolyte Solvent Industry Market Report: 2019-2033
This comprehensive report provides an in-depth analysis of the Lithium-Ion Battery Electrolyte Solvent industry, encompassing market dynamics, growth trends, regional insights, product landscapes, and key player strategies. The study period covers 2019-2033, with a base year of 2025 and a forecast period of 2025-2033. The report is essential for industry professionals, investors, and anyone seeking a thorough understanding of this rapidly evolving market, valued at xx Million in 2025.
Lithium-Ion Battery Electrolyte Solvent Industry Market Dynamics & Structure
The Lithium-Ion Battery Electrolyte Solvent market is characterized by moderate concentration, with several major players holding significant market share. Technological innovation, particularly in developing high-performance and safer solvents, is a key driver. Stringent regulatory frameworks regarding battery safety and environmental impact influence manufacturing processes and material selection. Competitive pressures from substitute materials are present, but the dominant performance of lithium-ion batteries continues to fuel demand. End-user demographics are expanding rapidly, driven by the increasing adoption of electric vehicles and energy storage systems. M&A activity is prevalent, with larger players consolidating market share and securing access to advanced technologies.
- Market Concentration: Moderately concentrated, with top 5 players holding approximately xx% market share in 2025.
- Technological Innovation: Focus on high-performance solvents with improved thermal stability, safety, and conductivity.
- Regulatory Landscape: Stringent regulations on battery safety and environmental impact are shaping industry practices.
- Competitive Substitutes: Limited viable alternatives currently exist for lithium-ion battery electrolytes.
- M&A Activity: xx major M&A deals in the last 5 years, indicating industry consolidation.
- Innovation Barriers: High R&D costs and stringent safety/environmental regulations.
Lithium-Ion Battery Electrolyte Solvent Industry Growth Trends & Insights
The Lithium-Ion Battery Electrolyte Solvent market is experiencing robust growth, driven by the exponential rise in demand for lithium-ion batteries across various applications. The market size is projected to reach xx Million by 2033, exhibiting a CAGR of xx% during the forecast period. This growth is fueled by the increasing adoption of electric vehicles (EVs), energy storage systems (ESS), and consumer electronics. Technological advancements in battery technology are continuously improving the performance and safety of lithium-ion batteries, further driving demand for high-performance electrolytes. Consumer behavior shifts towards sustainable and eco-friendly products are also contributing to market expansion. Disruptions are occurring with new solvent chemistries aiming to improve energy density and safety.
- Market Size (2025): xx Million
- Market Size (2033): xx Million
- CAGR (2025-2033): xx%
- Market Penetration in EVs: xx% (2025), projected to reach xx% by 2033.
Dominant Regions, Countries, or Segments in Lithium-Ion Battery Electrolyte Solvent Industry
Asia-Pacific, particularly China and South Korea, dominates the Lithium-Ion Battery Electrolyte Solvent market, driven by the high concentration of battery manufacturing facilities and robust growth in the electric vehicle sector. Within applications, Electric Mobility/Vehicles and Energy Storage Systems segments are experiencing the fastest growth, fueled by government incentives and increasing energy demands. Regarding solvent types, Ethylene Carbonate (EC) and Dimethyl Carbonate (DMC) hold significant market share due to their established performance and wide applications.
- Dominant Region: Asia-Pacific (China, South Korea)
- Fastest-Growing Application Segments: Electric Mobility/Vehicles and Energy Storage Systems.
- Leading Solvent Types: Ethylene Carbonate (EC) and Dimethyl Carbonate (DMC).
- Key Drivers: Government support for EV adoption, increasing energy storage needs, and expanding consumer electronics market.
Lithium-Ion Battery Electrolyte Solvent Industry Product Landscape
The product landscape is characterized by a wide range of solvents tailored to specific battery chemistries and performance requirements. Innovations focus on improving thermal stability, safety, ionic conductivity, and cycle life. Unique selling propositions often center on enhanced performance parameters, cost-effectiveness, and environmental friendliness. Advancements include the development of novel solvent blends and additives to optimize battery performance.
Key Drivers, Barriers & Challenges in Lithium-Ion Battery Electrolyte Solvent Industry
Key Drivers:
- Increasing demand for electric vehicles and energy storage systems.
- Advancements in battery technology requiring high-performance electrolytes.
- Government incentives and policies promoting the adoption of clean energy technologies.
Challenges & Restraints:
- Fluctuations in raw material prices.
- Stringent safety and environmental regulations.
- Intense competition from established and emerging players.
- Supply chain disruptions impacting availability and cost of raw materials. The impact of this is estimated to be xx% reduction in production capacity in 2024.
Emerging Opportunities in Lithium-Ion Battery Electrolyte Solvent Industry
- Growing demand for solid-state batteries presents opportunities for new electrolyte formulations.
- Development of next-generation solvents with enhanced performance characteristics.
- Expansion into emerging markets with high growth potential in battery adoption.
- Partnerships with battery manufacturers to develop tailored electrolyte solutions.
Growth Accelerators in the Lithium-Ion Battery Electrolyte Solvent Industry Industry
Long-term growth will be fueled by technological breakthroughs leading to safer, higher energy density, and cost-effective batteries. Strategic partnerships between solvent manufacturers and battery producers will play a crucial role in driving innovation and market expansion. The development of sustainable and environmentally friendly solvent production processes will become increasingly important.
Key Players Shaping the Lithium-Ion Battery Electrolyte Solvent Market
- Merck KGaA
- UBE Corporation
- Mitsubishi Chemical Corporation
- Connect Chemicals
- Kindun Chemical Co Limited
- OUCC
- Lotte Chemical
- Dongwha Electrolyte
- BASF SE
- Huntsman International LLC
- Sankyo Chemical Co Ltd
- Zhengzhou Meiya Chemical Products Co Ltd
- Shenzhen Capchem Technology Co Ltd (CAPCHEM)
- Lixing Chemical
Notable Milestones in Lithium-Ion Battery Electrolyte Solvent Industry Sector
- July 2022: UBE Corporation initiated a feasibility study for a new DMC and EMC production plant in Louisiana, USA, with planned capacity of 100,000 metric tons/year of DMC and 40,000 metric tons/year of EMC. Projected start of operations: Second half of fiscal 2025.
- February 2022: Lotte Chemical invested KRW 602 billion (~USD 502 million) in a new plant for high-purity organic solvents (EC and DMC) for lithium-ion battery electrolytes.
In-Depth Lithium-Ion Battery Electrolyte Solvent Industry Market Outlook
The future of the Lithium-Ion Battery Electrolyte Solvent market is bright, driven by the continued growth of the electric vehicle and energy storage sectors. Strategic partnerships, technological innovation, and the development of sustainable manufacturing processes will shape the industry landscape. The market is poised for significant expansion, presenting numerous opportunities for players with a focus on innovation and sustainability.
Lithium-Ion Battery Electrolyte Solvent Industry Segmentation
-
1. Solvent Type
- 1.1. Ethylene Carbonate (EC)
- 1.2. Diethyl Carbonate (DEC)
- 1.3. Dimethyl Carbonate (DMC)
- 1.4. Ethyl Methyl Carbonate (EMC)
- 1.5. Propylene Carbonate (PC)
- 1.6. Other Solvent Types
-
2. Application
- 2.1. Power Backups/UPS
- 2.2. Mobile,
- 2.3. Electric Mobility/Vehicles
- 2.4. Energy Storage Systems
- 2.5. Other Applications
Lithium-Ion Battery Electrolyte Solvent Industry Segmentation By Geography
-
1. Asia Pacific
- 1.1. China
- 1.2. India
- 1.3. Japan
- 1.4. South Korea
- 1.5. ASEAN Countries
- 1.6. Rest of Asia Pacific
-
2. North America
- 2.1. United States
- 2.2. Canada
- 2.3. Mexico
-
3. Europe
- 3.1. Germany
- 3.2. France
- 3.3. United Kingdom
- 3.4. Italy
- 3.5. Rest of Europe
-
4. South America
- 4.1. Brazil
- 4.2. Argentina
- 4.3. Rest of South America
-
5. Middle East and Africa
- 5.1. Saudi Arabia
- 5.2. South Africa
- 5.3. Rest of Middle East and Africa
Lithium-Ion Battery Electrolyte Solvent Industry Regional Market Share
Geographic Coverage of Lithium-Ion Battery Electrolyte Solvent Industry
Lithium-Ion Battery Electrolyte Solvent Industry REPORT HIGHLIGHTS
| Aspects | Details |
|---|---|
| Study Period | 2020-2034 |
| Base Year | 2025 |
| Estimated Year | 2026 |
| Forecast Period | 2026-2034 |
| Historical Period | 2020-2025 |
| Growth Rate | CAGR of 12.83% from 2020-2034 |
| Segmentation |
|
Table of Contents
- 1. Introduction
- 1.1. Research Scope
- 1.2. Market Segmentation
- 1.3. Research Objective
- 1.4. Definitions and Assumptions
- 2. Executive Summary
- 2.1. Market Snapshot
- 3. Market Dynamics
- 3.1. Market Drivers
- 3.2. Market Restrains
- 3.3. Market Trends
- 3.4. Market Opportunities
- 4. Market Factor Analysis
- 4.1. Porters Five Forces
- 4.1.1. Bargaining Power of Suppliers
- 4.1.2. Bargaining Power of Buyers
- 4.1.3. Threat of New Entrants
- 4.1.4. Threat of Substitutes
- 4.1.5. Competitive Rivalry
- 4.2. PESTEL analysis
- 4.3. BCG Analysis
- 4.3.1. Stars (High Growth, High Market Share)
- 4.3.2. Cash Cows (Low Growth, High Market Share)
- 4.3.3. Question Mark (High Growth, Low Market Share)
- 4.3.4. Dogs (Low Growth, Low Market Share)
- 4.4. Ansoff Matrix Analysis
- 4.5. Supply Chain Analysis
- 4.6. Regulatory Landscape
- 4.7. Current Market Potential and Opportunity Assessment (TAM–SAM–SOM Framework)
- 4.8. IMR Analyst Note
- 4.1. Porters Five Forces
- 5. Market Analysis, Insights and Forecast 2021-2033
- 5.1. Market Analysis, Insights and Forecast - by Solvent Type
- 5.1.1. Ethylene Carbonate (EC)
- 5.1.2. Diethyl Carbonate (DEC)
- 5.1.3. Dimethyl Carbonate (DMC)
- 5.1.4. Ethyl Methyl Carbonate (EMC)
- 5.1.5. Propylene Carbonate (PC)
- 5.1.6. Other Solvent Types
- 5.2. Market Analysis, Insights and Forecast - by Application
- 5.2.1. Power Backups/UPS
- 5.2.2. Mobile,
- 5.2.3. Electric Mobility/Vehicles
- 5.2.4. Energy Storage Systems
- 5.2.5. Other Applications
- 5.3. Market Analysis, Insights and Forecast - by Region
- 5.3.1. Asia Pacific
- 5.3.2. North America
- 5.3.3. Europe
- 5.3.4. South America
- 5.3.5. Middle East and Africa
- 5.1. Market Analysis, Insights and Forecast - by Solvent Type
- 6. Global Lithium-Ion Battery Electrolyte Solvent Industry Analysis, Insights and Forecast, 2021-2033
- 6.1. Market Analysis, Insights and Forecast - by Solvent Type
- 6.1.1. Ethylene Carbonate (EC)
- 6.1.2. Diethyl Carbonate (DEC)
- 6.1.3. Dimethyl Carbonate (DMC)
- 6.1.4. Ethyl Methyl Carbonate (EMC)
- 6.1.5. Propylene Carbonate (PC)
- 6.1.6. Other Solvent Types
- 6.2. Market Analysis, Insights and Forecast - by Application
- 6.2.1. Power Backups/UPS
- 6.2.2. Mobile,
- 6.2.3. Electric Mobility/Vehicles
- 6.2.4. Energy Storage Systems
- 6.2.5. Other Applications
- 6.1. Market Analysis, Insights and Forecast - by Solvent Type
- 7. Asia Pacific Lithium-Ion Battery Electrolyte Solvent Industry Analysis, Insights and Forecast, 2020-2032
- 7.1. Market Analysis, Insights and Forecast - by Solvent Type
- 7.1.1. Ethylene Carbonate (EC)
- 7.1.2. Diethyl Carbonate (DEC)
- 7.1.3. Dimethyl Carbonate (DMC)
- 7.1.4. Ethyl Methyl Carbonate (EMC)
- 7.1.5. Propylene Carbonate (PC)
- 7.1.6. Other Solvent Types
- 7.2. Market Analysis, Insights and Forecast - by Application
- 7.2.1. Power Backups/UPS
- 7.2.2. Mobile,
- 7.2.3. Electric Mobility/Vehicles
- 7.2.4. Energy Storage Systems
- 7.2.5. Other Applications
- 7.1. Market Analysis, Insights and Forecast - by Solvent Type
- 8. North America Lithium-Ion Battery Electrolyte Solvent Industry Analysis, Insights and Forecast, 2020-2032
- 8.1. Market Analysis, Insights and Forecast - by Solvent Type
- 8.1.1. Ethylene Carbonate (EC)
- 8.1.2. Diethyl Carbonate (DEC)
- 8.1.3. Dimethyl Carbonate (DMC)
- 8.1.4. Ethyl Methyl Carbonate (EMC)
- 8.1.5. Propylene Carbonate (PC)
- 8.1.6. Other Solvent Types
- 8.2. Market Analysis, Insights and Forecast - by Application
- 8.2.1. Power Backups/UPS
- 8.2.2. Mobile,
- 8.2.3. Electric Mobility/Vehicles
- 8.2.4. Energy Storage Systems
- 8.2.5. Other Applications
- 8.1. Market Analysis, Insights and Forecast - by Solvent Type
- 9. Europe Lithium-Ion Battery Electrolyte Solvent Industry Analysis, Insights and Forecast, 2020-2032
- 9.1. Market Analysis, Insights and Forecast - by Solvent Type
- 9.1.1. Ethylene Carbonate (EC)
- 9.1.2. Diethyl Carbonate (DEC)
- 9.1.3. Dimethyl Carbonate (DMC)
- 9.1.4. Ethyl Methyl Carbonate (EMC)
- 9.1.5. Propylene Carbonate (PC)
- 9.1.6. Other Solvent Types
- 9.2. Market Analysis, Insights and Forecast - by Application
- 9.2.1. Power Backups/UPS
- 9.2.2. Mobile,
- 9.2.3. Electric Mobility/Vehicles
- 9.2.4. Energy Storage Systems
- 9.2.5. Other Applications
- 9.1. Market Analysis, Insights and Forecast - by Solvent Type
- 10. South America Lithium-Ion Battery Electrolyte Solvent Industry Analysis, Insights and Forecast, 2020-2032
- 10.1. Market Analysis, Insights and Forecast - by Solvent Type
- 10.1.1. Ethylene Carbonate (EC)
- 10.1.2. Diethyl Carbonate (DEC)
- 10.1.3. Dimethyl Carbonate (DMC)
- 10.1.4. Ethyl Methyl Carbonate (EMC)
- 10.1.5. Propylene Carbonate (PC)
- 10.1.6. Other Solvent Types
- 10.2. Market Analysis, Insights and Forecast - by Application
- 10.2.1. Power Backups/UPS
- 10.2.2. Mobile,
- 10.2.3. Electric Mobility/Vehicles
- 10.2.4. Energy Storage Systems
- 10.2.5. Other Applications
- 10.1. Market Analysis, Insights and Forecast - by Solvent Type
- 11. Middle East and Africa Lithium-Ion Battery Electrolyte Solvent Industry Analysis, Insights and Forecast, 2020-2032
- 11.1. Market Analysis, Insights and Forecast - by Solvent Type
- 11.1.1. Ethylene Carbonate (EC)
- 11.1.2. Diethyl Carbonate (DEC)
- 11.1.3. Dimethyl Carbonate (DMC)
- 11.1.4. Ethyl Methyl Carbonate (EMC)
- 11.1.5. Propylene Carbonate (PC)
- 11.1.6. Other Solvent Types
- 11.2. Market Analysis, Insights and Forecast - by Application
- 11.2.1. Power Backups/UPS
- 11.2.2. Mobile,
- 11.2.3. Electric Mobility/Vehicles
- 11.2.4. Energy Storage Systems
- 11.2.5. Other Applications
- 11.1. Market Analysis, Insights and Forecast - by Solvent Type
- 12. Competitive Analysis
- 12.1. Company Profiles
- 12.1.1 Merck KGaA
- 12.1.1.1. Company Overview
- 12.1.1.2. Products
- 12.1.1.3. Company Financials
- 12.1.1.4. SWOT Analysis
- 12.1.2 UBE Corporation
- 12.1.2.1. Company Overview
- 12.1.2.2. Products
- 12.1.2.3. Company Financials
- 12.1.2.4. SWOT Analysis
- 12.1.3 Mitsubishi Chemical Corporation
- 12.1.3.1. Company Overview
- 12.1.3.2. Products
- 12.1.3.3. Company Financials
- 12.1.3.4. SWOT Analysis
- 12.1.4 Connect Chemicals
- 12.1.4.1. Company Overview
- 12.1.4.2. Products
- 12.1.4.3. Company Financials
- 12.1.4.4. SWOT Analysis
- 12.1.5 Kindun Chemical Co Limited
- 12.1.5.1. Company Overview
- 12.1.5.2. Products
- 12.1.5.3. Company Financials
- 12.1.5.4. SWOT Analysis
- 12.1.6 OUCC
- 12.1.6.1. Company Overview
- 12.1.6.2. Products
- 12.1.6.3. Company Financials
- 12.1.6.4. SWOT Analysis
- 12.1.7 Lotte Chemical
- 12.1.7.1. Company Overview
- 12.1.7.2. Products
- 12.1.7.3. Company Financials
- 12.1.7.4. SWOT Analysis
- 12.1.8 Dongwha Electrolyte
- 12.1.8.1. Company Overview
- 12.1.8.2. Products
- 12.1.8.3. Company Financials
- 12.1.8.4. SWOT Analysis
- 12.1.9 BASF SE
- 12.1.9.1. Company Overview
- 12.1.9.2. Products
- 12.1.9.3. Company Financials
- 12.1.9.4. SWOT Analysis
- 12.1.10 Huntsman International LLC
- 12.1.10.1. Company Overview
- 12.1.10.2. Products
- 12.1.10.3. Company Financials
- 12.1.10.4. SWOT Analysis
- 12.1.11 Sankyo Chemical Co Ltd
- 12.1.11.1. Company Overview
- 12.1.11.2. Products
- 12.1.11.3. Company Financials
- 12.1.11.4. SWOT Analysis
- 12.1.12 Zhengzhou Meiya Chemical Products Co Ltd
- 12.1.12.1. Company Overview
- 12.1.12.2. Products
- 12.1.12.3. Company Financials
- 12.1.12.4. SWOT Analysis
- 12.1.13 Shenzhen Capchem Technology Co Ltd (CAPCHEM)
- 12.1.13.1. Company Overview
- 12.1.13.2. Products
- 12.1.13.3. Company Financials
- 12.1.13.4. SWOT Analysis
- 12.1.14 Lixing Chemical
- 12.1.14.1. Company Overview
- 12.1.14.2. Products
- 12.1.14.3. Company Financials
- 12.1.14.4. SWOT Analysis
- 12.1.1 Merck KGaA
- 12.2. Market Entropy
- 12.2.1 Company's Key Areas Served
- 12.2.2 Recent Developments
- 12.3. Company Market Share Analysis 2025
- 12.3.1 Top 5 Companies Market Share Analysis
- 12.3.2 Top 3 Companies Market Share Analysis
- 12.4. List of Potential Customers
- 13. Research Methodology
List of Figures
- Figure 1: Global Lithium-Ion Battery Electrolyte Solvent Industry Revenue Breakdown (billion, %) by Region 2025 & 2033
- Figure 2: Global Lithium-Ion Battery Electrolyte Solvent Industry Volume Breakdown (liter, %) by Region 2025 & 2033
- Figure 3: Asia Pacific Lithium-Ion Battery Electrolyte Solvent Industry Revenue (billion), by Solvent Type 2025 & 2033
- Figure 4: Asia Pacific Lithium-Ion Battery Electrolyte Solvent Industry Volume (liter), by Solvent Type 2025 & 2033
- Figure 5: Asia Pacific Lithium-Ion Battery Electrolyte Solvent Industry Revenue Share (%), by Solvent Type 2025 & 2033
- Figure 6: Asia Pacific Lithium-Ion Battery Electrolyte Solvent Industry Volume Share (%), by Solvent Type 2025 & 2033
- Figure 7: Asia Pacific Lithium-Ion Battery Electrolyte Solvent Industry Revenue (billion), by Application 2025 & 2033
- Figure 8: Asia Pacific Lithium-Ion Battery Electrolyte Solvent Industry Volume (liter), by Application 2025 & 2033
- Figure 9: Asia Pacific Lithium-Ion Battery Electrolyte Solvent Industry Revenue Share (%), by Application 2025 & 2033
- Figure 10: Asia Pacific Lithium-Ion Battery Electrolyte Solvent Industry Volume Share (%), by Application 2025 & 2033
- Figure 11: Asia Pacific Lithium-Ion Battery Electrolyte Solvent Industry Revenue (billion), by Country 2025 & 2033
- Figure 12: Asia Pacific Lithium-Ion Battery Electrolyte Solvent Industry Volume (liter), by Country 2025 & 2033
- Figure 13: Asia Pacific Lithium-Ion Battery Electrolyte Solvent Industry Revenue Share (%), by Country 2025 & 2033
- Figure 14: Asia Pacific Lithium-Ion Battery Electrolyte Solvent Industry Volume Share (%), by Country 2025 & 2033
- Figure 15: North America Lithium-Ion Battery Electrolyte Solvent Industry Revenue (billion), by Solvent Type 2025 & 2033
- Figure 16: North America Lithium-Ion Battery Electrolyte Solvent Industry Volume (liter), by Solvent Type 2025 & 2033
- Figure 17: North America Lithium-Ion Battery Electrolyte Solvent Industry Revenue Share (%), by Solvent Type 2025 & 2033
- Figure 18: North America Lithium-Ion Battery Electrolyte Solvent Industry Volume Share (%), by Solvent Type 2025 & 2033
- Figure 19: North America Lithium-Ion Battery Electrolyte Solvent Industry Revenue (billion), by Application 2025 & 2033
- Figure 20: North America Lithium-Ion Battery Electrolyte Solvent Industry Volume (liter), by Application 2025 & 2033
- Figure 21: North America Lithium-Ion Battery Electrolyte Solvent Industry Revenue Share (%), by Application 2025 & 2033
- Figure 22: North America Lithium-Ion Battery Electrolyte Solvent Industry Volume Share (%), by Application 2025 & 2033
- Figure 23: North America Lithium-Ion Battery Electrolyte Solvent Industry Revenue (billion), by Country 2025 & 2033
- Figure 24: North America Lithium-Ion Battery Electrolyte Solvent Industry Volume (liter), by Country 2025 & 2033
- Figure 25: North America Lithium-Ion Battery Electrolyte Solvent Industry Revenue Share (%), by Country 2025 & 2033
- Figure 26: North America Lithium-Ion Battery Electrolyte Solvent Industry Volume Share (%), by Country 2025 & 2033
- Figure 27: Europe Lithium-Ion Battery Electrolyte Solvent Industry Revenue (billion), by Solvent Type 2025 & 2033
- Figure 28: Europe Lithium-Ion Battery Electrolyte Solvent Industry Volume (liter), by Solvent Type 2025 & 2033
- Figure 29: Europe Lithium-Ion Battery Electrolyte Solvent Industry Revenue Share (%), by Solvent Type 2025 & 2033
- Figure 30: Europe Lithium-Ion Battery Electrolyte Solvent Industry Volume Share (%), by Solvent Type 2025 & 2033
- Figure 31: Europe Lithium-Ion Battery Electrolyte Solvent Industry Revenue (billion), by Application 2025 & 2033
- Figure 32: Europe Lithium-Ion Battery Electrolyte Solvent Industry Volume (liter), by Application 2025 & 2033
- Figure 33: Europe Lithium-Ion Battery Electrolyte Solvent Industry Revenue Share (%), by Application 2025 & 2033
- Figure 34: Europe Lithium-Ion Battery Electrolyte Solvent Industry Volume Share (%), by Application 2025 & 2033
- Figure 35: Europe Lithium-Ion Battery Electrolyte Solvent Industry Revenue (billion), by Country 2025 & 2033
- Figure 36: Europe Lithium-Ion Battery Electrolyte Solvent Industry Volume (liter), by Country 2025 & 2033
- Figure 37: Europe Lithium-Ion Battery Electrolyte Solvent Industry Revenue Share (%), by Country 2025 & 2033
- Figure 38: Europe Lithium-Ion Battery Electrolyte Solvent Industry Volume Share (%), by Country 2025 & 2033
- Figure 39: South America Lithium-Ion Battery Electrolyte Solvent Industry Revenue (billion), by Solvent Type 2025 & 2033
- Figure 40: South America Lithium-Ion Battery Electrolyte Solvent Industry Volume (liter), by Solvent Type 2025 & 2033
- Figure 41: South America Lithium-Ion Battery Electrolyte Solvent Industry Revenue Share (%), by Solvent Type 2025 & 2033
- Figure 42: South America Lithium-Ion Battery Electrolyte Solvent Industry Volume Share (%), by Solvent Type 2025 & 2033
- Figure 43: South America Lithium-Ion Battery Electrolyte Solvent Industry Revenue (billion), by Application 2025 & 2033
- Figure 44: South America Lithium-Ion Battery Electrolyte Solvent Industry Volume (liter), by Application 2025 & 2033
- Figure 45: South America Lithium-Ion Battery Electrolyte Solvent Industry Revenue Share (%), by Application 2025 & 2033
- Figure 46: South America Lithium-Ion Battery Electrolyte Solvent Industry Volume Share (%), by Application 2025 & 2033
- Figure 47: South America Lithium-Ion Battery Electrolyte Solvent Industry Revenue (billion), by Country 2025 & 2033
- Figure 48: South America Lithium-Ion Battery Electrolyte Solvent Industry Volume (liter), by Country 2025 & 2033
- Figure 49: South America Lithium-Ion Battery Electrolyte Solvent Industry Revenue Share (%), by Country 2025 & 2033
- Figure 50: South America Lithium-Ion Battery Electrolyte Solvent Industry Volume Share (%), by Country 2025 & 2033
- Figure 51: Middle East and Africa Lithium-Ion Battery Electrolyte Solvent Industry Revenue (billion), by Solvent Type 2025 & 2033
- Figure 52: Middle East and Africa Lithium-Ion Battery Electrolyte Solvent Industry Volume (liter), by Solvent Type 2025 & 2033
- Figure 53: Middle East and Africa Lithium-Ion Battery Electrolyte Solvent Industry Revenue Share (%), by Solvent Type 2025 & 2033
- Figure 54: Middle East and Africa Lithium-Ion Battery Electrolyte Solvent Industry Volume Share (%), by Solvent Type 2025 & 2033
- Figure 55: Middle East and Africa Lithium-Ion Battery Electrolyte Solvent Industry Revenue (billion), by Application 2025 & 2033
- Figure 56: Middle East and Africa Lithium-Ion Battery Electrolyte Solvent Industry Volume (liter), by Application 2025 & 2033
- Figure 57: Middle East and Africa Lithium-Ion Battery Electrolyte Solvent Industry Revenue Share (%), by Application 2025 & 2033
- Figure 58: Middle East and Africa Lithium-Ion Battery Electrolyte Solvent Industry Volume Share (%), by Application 2025 & 2033
- Figure 59: Middle East and Africa Lithium-Ion Battery Electrolyte Solvent Industry Revenue (billion), by Country 2025 & 2033
- Figure 60: Middle East and Africa Lithium-Ion Battery Electrolyte Solvent Industry Volume (liter), by Country 2025 & 2033
- Figure 61: Middle East and Africa Lithium-Ion Battery Electrolyte Solvent Industry Revenue Share (%), by Country 2025 & 2033
- Figure 62: Middle East and Africa Lithium-Ion Battery Electrolyte Solvent Industry Volume Share (%), by Country 2025 & 2033
List of Tables
- Table 1: Global Lithium-Ion Battery Electrolyte Solvent Industry Revenue billion Forecast, by Solvent Type 2020 & 2033
- Table 2: Global Lithium-Ion Battery Electrolyte Solvent Industry Volume liter Forecast, by Solvent Type 2020 & 2033
- Table 3: Global Lithium-Ion Battery Electrolyte Solvent Industry Revenue billion Forecast, by Application 2020 & 2033
- Table 4: Global Lithium-Ion Battery Electrolyte Solvent Industry Volume liter Forecast, by Application 2020 & 2033
- Table 5: Global Lithium-Ion Battery Electrolyte Solvent Industry Revenue billion Forecast, by Region 2020 & 2033
- Table 6: Global Lithium-Ion Battery Electrolyte Solvent Industry Volume liter Forecast, by Region 2020 & 2033
- Table 7: Global Lithium-Ion Battery Electrolyte Solvent Industry Revenue billion Forecast, by Solvent Type 2020 & 2033
- Table 8: Global Lithium-Ion Battery Electrolyte Solvent Industry Volume liter Forecast, by Solvent Type 2020 & 2033
- Table 9: Global Lithium-Ion Battery Electrolyte Solvent Industry Revenue billion Forecast, by Application 2020 & 2033
- Table 10: Global Lithium-Ion Battery Electrolyte Solvent Industry Volume liter Forecast, by Application 2020 & 2033
- Table 11: Global Lithium-Ion Battery Electrolyte Solvent Industry Revenue billion Forecast, by Country 2020 & 2033
- Table 12: Global Lithium-Ion Battery Electrolyte Solvent Industry Volume liter Forecast, by Country 2020 & 2033
- Table 13: China Lithium-Ion Battery Electrolyte Solvent Industry Revenue (billion) Forecast, by Application 2020 & 2033
- Table 14: China Lithium-Ion Battery Electrolyte Solvent Industry Volume (liter) Forecast, by Application 2020 & 2033
- Table 15: India Lithium-Ion Battery Electrolyte Solvent Industry Revenue (billion) Forecast, by Application 2020 & 2033
- Table 16: India Lithium-Ion Battery Electrolyte Solvent Industry Volume (liter) Forecast, by Application 2020 & 2033
- Table 17: Japan Lithium-Ion Battery Electrolyte Solvent Industry Revenue (billion) Forecast, by Application 2020 & 2033
- Table 18: Japan Lithium-Ion Battery Electrolyte Solvent Industry Volume (liter) Forecast, by Application 2020 & 2033
- Table 19: South Korea Lithium-Ion Battery Electrolyte Solvent Industry Revenue (billion) Forecast, by Application 2020 & 2033
- Table 20: South Korea Lithium-Ion Battery Electrolyte Solvent Industry Volume (liter) Forecast, by Application 2020 & 2033
- Table 21: ASEAN Countries Lithium-Ion Battery Electrolyte Solvent Industry Revenue (billion) Forecast, by Application 2020 & 2033
- Table 22: ASEAN Countries Lithium-Ion Battery Electrolyte Solvent Industry Volume (liter) Forecast, by Application 2020 & 2033
- Table 23: Rest of Asia Pacific Lithium-Ion Battery Electrolyte Solvent Industry Revenue (billion) Forecast, by Application 2020 & 2033
- Table 24: Rest of Asia Pacific Lithium-Ion Battery Electrolyte Solvent Industry Volume (liter) Forecast, by Application 2020 & 2033
- Table 25: Global Lithium-Ion Battery Electrolyte Solvent Industry Revenue billion Forecast, by Solvent Type 2020 & 2033
- Table 26: Global Lithium-Ion Battery Electrolyte Solvent Industry Volume liter Forecast, by Solvent Type 2020 & 2033
- Table 27: Global Lithium-Ion Battery Electrolyte Solvent Industry Revenue billion Forecast, by Application 2020 & 2033
- Table 28: Global Lithium-Ion Battery Electrolyte Solvent Industry Volume liter Forecast, by Application 2020 & 2033
- Table 29: Global Lithium-Ion Battery Electrolyte Solvent Industry Revenue billion Forecast, by Country 2020 & 2033
- Table 30: Global Lithium-Ion Battery Electrolyte Solvent Industry Volume liter Forecast, by Country 2020 & 2033
- Table 31: United States Lithium-Ion Battery Electrolyte Solvent Industry Revenue (billion) Forecast, by Application 2020 & 2033
- Table 32: United States Lithium-Ion Battery Electrolyte Solvent Industry Volume (liter) Forecast, by Application 2020 & 2033
- Table 33: Canada Lithium-Ion Battery Electrolyte Solvent Industry Revenue (billion) Forecast, by Application 2020 & 2033
- Table 34: Canada Lithium-Ion Battery Electrolyte Solvent Industry Volume (liter) Forecast, by Application 2020 & 2033
- Table 35: Mexico Lithium-Ion Battery Electrolyte Solvent Industry Revenue (billion) Forecast, by Application 2020 & 2033
- Table 36: Mexico Lithium-Ion Battery Electrolyte Solvent Industry Volume (liter) Forecast, by Application 2020 & 2033
- Table 37: Global Lithium-Ion Battery Electrolyte Solvent Industry Revenue billion Forecast, by Solvent Type 2020 & 2033
- Table 38: Global Lithium-Ion Battery Electrolyte Solvent Industry Volume liter Forecast, by Solvent Type 2020 & 2033
- Table 39: Global Lithium-Ion Battery Electrolyte Solvent Industry Revenue billion Forecast, by Application 2020 & 2033
- Table 40: Global Lithium-Ion Battery Electrolyte Solvent Industry Volume liter Forecast, by Application 2020 & 2033
- Table 41: Global Lithium-Ion Battery Electrolyte Solvent Industry Revenue billion Forecast, by Country 2020 & 2033
- Table 42: Global Lithium-Ion Battery Electrolyte Solvent Industry Volume liter Forecast, by Country 2020 & 2033
- Table 43: Germany Lithium-Ion Battery Electrolyte Solvent Industry Revenue (billion) Forecast, by Application 2020 & 2033
- Table 44: Germany Lithium-Ion Battery Electrolyte Solvent Industry Volume (liter) Forecast, by Application 2020 & 2033
- Table 45: France Lithium-Ion Battery Electrolyte Solvent Industry Revenue (billion) Forecast, by Application 2020 & 2033
- Table 46: France Lithium-Ion Battery Electrolyte Solvent Industry Volume (liter) Forecast, by Application 2020 & 2033
- Table 47: United Kingdom Lithium-Ion Battery Electrolyte Solvent Industry Revenue (billion) Forecast, by Application 2020 & 2033
- Table 48: United Kingdom Lithium-Ion Battery Electrolyte Solvent Industry Volume (liter) Forecast, by Application 2020 & 2033
- Table 49: Italy Lithium-Ion Battery Electrolyte Solvent Industry Revenue (billion) Forecast, by Application 2020 & 2033
- Table 50: Italy Lithium-Ion Battery Electrolyte Solvent Industry Volume (liter) Forecast, by Application 2020 & 2033
- Table 51: Rest of Europe Lithium-Ion Battery Electrolyte Solvent Industry Revenue (billion) Forecast, by Application 2020 & 2033
- Table 52: Rest of Europe Lithium-Ion Battery Electrolyte Solvent Industry Volume (liter) Forecast, by Application 2020 & 2033
- Table 53: Global Lithium-Ion Battery Electrolyte Solvent Industry Revenue billion Forecast, by Solvent Type 2020 & 2033
- Table 54: Global Lithium-Ion Battery Electrolyte Solvent Industry Volume liter Forecast, by Solvent Type 2020 & 2033
- Table 55: Global Lithium-Ion Battery Electrolyte Solvent Industry Revenue billion Forecast, by Application 2020 & 2033
- Table 56: Global Lithium-Ion Battery Electrolyte Solvent Industry Volume liter Forecast, by Application 2020 & 2033
- Table 57: Global Lithium-Ion Battery Electrolyte Solvent Industry Revenue billion Forecast, by Country 2020 & 2033
- Table 58: Global Lithium-Ion Battery Electrolyte Solvent Industry Volume liter Forecast, by Country 2020 & 2033
- Table 59: Brazil Lithium-Ion Battery Electrolyte Solvent Industry Revenue (billion) Forecast, by Application 2020 & 2033
- Table 60: Brazil Lithium-Ion Battery Electrolyte Solvent Industry Volume (liter) Forecast, by Application 2020 & 2033
- Table 61: Argentina Lithium-Ion Battery Electrolyte Solvent Industry Revenue (billion) Forecast, by Application 2020 & 2033
- Table 62: Argentina Lithium-Ion Battery Electrolyte Solvent Industry Volume (liter) Forecast, by Application 2020 & 2033
- Table 63: Rest of South America Lithium-Ion Battery Electrolyte Solvent Industry Revenue (billion) Forecast, by Application 2020 & 2033
- Table 64: Rest of South America Lithium-Ion Battery Electrolyte Solvent Industry Volume (liter) Forecast, by Application 2020 & 2033
- Table 65: Global Lithium-Ion Battery Electrolyte Solvent Industry Revenue billion Forecast, by Solvent Type 2020 & 2033
- Table 66: Global Lithium-Ion Battery Electrolyte Solvent Industry Volume liter Forecast, by Solvent Type 2020 & 2033
- Table 67: Global Lithium-Ion Battery Electrolyte Solvent Industry Revenue billion Forecast, by Application 2020 & 2033
- Table 68: Global Lithium-Ion Battery Electrolyte Solvent Industry Volume liter Forecast, by Application 2020 & 2033
- Table 69: Global Lithium-Ion Battery Electrolyte Solvent Industry Revenue billion Forecast, by Country 2020 & 2033
- Table 70: Global Lithium-Ion Battery Electrolyte Solvent Industry Volume liter Forecast, by Country 2020 & 2033
- Table 71: Saudi Arabia Lithium-Ion Battery Electrolyte Solvent Industry Revenue (billion) Forecast, by Application 2020 & 2033
- Table 72: Saudi Arabia Lithium-Ion Battery Electrolyte Solvent Industry Volume (liter) Forecast, by Application 2020 & 2033
- Table 73: South Africa Lithium-Ion Battery Electrolyte Solvent Industry Revenue (billion) Forecast, by Application 2020 & 2033
- Table 74: South Africa Lithium-Ion Battery Electrolyte Solvent Industry Volume (liter) Forecast, by Application 2020 & 2033
- Table 75: Rest of Middle East and Africa Lithium-Ion Battery Electrolyte Solvent Industry Revenue (billion) Forecast, by Application 2020 & 2033
- Table 76: Rest of Middle East and Africa Lithium-Ion Battery Electrolyte Solvent Industry Volume (liter) Forecast, by Application 2020 & 2033
Frequently Asked Questions
1. What is the projected Compound Annual Growth Rate (CAGR) of the Lithium-Ion Battery Electrolyte Solvent Industry?
The projected CAGR is approximately 12.83%.
2. Which companies are prominent players in the Lithium-Ion Battery Electrolyte Solvent Industry?
Key companies in the market include Merck KGaA, UBE Corporation, Mitsubishi Chemical Corporation, Connect Chemicals, Kindun Chemical Co Limited, OUCC, Lotte Chemical, Dongwha Electrolyte, BASF SE, Huntsman International LLC, Sankyo Chemical Co Ltd, Zhengzhou Meiya Chemical Products Co Ltd, Shenzhen Capchem Technology Co Ltd (CAPCHEM), Lixing Chemical.
3. What are the main segments of the Lithium-Ion Battery Electrolyte Solvent Industry?
The market segments include Solvent Type, Application.
4. Can you provide details about the market size?
The market size is estimated to be USD 8.369 billion as of 2022.
5. What are some drivers contributing to market growth?
Increasing Demand from Electric Vehicle Manufacturers; Growing Demand from Smartphone Manufacturers.
6. What are the notable trends driving market growth?
Increasing demand from Electric Mobility/Vehicles Applications.
7. Are there any restraints impacting market growth?
Potential Hazards Caused by Using Impure Electrolyte Solvents; Other Restraints.
8. Can you provide examples of recent developments in the market?
In July 2022, UBE Corporation started the study for the feasibility of a construction site to produce Dimethyl Carbonate (DMC) and Ethyl Methyl Carbonate (EMC) in Louisiana, United States which are the principal component of the solvent for electrolytes in lithium-ion batteries. The company planned a production plant with a planned production capacity of 100,000 metric tons per year of DMC and 40,000 metric tons per year of EMC for which the company is planning a final investment decision by the first half of fiscal 2023, and operations to commence in the second half of fiscal 2025.
9. What pricing options are available for accessing the report?
Pricing options include single-user, multi-user, and enterprise licenses priced at USD 4750, USD 5250, and USD 8750 respectively.
10. Is the market size provided in terms of value or volume?
The market size is provided in terms of value, measured in billion and volume, measured in liter.
11. Are there any specific market keywords associated with the report?
Yes, the market keyword associated with the report is "Lithium-Ion Battery Electrolyte Solvent Industry," which aids in identifying and referencing the specific market segment covered.
12. How do I determine which pricing option suits my needs best?
The pricing options vary based on user requirements and access needs. Individual users may opt for single-user licenses, while businesses requiring broader access may choose multi-user or enterprise licenses for cost-effective access to the report.
13. Are there any additional resources or data provided in the Lithium-Ion Battery Electrolyte Solvent Industry report?
While the report offers comprehensive insights, it's advisable to review the specific contents or supplementary materials provided to ascertain if additional resources or data are available.
14. How can I stay updated on further developments or reports in the Lithium-Ion Battery Electrolyte Solvent Industry?
To stay informed about further developments, trends, and reports in the Lithium-Ion Battery Electrolyte Solvent Industry, consider subscribing to industry newsletters, following relevant companies and organizations, or regularly checking reputable industry news sources and publications.
Methodology
Step 1 - Identification of Relevant Samples Size from Population Database


Step 2 - Approaches for Defining Global Market Size (Value, Volume* & Price*)

Note*: In applicable scenarios
Step 3 - Data Sources
Primary Research
- Web Analytics
- Survey Reports
- Research Institute
- Latest Research Reports
- Opinion Leaders
Secondary Research
- Annual Reports
- White Paper
- Latest Press Release
- Industry Association
- Paid Database
- Investor Presentations

Step 4 - Data Triangulation
Involves using different sources of information in order to increase the validity of a study
These sources are likely to be stakeholders in a program - participants, other researchers, program staff, other community members, and so on.
Then we put all data in single framework & apply various statistical tools to find out the dynamic on the market.
During the analysis stage, feedback from the stakeholder groups would be compared to determine areas of agreement as well as areas of divergence