

Key Insights
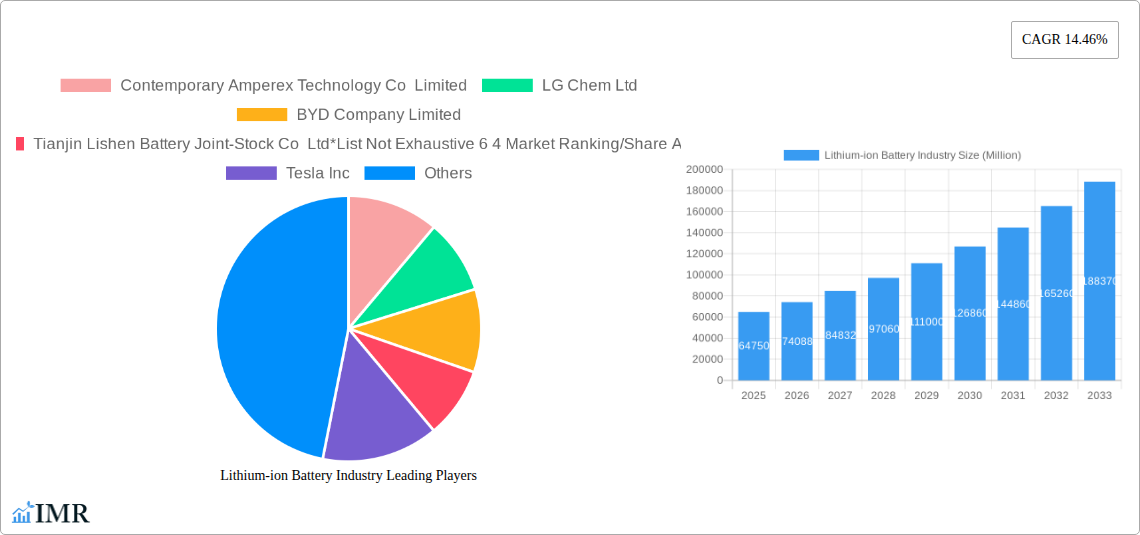
The global lithium-ion battery market, valued at $64.75 billion in 2025, is experiencing robust growth, projected to expand at a compound annual growth rate (CAGR) of 14.46% from 2025 to 2033. This surge is driven by the escalating demand for electric vehicles (EVs), the increasing adoption of renewable energy sources like solar and wind power necessitating energy storage solutions, and the growing use of lithium-ion batteries in portable electronics and other applications. The automotive sector is a major driver, with substantial investments in EV infrastructure and production fueling the demand for high-capacity, long-lasting batteries. Furthermore, advancements in battery technology, such as improvements in energy density and charging speed, are expanding market possibilities. However, challenges persist, including the fluctuating prices of raw materials like lithium and cobalt, concerns about battery safety and lifespan, and the environmental impact of battery production and disposal. These factors influence the market's trajectory, requiring ongoing innovation and sustainable practices for long-term growth.
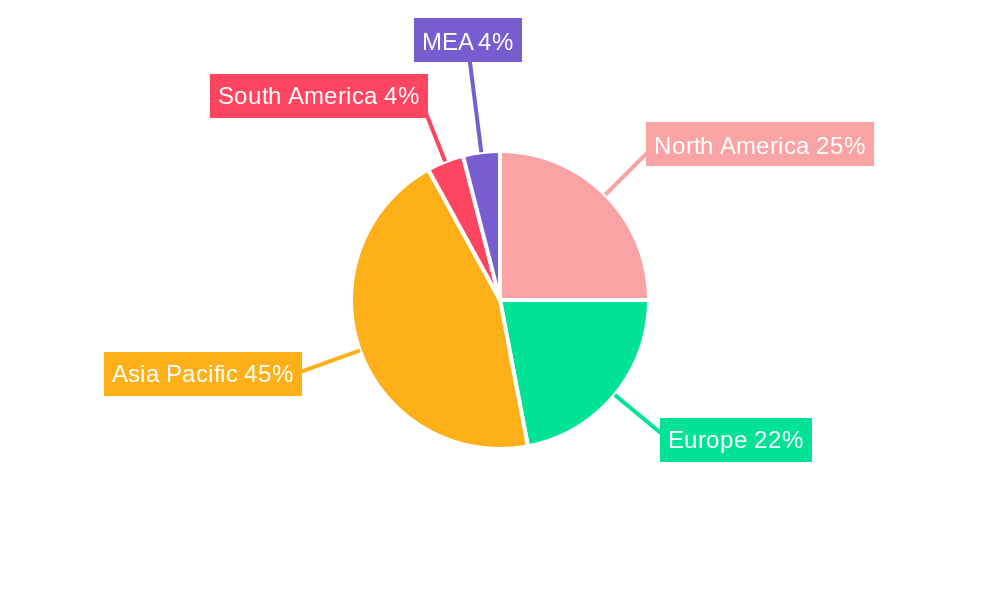
Significant regional variations exist within the market. North America and Asia Pacific are expected to remain dominant players due to substantial manufacturing capacities and robust demand from the automotive and electronics sectors. Within Asia Pacific, China is leading the way due to its extensive manufacturing capabilities and government initiatives promoting electric mobility. Europe is also seeing significant growth, propelled by stringent emission regulations and a growing focus on renewable energy integration. While South America and the Middle East and Africa show promise, their market share is presently smaller compared to the other regions, with growth largely dependent on infrastructure development and economic conditions. The market segmentation by application reflects the diverse uses of lithium-ion batteries, with electronic devices, automobiles, and stationary energy storage (including UPS, renewables, and industrial applications) representing the largest segments. This diversity indicates the market's resilience and potential for sustained growth across multiple sectors.
Lithium-ion Battery Industry Market Report: 2019-2033
This comprehensive report provides a detailed analysis of the global lithium-ion battery industry, covering market dynamics, growth trends, regional dominance, product landscape, key players, and future outlook. The study period spans from 2019 to 2033, with 2025 as the base and estimated year. This report is invaluable for industry professionals, investors, and researchers seeking in-depth insights into this rapidly evolving sector. The report analyzes the parent market of energy storage solutions and the child market of lithium-ion batteries, providing a granular understanding of market segmentation and dynamics.
Lithium-ion Battery Industry Market Dynamics & Structure
The lithium-ion battery market is characterized by intense competition, rapid technological advancements, and evolving regulatory landscapes. Market concentration is moderately high, with key players like Contemporary Amperex Technology Co Limited (CATL), LG Chem Ltd, BYD Company Limited, and Panasonic Corporation holding significant market share. However, the market also features numerous smaller players, fostering innovation and competition.
- Market Concentration: The top 5 players hold approximately xx% of the global market share in 2025 (estimated).
- Technological Innovation: Continuous R&D efforts focus on improving energy density, lifespan, safety, and reducing costs. Solid-state battery technology represents a significant area of innovation.
- Regulatory Frameworks: Governments worldwide are implementing policies to promote electric vehicle adoption and renewable energy storage, significantly impacting market growth.
- Competitive Substitutes: While lithium-ion batteries currently dominate, alternative technologies like solid-state batteries and flow batteries pose potential long-term competition.
- End-User Demographics: The key end-user segments are automobiles, electronic devices, and stationary energy storage systems. Market growth is heavily influenced by the increasing demand for electric vehicles and renewable energy integration.
- M&A Trends: Consolidation is expected to continue, with larger players acquiring smaller companies to expand their technology portfolios and market reach. xx M&A deals were recorded between 2019 and 2024, totaling approximately $xx million.
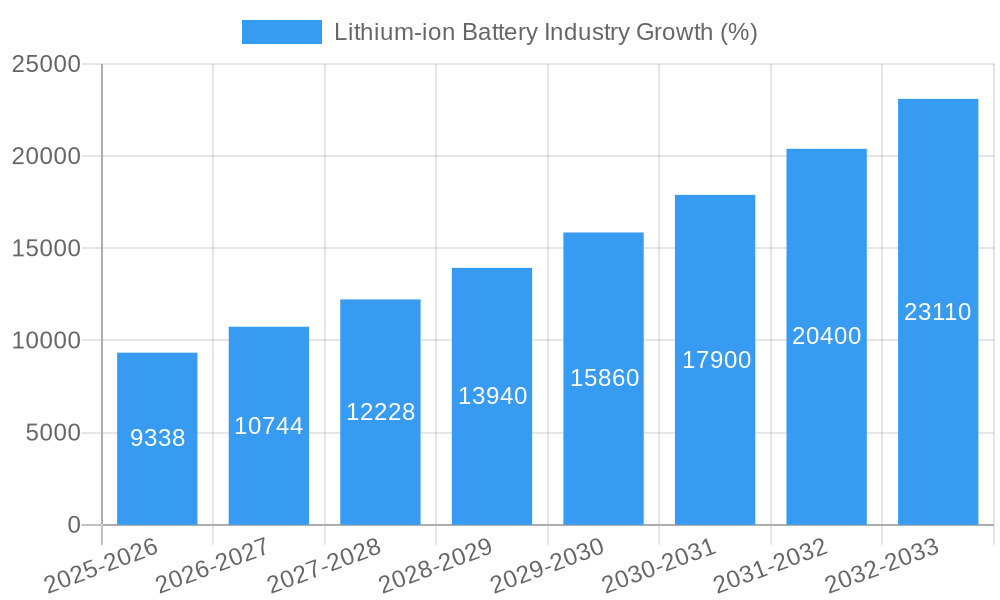
Lithium-ion Battery Industry Growth Trends & Insights
The global lithium-ion battery market is experiencing robust growth, driven by the surging demand for electric vehicles (EVs), portable electronic devices, and energy storage solutions. The market size reached xx million units in 2024 and is projected to reach xx million units by 2033, exhibiting a CAGR of xx% during the forecast period (2025-2033). This growth is fueled by several factors, including increasing environmental concerns, government incentives for EV adoption, and the declining cost of lithium-ion batteries. Technological advancements, such as improved energy density and faster charging capabilities, are further accelerating market adoption. Consumer behavior is shifting towards eco-friendly products, boosting the demand for lithium-ion batteries in various applications.
Dominant Regions, Countries, or Segments in Lithium-ion Battery Industry
Asia, particularly China, currently dominates the lithium-ion battery market, driven by robust domestic demand for EVs and significant manufacturing capacity. Europe and North America are also witnessing substantial growth, supported by supportive government policies and increasing investments in renewable energy infrastructure.
- Automotive: This segment is the fastest-growing, driven by the global shift towards electric vehicles. xx million units were sold in 2024 (estimated).
- Electronic Devices: This segment remains a significant market, with continued demand for smartphones, laptops, and other portable electronics. xx million units were sold in 2024 (estimated).
- Stationary Energy Storage: This segment is rapidly expanding due to the increasing adoption of renewable energy sources, such as solar and wind power. xx million units were sold in 2024 (estimated).
- Other Applications: This segment includes power tools, medical devices, and other applications, which show steady growth. xx million units were sold in 2024 (estimated).
Lithium-ion Battery Industry Product Landscape
The lithium-ion battery market offers a wide range of products with varying chemistries (e.g., NMC, LFP, LCO), form factors, and energy densities. Recent innovations focus on improving safety features, extending lifespan, and enhancing fast-charging capabilities. Key selling propositions include higher energy density, improved thermal stability, and enhanced cycle life. Technological advancements in materials science and manufacturing processes are leading to more efficient and cost-effective battery production.
Key Drivers, Barriers & Challenges in Lithium-ion Battery Industry
Key Drivers:
- The increasing demand for electric vehicles is a major driver.
- Growing adoption of renewable energy sources like solar and wind power is another key driver.
- Government incentives and regulations promoting clean energy technologies are further accelerating market growth.
Challenges:
- Supply chain disruptions and raw material price volatility represent major challenges. The impact is estimated at a xx% increase in production costs in 2024.
- Stringent safety regulations and environmental concerns can hinder market expansion.
- Intense competition among manufacturers is impacting profit margins.
Emerging Opportunities in Lithium-ion Battery Industry
- Development of next-generation battery technologies, such as solid-state batteries.
- Expansion into new applications, such as grid-scale energy storage and microgrids.
- Growth in developing economies with increasing demand for affordable energy solutions.
Growth Accelerators in the Lithium-ion Battery Industry Industry
Technological breakthroughs in battery chemistry and manufacturing processes are key growth catalysts. Strategic partnerships and collaborations among battery manufacturers, automakers, and energy companies are driving innovation and market expansion. Government support and investments in battery research and development are fueling further growth.
Key Players Shaping the Lithium-ion Battery Industry Market
- Contemporary Amperex Technology Co Limited
- LG Chem Ltd
- BYD Company Limited
- Tianjin Lishen Battery Joint-Stock Co Ltd
- Tesla Inc
- Samsung SDI
- Panasonic Corporation
- Sony Corporation
Notable Milestones in Lithium-ion Battery Industry Sector
- January 2024: Amara Raja Batteries Ltd announced plans for a gigafactory in India (16 GWh lithium cells, 5 GWh battery packs).
- August 2023: Reliance Industries Limited planned a lithium-ion battery gigafactory in India by 2026.
In-Depth Lithium-ion Battery Industry Market Outlook
The lithium-ion battery market is poised for sustained growth over the next decade. Technological advancements, increasing demand from diverse sectors, and supportive government policies will continue to drive market expansion. Strategic partnerships and investments in research and development will play a crucial role in shaping the future of this dynamic industry. The market presents significant opportunities for companies that can innovate, adapt, and meet the evolving demands of a rapidly changing landscape.
Lithium-ion Battery Industry Segmentation
-
1. Application
- 1.1. Electronic Devices
- 1.2. Automobile
- 1.3. Stationa
- 1.4. Other Ap
Lithium-ion Battery Industry Segmentation By Geography
-
1. North America
- 1.1. United States
- 1.2. Canada
- 1.3. Rest of the North America
-
2. Europe
- 2.1. Spain
- 2.2. Nordic
- 2.3. United Kingdom
- 2.4. Russia
- 2.5. Turkey
- 2.6. Germany
- 2.7. Italy
- 2.8. Rest of the Europe
-
3. Asia Pacific
- 3.1. China
- 3.2. India
- 3.3. Japan
- 3.4. Malaysia
- 3.5. Thailand
- 3.6. Indonesia
- 3.7. Vietnam
- 3.8. Rest of Asia Pacific
-
4. South America
- 4.1. Brazil
- 4.2. Argentina
- 4.3. Colmbia
- 4.4. Rest of South America
-
5. Middle East and Africa
- 5.1. United Arab Emirates
- 5.2. Saudi Arabia
- 5.3. South Africa
- 5.4. Nigeria
- 5.5. Qatar
- 5.6. Egypt
- 5.7. Rest of the Middle East and Africa
Lithium-ion Battery Industry REPORT HIGHLIGHTS
| Aspects | Details |
|---|---|
| Study Period | 2019-2033 |
| Base Year | 2024 |
| Estimated Year | 2025 |
| Forecast Period | 2025-2033 |
| Historical Period | 2019-2024 |
| Growth Rate | CAGR of 14.46% from 2019-2033 |
| Segmentation |
|
Table of Contents
- 1. Introduction
- 1.1. Research Scope
- 1.2. Market Segmentation
- 1.3. Research Methodology
- 1.4. Definitions and Assumptions
- 2. Executive Summary
- 2.1. Introduction
- 3. Market Dynamics
- 3.1. Introduction
- 3.2. Market Drivers
- 3.2.1. 4.; Supportive Government Initiatives And Policies To Adopt Renewable Energy4.; Declining Cost Of Lithium-ion Batteries
- 3.3. Market Restrains
- 3.3.1. 4.; Demand-Supply Mismatch of Raw Materials
- 3.4. Market Trends
- 3.4.1. The Automobile Segment Expected to Dominate the Market
- 4. Market Factor Analysis
- 4.1. Porters Five Forces
- 4.2. Supply/Value Chain
- 4.3. PESTEL analysis
- 4.4. Market Entropy
- 4.5. Patent/Trademark Analysis
- 5. Global Lithium-ion Battery Industry Analysis, Insights and Forecast, 2019-2031
- 5.1. Market Analysis, Insights and Forecast - by Application
- 5.1.1. Electronic Devices
- 5.1.2. Automobile
- 5.1.3. Stationa
- 5.1.4. Other Ap
- 5.2. Market Analysis, Insights and Forecast - by Region
- 5.2.1. North America
- 5.2.2. Europe
- 5.2.3. Asia Pacific
- 5.2.4. South America
- 5.2.5. Middle East and Africa
- 5.1. Market Analysis, Insights and Forecast - by Application
- 6. North America Lithium-ion Battery Industry Analysis, Insights and Forecast, 2019-2031
- 6.1. Market Analysis, Insights and Forecast - by Application
- 6.1.1. Electronic Devices
- 6.1.2. Automobile
- 6.1.3. Stationa
- 6.1.4. Other Ap
- 6.1. Market Analysis, Insights and Forecast - by Application
- 7. Europe Lithium-ion Battery Industry Analysis, Insights and Forecast, 2019-2031
- 7.1. Market Analysis, Insights and Forecast - by Application
- 7.1.1. Electronic Devices
- 7.1.2. Automobile
- 7.1.3. Stationa
- 7.1.4. Other Ap
- 7.1. Market Analysis, Insights and Forecast - by Application
- 8. Asia Pacific Lithium-ion Battery Industry Analysis, Insights and Forecast, 2019-2031
- 8.1. Market Analysis, Insights and Forecast - by Application
- 8.1.1. Electronic Devices
- 8.1.2. Automobile
- 8.1.3. Stationa
- 8.1.4. Other Ap
- 8.1. Market Analysis, Insights and Forecast - by Application
- 9. South America Lithium-ion Battery Industry Analysis, Insights and Forecast, 2019-2031
- 9.1. Market Analysis, Insights and Forecast - by Application
- 9.1.1. Electronic Devices
- 9.1.2. Automobile
- 9.1.3. Stationa
- 9.1.4. Other Ap
- 9.1. Market Analysis, Insights and Forecast - by Application
- 10. Middle East and Africa Lithium-ion Battery Industry Analysis, Insights and Forecast, 2019-2031
- 10.1. Market Analysis, Insights and Forecast - by Application
- 10.1.1. Electronic Devices
- 10.1.2. Automobile
- 10.1.3. Stationa
- 10.1.4. Other Ap
- 10.1. Market Analysis, Insights and Forecast - by Application
- 11. North America Lithium-ion Battery Industry Analysis, Insights and Forecast, 2019-2031
- 11.1. Market Analysis, Insights and Forecast - By Country/Sub-region
- 11.1.1 United States
- 11.1.2 Canada
- 11.1.3 Mexico
- 12. Europe Lithium-ion Battery Industry Analysis, Insights and Forecast, 2019-2031
- 12.1. Market Analysis, Insights and Forecast - By Country/Sub-region
- 12.1.1 Germany
- 12.1.2 United Kingdom
- 12.1.3 France
- 12.1.4 Spain
- 12.1.5 Italy
- 12.1.6 Spain
- 12.1.7 Belgium
- 12.1.8 Netherland
- 12.1.9 Nordics
- 12.1.10 Rest of Europe
- 13. Asia Pacific Lithium-ion Battery Industry Analysis, Insights and Forecast, 2019-2031
- 13.1. Market Analysis, Insights and Forecast - By Country/Sub-region
- 13.1.1 China
- 13.1.2 Japan
- 13.1.3 India
- 13.1.4 South Korea
- 13.1.5 Southeast Asia
- 13.1.6 Australia
- 13.1.7 Indonesia
- 13.1.8 Phillipes
- 13.1.9 Singapore
- 13.1.10 Thailandc
- 13.1.11 Rest of Asia Pacific
- 14. South America Lithium-ion Battery Industry Analysis, Insights and Forecast, 2019-2031
- 14.1. Market Analysis, Insights and Forecast - By Country/Sub-region
- 14.1.1 Brazil
- 14.1.2 Argentina
- 14.1.3 Peru
- 14.1.4 Chile
- 14.1.5 Colombia
- 14.1.6 Ecuador
- 14.1.7 Venezuela
- 14.1.8 Rest of South America
- 15. North America Lithium-ion Battery Industry Analysis, Insights and Forecast, 2019-2031
- 15.1. Market Analysis, Insights and Forecast - By Country/Sub-region
- 15.1.1 United States
- 15.1.2 Canada
- 15.1.3 Mexico
- 16. MEA Lithium-ion Battery Industry Analysis, Insights and Forecast, 2019-2031
- 16.1. Market Analysis, Insights and Forecast - By Country/Sub-region
- 16.1.1 United Arab Emirates
- 16.1.2 Saudi Arabia
- 16.1.3 South Africa
- 16.1.4 Rest of Middle East and Africa
- 17. Competitive Analysis
- 17.1. Global Market Share Analysis 2024
- 17.2. Company Profiles
- 17.2.1 Contemporary Amperex Technology Co Limited
- 17.2.1.1. Overview
- 17.2.1.2. Products
- 17.2.1.3. SWOT Analysis
- 17.2.1.4. Recent Developments
- 17.2.1.5. Financials (Based on Availability)
- 17.2.2 LG Chem Ltd
- 17.2.2.1. Overview
- 17.2.2.2. Products
- 17.2.2.3. SWOT Analysis
- 17.2.2.4. Recent Developments
- 17.2.2.5. Financials (Based on Availability)
- 17.2.3 BYD Company Limited
- 17.2.3.1. Overview
- 17.2.3.2. Products
- 17.2.3.3. SWOT Analysis
- 17.2.3.4. Recent Developments
- 17.2.3.5. Financials (Based on Availability)
- 17.2.4 Tianjin Lishen Battery Joint-Stock Co Ltd*List Not Exhaustive 6 4 Market Ranking/Share Analysi
- 17.2.4.1. Overview
- 17.2.4.2. Products
- 17.2.4.3. SWOT Analysis
- 17.2.4.4. Recent Developments
- 17.2.4.5. Financials (Based on Availability)
- 17.2.5 Tesla Inc
- 17.2.5.1. Overview
- 17.2.5.2. Products
- 17.2.5.3. SWOT Analysis
- 17.2.5.4. Recent Developments
- 17.2.5.5. Financials (Based on Availability)
- 17.2.6 Samsung SDI
- 17.2.6.1. Overview
- 17.2.6.2. Products
- 17.2.6.3. SWOT Analysis
- 17.2.6.4. Recent Developments
- 17.2.6.5. Financials (Based on Availability)
- 17.2.7 Panasonic Corporation
- 17.2.7.1. Overview
- 17.2.7.2. Products
- 17.2.7.3. SWOT Analysis
- 17.2.7.4. Recent Developments
- 17.2.7.5. Financials (Based on Availability)
- 17.2.8 Sony Corporation
- 17.2.8.1. Overview
- 17.2.8.2. Products
- 17.2.8.3. SWOT Analysis
- 17.2.8.4. Recent Developments
- 17.2.8.5. Financials (Based on Availability)
- 17.2.1 Contemporary Amperex Technology Co Limited
List of Figures
- Figure 1: Global Lithium-ion Battery Industry Revenue Breakdown (Million, %) by Region 2024 & 2032
- Figure 2: Global Lithium-ion Battery Industry Volume Breakdown (K Units, %) by Region 2024 & 2032
- Figure 3: North America Lithium-ion Battery Industry Revenue (Million), by Country 2024 & 2032
- Figure 4: North America Lithium-ion Battery Industry Volume (K Units), by Country 2024 & 2032
- Figure 5: North America Lithium-ion Battery Industry Revenue Share (%), by Country 2024 & 2032
- Figure 6: North America Lithium-ion Battery Industry Volume Share (%), by Country 2024 & 2032
- Figure 7: Europe Lithium-ion Battery Industry Revenue (Million), by Country 2024 & 2032
- Figure 8: Europe Lithium-ion Battery Industry Volume (K Units), by Country 2024 & 2032
- Figure 9: Europe Lithium-ion Battery Industry Revenue Share (%), by Country 2024 & 2032
- Figure 10: Europe Lithium-ion Battery Industry Volume Share (%), by Country 2024 & 2032
- Figure 11: Asia Pacific Lithium-ion Battery Industry Revenue (Million), by Country 2024 & 2032
- Figure 12: Asia Pacific Lithium-ion Battery Industry Volume (K Units), by Country 2024 & 2032
- Figure 13: Asia Pacific Lithium-ion Battery Industry Revenue Share (%), by Country 2024 & 2032
- Figure 14: Asia Pacific Lithium-ion Battery Industry Volume Share (%), by Country 2024 & 2032
- Figure 15: South America Lithium-ion Battery Industry Revenue (Million), by Country 2024 & 2032
- Figure 16: South America Lithium-ion Battery Industry Volume (K Units), by Country 2024 & 2032
- Figure 17: South America Lithium-ion Battery Industry Revenue Share (%), by Country 2024 & 2032
- Figure 18: South America Lithium-ion Battery Industry Volume Share (%), by Country 2024 & 2032
- Figure 19: North America Lithium-ion Battery Industry Revenue (Million), by Country 2024 & 2032
- Figure 20: North America Lithium-ion Battery Industry Volume (K Units), by Country 2024 & 2032
- Figure 21: North America Lithium-ion Battery Industry Revenue Share (%), by Country 2024 & 2032
- Figure 22: North America Lithium-ion Battery Industry Volume Share (%), by Country 2024 & 2032
- Figure 23: MEA Lithium-ion Battery Industry Revenue (Million), by Country 2024 & 2032
- Figure 24: MEA Lithium-ion Battery Industry Volume (K Units), by Country 2024 & 2032
- Figure 25: MEA Lithium-ion Battery Industry Revenue Share (%), by Country 2024 & 2032
- Figure 26: MEA Lithium-ion Battery Industry Volume Share (%), by Country 2024 & 2032
- Figure 27: North America Lithium-ion Battery Industry Revenue (Million), by Application 2024 & 2032
- Figure 28: North America Lithium-ion Battery Industry Volume (K Units), by Application 2024 & 2032
- Figure 29: North America Lithium-ion Battery Industry Revenue Share (%), by Application 2024 & 2032
- Figure 30: North America Lithium-ion Battery Industry Volume Share (%), by Application 2024 & 2032
- Figure 31: North America Lithium-ion Battery Industry Revenue (Million), by Country 2024 & 2032
- Figure 32: North America Lithium-ion Battery Industry Volume (K Units), by Country 2024 & 2032
- Figure 33: North America Lithium-ion Battery Industry Revenue Share (%), by Country 2024 & 2032
- Figure 34: North America Lithium-ion Battery Industry Volume Share (%), by Country 2024 & 2032
- Figure 35: Europe Lithium-ion Battery Industry Revenue (Million), by Application 2024 & 2032
- Figure 36: Europe Lithium-ion Battery Industry Volume (K Units), by Application 2024 & 2032
- Figure 37: Europe Lithium-ion Battery Industry Revenue Share (%), by Application 2024 & 2032
- Figure 38: Europe Lithium-ion Battery Industry Volume Share (%), by Application 2024 & 2032
- Figure 39: Europe Lithium-ion Battery Industry Revenue (Million), by Country 2024 & 2032
- Figure 40: Europe Lithium-ion Battery Industry Volume (K Units), by Country 2024 & 2032
- Figure 41: Europe Lithium-ion Battery Industry Revenue Share (%), by Country 2024 & 2032
- Figure 42: Europe Lithium-ion Battery Industry Volume Share (%), by Country 2024 & 2032
- Figure 43: Asia Pacific Lithium-ion Battery Industry Revenue (Million), by Application 2024 & 2032
- Figure 44: Asia Pacific Lithium-ion Battery Industry Volume (K Units), by Application 2024 & 2032
- Figure 45: Asia Pacific Lithium-ion Battery Industry Revenue Share (%), by Application 2024 & 2032
- Figure 46: Asia Pacific Lithium-ion Battery Industry Volume Share (%), by Application 2024 & 2032
- Figure 47: Asia Pacific Lithium-ion Battery Industry Revenue (Million), by Country 2024 & 2032
- Figure 48: Asia Pacific Lithium-ion Battery Industry Volume (K Units), by Country 2024 & 2032
- Figure 49: Asia Pacific Lithium-ion Battery Industry Revenue Share (%), by Country 2024 & 2032
- Figure 50: Asia Pacific Lithium-ion Battery Industry Volume Share (%), by Country 2024 & 2032
- Figure 51: South America Lithium-ion Battery Industry Revenue (Million), by Application 2024 & 2032
- Figure 52: South America Lithium-ion Battery Industry Volume (K Units), by Application 2024 & 2032
- Figure 53: South America Lithium-ion Battery Industry Revenue Share (%), by Application 2024 & 2032
- Figure 54: South America Lithium-ion Battery Industry Volume Share (%), by Application 2024 & 2032
- Figure 55: South America Lithium-ion Battery Industry Revenue (Million), by Country 2024 & 2032
- Figure 56: South America Lithium-ion Battery Industry Volume (K Units), by Country 2024 & 2032
- Figure 57: South America Lithium-ion Battery Industry Revenue Share (%), by Country 2024 & 2032
- Figure 58: South America Lithium-ion Battery Industry Volume Share (%), by Country 2024 & 2032
- Figure 59: Middle East and Africa Lithium-ion Battery Industry Revenue (Million), by Application 2024 & 2032
- Figure 60: Middle East and Africa Lithium-ion Battery Industry Volume (K Units), by Application 2024 & 2032
- Figure 61: Middle East and Africa Lithium-ion Battery Industry Revenue Share (%), by Application 2024 & 2032
- Figure 62: Middle East and Africa Lithium-ion Battery Industry Volume Share (%), by Application 2024 & 2032
- Figure 63: Middle East and Africa Lithium-ion Battery Industry Revenue (Million), by Country 2024 & 2032
- Figure 64: Middle East and Africa Lithium-ion Battery Industry Volume (K Units), by Country 2024 & 2032
- Figure 65: Middle East and Africa Lithium-ion Battery Industry Revenue Share (%), by Country 2024 & 2032
- Figure 66: Middle East and Africa Lithium-ion Battery Industry Volume Share (%), by Country 2024 & 2032
List of Tables
- Table 1: Global Lithium-ion Battery Industry Revenue Million Forecast, by Region 2019 & 2032
- Table 2: Global Lithium-ion Battery Industry Volume K Units Forecast, by Region 2019 & 2032
- Table 3: Global Lithium-ion Battery Industry Revenue Million Forecast, by Application 2019 & 2032
- Table 4: Global Lithium-ion Battery Industry Volume K Units Forecast, by Application 2019 & 2032
- Table 5: Global Lithium-ion Battery Industry Revenue Million Forecast, by Region 2019 & 2032
- Table 6: Global Lithium-ion Battery Industry Volume K Units Forecast, by Region 2019 & 2032
- Table 7: Global Lithium-ion Battery Industry Revenue Million Forecast, by Country 2019 & 2032
- Table 8: Global Lithium-ion Battery Industry Volume K Units Forecast, by Country 2019 & 2032
- Table 9: United States Lithium-ion Battery Industry Revenue (Million) Forecast, by Application 2019 & 2032
- Table 10: United States Lithium-ion Battery Industry Volume (K Units) Forecast, by Application 2019 & 2032
- Table 11: Canada Lithium-ion Battery Industry Revenue (Million) Forecast, by Application 2019 & 2032
- Table 12: Canada Lithium-ion Battery Industry Volume (K Units) Forecast, by Application 2019 & 2032
- Table 13: Mexico Lithium-ion Battery Industry Revenue (Million) Forecast, by Application 2019 & 2032
- Table 14: Mexico Lithium-ion Battery Industry Volume (K Units) Forecast, by Application 2019 & 2032
- Table 15: Global Lithium-ion Battery Industry Revenue Million Forecast, by Country 2019 & 2032
- Table 16: Global Lithium-ion Battery Industry Volume K Units Forecast, by Country 2019 & 2032
- Table 17: Germany Lithium-ion Battery Industry Revenue (Million) Forecast, by Application 2019 & 2032
- Table 18: Germany Lithium-ion Battery Industry Volume (K Units) Forecast, by Application 2019 & 2032
- Table 19: United Kingdom Lithium-ion Battery Industry Revenue (Million) Forecast, by Application 2019 & 2032
- Table 20: United Kingdom Lithium-ion Battery Industry Volume (K Units) Forecast, by Application 2019 & 2032
- Table 21: France Lithium-ion Battery Industry Revenue (Million) Forecast, by Application 2019 & 2032
- Table 22: France Lithium-ion Battery Industry Volume (K Units) Forecast, by Application 2019 & 2032
- Table 23: Spain Lithium-ion Battery Industry Revenue (Million) Forecast, by Application 2019 & 2032
- Table 24: Spain Lithium-ion Battery Industry Volume (K Units) Forecast, by Application 2019 & 2032
- Table 25: Italy Lithium-ion Battery Industry Revenue (Million) Forecast, by Application 2019 & 2032
- Table 26: Italy Lithium-ion Battery Industry Volume (K Units) Forecast, by Application 2019 & 2032
- Table 27: Spain Lithium-ion Battery Industry Revenue (Million) Forecast, by Application 2019 & 2032
- Table 28: Spain Lithium-ion Battery Industry Volume (K Units) Forecast, by Application 2019 & 2032
- Table 29: Belgium Lithium-ion Battery Industry Revenue (Million) Forecast, by Application 2019 & 2032
- Table 30: Belgium Lithium-ion Battery Industry Volume (K Units) Forecast, by Application 2019 & 2032
- Table 31: Netherland Lithium-ion Battery Industry Revenue (Million) Forecast, by Application 2019 & 2032
- Table 32: Netherland Lithium-ion Battery Industry Volume (K Units) Forecast, by Application 2019 & 2032
- Table 33: Nordics Lithium-ion Battery Industry Revenue (Million) Forecast, by Application 2019 & 2032
- Table 34: Nordics Lithium-ion Battery Industry Volume (K Units) Forecast, by Application 2019 & 2032
- Table 35: Rest of Europe Lithium-ion Battery Industry Revenue (Million) Forecast, by Application 2019 & 2032
- Table 36: Rest of Europe Lithium-ion Battery Industry Volume (K Units) Forecast, by Application 2019 & 2032
- Table 37: Global Lithium-ion Battery Industry Revenue Million Forecast, by Country 2019 & 2032
- Table 38: Global Lithium-ion Battery Industry Volume K Units Forecast, by Country 2019 & 2032
- Table 39: China Lithium-ion Battery Industry Revenue (Million) Forecast, by Application 2019 & 2032
- Table 40: China Lithium-ion Battery Industry Volume (K Units) Forecast, by Application 2019 & 2032
- Table 41: Japan Lithium-ion Battery Industry Revenue (Million) Forecast, by Application 2019 & 2032
- Table 42: Japan Lithium-ion Battery Industry Volume (K Units) Forecast, by Application 2019 & 2032
- Table 43: India Lithium-ion Battery Industry Revenue (Million) Forecast, by Application 2019 & 2032
- Table 44: India Lithium-ion Battery Industry Volume (K Units) Forecast, by Application 2019 & 2032
- Table 45: South Korea Lithium-ion Battery Industry Revenue (Million) Forecast, by Application 2019 & 2032
- Table 46: South Korea Lithium-ion Battery Industry Volume (K Units) Forecast, by Application 2019 & 2032
- Table 47: Southeast Asia Lithium-ion Battery Industry Revenue (Million) Forecast, by Application 2019 & 2032
- Table 48: Southeast Asia Lithium-ion Battery Industry Volume (K Units) Forecast, by Application 2019 & 2032
- Table 49: Australia Lithium-ion Battery Industry Revenue (Million) Forecast, by Application 2019 & 2032
- Table 50: Australia Lithium-ion Battery Industry Volume (K Units) Forecast, by Application 2019 & 2032
- Table 51: Indonesia Lithium-ion Battery Industry Revenue (Million) Forecast, by Application 2019 & 2032
- Table 52: Indonesia Lithium-ion Battery Industry Volume (K Units) Forecast, by Application 2019 & 2032
- Table 53: Phillipes Lithium-ion Battery Industry Revenue (Million) Forecast, by Application 2019 & 2032
- Table 54: Phillipes Lithium-ion Battery Industry Volume (K Units) Forecast, by Application 2019 & 2032
- Table 55: Singapore Lithium-ion Battery Industry Revenue (Million) Forecast, by Application 2019 & 2032
- Table 56: Singapore Lithium-ion Battery Industry Volume (K Units) Forecast, by Application 2019 & 2032
- Table 57: Thailandc Lithium-ion Battery Industry Revenue (Million) Forecast, by Application 2019 & 2032
- Table 58: Thailandc Lithium-ion Battery Industry Volume (K Units) Forecast, by Application 2019 & 2032
- Table 59: Rest of Asia Pacific Lithium-ion Battery Industry Revenue (Million) Forecast, by Application 2019 & 2032
- Table 60: Rest of Asia Pacific Lithium-ion Battery Industry Volume (K Units) Forecast, by Application 2019 & 2032
- Table 61: Global Lithium-ion Battery Industry Revenue Million Forecast, by Country 2019 & 2032
- Table 62: Global Lithium-ion Battery Industry Volume K Units Forecast, by Country 2019 & 2032
- Table 63: Brazil Lithium-ion Battery Industry Revenue (Million) Forecast, by Application 2019 & 2032
- Table 64: Brazil Lithium-ion Battery Industry Volume (K Units) Forecast, by Application 2019 & 2032
- Table 65: Argentina Lithium-ion Battery Industry Revenue (Million) Forecast, by Application 2019 & 2032
- Table 66: Argentina Lithium-ion Battery Industry Volume (K Units) Forecast, by Application 2019 & 2032
- Table 67: Peru Lithium-ion Battery Industry Revenue (Million) Forecast, by Application 2019 & 2032
- Table 68: Peru Lithium-ion Battery Industry Volume (K Units) Forecast, by Application 2019 & 2032
- Table 69: Chile Lithium-ion Battery Industry Revenue (Million) Forecast, by Application 2019 & 2032
- Table 70: Chile Lithium-ion Battery Industry Volume (K Units) Forecast, by Application 2019 & 2032
- Table 71: Colombia Lithium-ion Battery Industry Revenue (Million) Forecast, by Application 2019 & 2032
- Table 72: Colombia Lithium-ion Battery Industry Volume (K Units) Forecast, by Application 2019 & 2032
- Table 73: Ecuador Lithium-ion Battery Industry Revenue (Million) Forecast, by Application 2019 & 2032
- Table 74: Ecuador Lithium-ion Battery Industry Volume (K Units) Forecast, by Application 2019 & 2032
- Table 75: Venezuela Lithium-ion Battery Industry Revenue (Million) Forecast, by Application 2019 & 2032
- Table 76: Venezuela Lithium-ion Battery Industry Volume (K Units) Forecast, by Application 2019 & 2032
- Table 77: Rest of South America Lithium-ion Battery Industry Revenue (Million) Forecast, by Application 2019 & 2032
- Table 78: Rest of South America Lithium-ion Battery Industry Volume (K Units) Forecast, by Application 2019 & 2032
- Table 79: Global Lithium-ion Battery Industry Revenue Million Forecast, by Country 2019 & 2032
- Table 80: Global Lithium-ion Battery Industry Volume K Units Forecast, by Country 2019 & 2032
- Table 81: United States Lithium-ion Battery Industry Revenue (Million) Forecast, by Application 2019 & 2032
- Table 82: United States Lithium-ion Battery Industry Volume (K Units) Forecast, by Application 2019 & 2032
- Table 83: Canada Lithium-ion Battery Industry Revenue (Million) Forecast, by Application 2019 & 2032
- Table 84: Canada Lithium-ion Battery Industry Volume (K Units) Forecast, by Application 2019 & 2032
- Table 85: Mexico Lithium-ion Battery Industry Revenue (Million) Forecast, by Application 2019 & 2032
- Table 86: Mexico Lithium-ion Battery Industry Volume (K Units) Forecast, by Application 2019 & 2032
- Table 87: Global Lithium-ion Battery Industry Revenue Million Forecast, by Country 2019 & 2032
- Table 88: Global Lithium-ion Battery Industry Volume K Units Forecast, by Country 2019 & 2032
- Table 89: United Arab Emirates Lithium-ion Battery Industry Revenue (Million) Forecast, by Application 2019 & 2032
- Table 90: United Arab Emirates Lithium-ion Battery Industry Volume (K Units) Forecast, by Application 2019 & 2032
- Table 91: Saudi Arabia Lithium-ion Battery Industry Revenue (Million) Forecast, by Application 2019 & 2032
- Table 92: Saudi Arabia Lithium-ion Battery Industry Volume (K Units) Forecast, by Application 2019 & 2032
- Table 93: South Africa Lithium-ion Battery Industry Revenue (Million) Forecast, by Application 2019 & 2032
- Table 94: South Africa Lithium-ion Battery Industry Volume (K Units) Forecast, by Application 2019 & 2032
- Table 95: Rest of Middle East and Africa Lithium-ion Battery Industry Revenue (Million) Forecast, by Application 2019 & 2032
- Table 96: Rest of Middle East and Africa Lithium-ion Battery Industry Volume (K Units) Forecast, by Application 2019 & 2032
- Table 97: Global Lithium-ion Battery Industry Revenue Million Forecast, by Application 2019 & 2032
- Table 98: Global Lithium-ion Battery Industry Volume K Units Forecast, by Application 2019 & 2032
- Table 99: Global Lithium-ion Battery Industry Revenue Million Forecast, by Country 2019 & 2032
- Table 100: Global Lithium-ion Battery Industry Volume K Units Forecast, by Country 2019 & 2032
- Table 101: United States Lithium-ion Battery Industry Revenue (Million) Forecast, by Application 2019 & 2032
- Table 102: United States Lithium-ion Battery Industry Volume (K Units) Forecast, by Application 2019 & 2032
- Table 103: Canada Lithium-ion Battery Industry Revenue (Million) Forecast, by Application 2019 & 2032
- Table 104: Canada Lithium-ion Battery Industry Volume (K Units) Forecast, by Application 2019 & 2032
- Table 105: Rest of the North America Lithium-ion Battery Industry Revenue (Million) Forecast, by Application 2019 & 2032
- Table 106: Rest of the North America Lithium-ion Battery Industry Volume (K Units) Forecast, by Application 2019 & 2032
- Table 107: Global Lithium-ion Battery Industry Revenue Million Forecast, by Application 2019 & 2032
- Table 108: Global Lithium-ion Battery Industry Volume K Units Forecast, by Application 2019 & 2032
- Table 109: Global Lithium-ion Battery Industry Revenue Million Forecast, by Country 2019 & 2032
- Table 110: Global Lithium-ion Battery Industry Volume K Units Forecast, by Country 2019 & 2032
- Table 111: Spain Lithium-ion Battery Industry Revenue (Million) Forecast, by Application 2019 & 2032
- Table 112: Spain Lithium-ion Battery Industry Volume (K Units) Forecast, by Application 2019 & 2032
- Table 113: Nordic Lithium-ion Battery Industry Revenue (Million) Forecast, by Application 2019 & 2032
- Table 114: Nordic Lithium-ion Battery Industry Volume (K Units) Forecast, by Application 2019 & 2032
- Table 115: United Kingdom Lithium-ion Battery Industry Revenue (Million) Forecast, by Application 2019 & 2032
- Table 116: United Kingdom Lithium-ion Battery Industry Volume (K Units) Forecast, by Application 2019 & 2032
- Table 117: Russia Lithium-ion Battery Industry Revenue (Million) Forecast, by Application 2019 & 2032
- Table 118: Russia Lithium-ion Battery Industry Volume (K Units) Forecast, by Application 2019 & 2032
- Table 119: Turkey Lithium-ion Battery Industry Revenue (Million) Forecast, by Application 2019 & 2032
- Table 120: Turkey Lithium-ion Battery Industry Volume (K Units) Forecast, by Application 2019 & 2032
- Table 121: Germany Lithium-ion Battery Industry Revenue (Million) Forecast, by Application 2019 & 2032
- Table 122: Germany Lithium-ion Battery Industry Volume (K Units) Forecast, by Application 2019 & 2032
- Table 123: Italy Lithium-ion Battery Industry Revenue (Million) Forecast, by Application 2019 & 2032
- Table 124: Italy Lithium-ion Battery Industry Volume (K Units) Forecast, by Application 2019 & 2032
- Table 125: Rest of the Europe Lithium-ion Battery Industry Revenue (Million) Forecast, by Application 2019 & 2032
- Table 126: Rest of the Europe Lithium-ion Battery Industry Volume (K Units) Forecast, by Application 2019 & 2032
- Table 127: Global Lithium-ion Battery Industry Revenue Million Forecast, by Application 2019 & 2032
- Table 128: Global Lithium-ion Battery Industry Volume K Units Forecast, by Application 2019 & 2032
- Table 129: Global Lithium-ion Battery Industry Revenue Million Forecast, by Country 2019 & 2032
- Table 130: Global Lithium-ion Battery Industry Volume K Units Forecast, by Country 2019 & 2032
- Table 131: China Lithium-ion Battery Industry Revenue (Million) Forecast, by Application 2019 & 2032
- Table 132: China Lithium-ion Battery Industry Volume (K Units) Forecast, by Application 2019 & 2032
- Table 133: India Lithium-ion Battery Industry Revenue (Million) Forecast, by Application 2019 & 2032
- Table 134: India Lithium-ion Battery Industry Volume (K Units) Forecast, by Application 2019 & 2032
- Table 135: Japan Lithium-ion Battery Industry Revenue (Million) Forecast, by Application 2019 & 2032
- Table 136: Japan Lithium-ion Battery Industry Volume (K Units) Forecast, by Application 2019 & 2032
- Table 137: Malaysia Lithium-ion Battery Industry Revenue (Million) Forecast, by Application 2019 & 2032
- Table 138: Malaysia Lithium-ion Battery Industry Volume (K Units) Forecast, by Application 2019 & 2032
- Table 139: Thailand Lithium-ion Battery Industry Revenue (Million) Forecast, by Application 2019 & 2032
- Table 140: Thailand Lithium-ion Battery Industry Volume (K Units) Forecast, by Application 2019 & 2032
- Table 141: Indonesia Lithium-ion Battery Industry Revenue (Million) Forecast, by Application 2019 & 2032
- Table 142: Indonesia Lithium-ion Battery Industry Volume (K Units) Forecast, by Application 2019 & 2032
- Table 143: Vietnam Lithium-ion Battery Industry Revenue (Million) Forecast, by Application 2019 & 2032
- Table 144: Vietnam Lithium-ion Battery Industry Volume (K Units) Forecast, by Application 2019 & 2032
- Table 145: Rest of Asia Pacific Lithium-ion Battery Industry Revenue (Million) Forecast, by Application 2019 & 2032
- Table 146: Rest of Asia Pacific Lithium-ion Battery Industry Volume (K Units) Forecast, by Application 2019 & 2032
- Table 147: Global Lithium-ion Battery Industry Revenue Million Forecast, by Application 2019 & 2032
- Table 148: Global Lithium-ion Battery Industry Volume K Units Forecast, by Application 2019 & 2032
- Table 149: Global Lithium-ion Battery Industry Revenue Million Forecast, by Country 2019 & 2032
- Table 150: Global Lithium-ion Battery Industry Volume K Units Forecast, by Country 2019 & 2032
- Table 151: Brazil Lithium-ion Battery Industry Revenue (Million) Forecast, by Application 2019 & 2032
- Table 152: Brazil Lithium-ion Battery Industry Volume (K Units) Forecast, by Application 2019 & 2032
- Table 153: Argentina Lithium-ion Battery Industry Revenue (Million) Forecast, by Application 2019 & 2032
- Table 154: Argentina Lithium-ion Battery Industry Volume (K Units) Forecast, by Application 2019 & 2032
- Table 155: Colmbia Lithium-ion Battery Industry Revenue (Million) Forecast, by Application 2019 & 2032
- Table 156: Colmbia Lithium-ion Battery Industry Volume (K Units) Forecast, by Application 2019 & 2032
- Table 157: Rest of South America Lithium-ion Battery Industry Revenue (Million) Forecast, by Application 2019 & 2032
- Table 158: Rest of South America Lithium-ion Battery Industry Volume (K Units) Forecast, by Application 2019 & 2032
- Table 159: Global Lithium-ion Battery Industry Revenue Million Forecast, by Application 2019 & 2032
- Table 160: Global Lithium-ion Battery Industry Volume K Units Forecast, by Application 2019 & 2032
- Table 161: Global Lithium-ion Battery Industry Revenue Million Forecast, by Country 2019 & 2032
- Table 162: Global Lithium-ion Battery Industry Volume K Units Forecast, by Country 2019 & 2032
- Table 163: United Arab Emirates Lithium-ion Battery Industry Revenue (Million) Forecast, by Application 2019 & 2032
- Table 164: United Arab Emirates Lithium-ion Battery Industry Volume (K Units) Forecast, by Application 2019 & 2032
- Table 165: Saudi Arabia Lithium-ion Battery Industry Revenue (Million) Forecast, by Application 2019 & 2032
- Table 166: Saudi Arabia Lithium-ion Battery Industry Volume (K Units) Forecast, by Application 2019 & 2032
- Table 167: South Africa Lithium-ion Battery Industry Revenue (Million) Forecast, by Application 2019 & 2032
- Table 168: South Africa Lithium-ion Battery Industry Volume (K Units) Forecast, by Application 2019 & 2032
- Table 169: Nigeria Lithium-ion Battery Industry Revenue (Million) Forecast, by Application 2019 & 2032
- Table 170: Nigeria Lithium-ion Battery Industry Volume (K Units) Forecast, by Application 2019 & 2032
- Table 171: Qatar Lithium-ion Battery Industry Revenue (Million) Forecast, by Application 2019 & 2032
- Table 172: Qatar Lithium-ion Battery Industry Volume (K Units) Forecast, by Application 2019 & 2032
- Table 173: Egypt Lithium-ion Battery Industry Revenue (Million) Forecast, by Application 2019 & 2032
- Table 174: Egypt Lithium-ion Battery Industry Volume (K Units) Forecast, by Application 2019 & 2032
- Table 175: Rest of the Middle East and Africa Lithium-ion Battery Industry Revenue (Million) Forecast, by Application 2019 & 2032
- Table 176: Rest of the Middle East and Africa Lithium-ion Battery Industry Volume (K Units) Forecast, by Application 2019 & 2032
Frequently Asked Questions
1. What is the projected Compound Annual Growth Rate (CAGR) of the Lithium-ion Battery Industry?
The projected CAGR is approximately 14.46%.
2. Which companies are prominent players in the Lithium-ion Battery Industry?
Key companies in the market include Contemporary Amperex Technology Co Limited, LG Chem Ltd, BYD Company Limited, Tianjin Lishen Battery Joint-Stock Co Ltd*List Not Exhaustive 6 4 Market Ranking/Share Analysi, Tesla Inc, Samsung SDI, Panasonic Corporation, Sony Corporation.
3. What are the main segments of the Lithium-ion Battery Industry?
The market segments include Application.
4. Can you provide details about the market size?
The market size is estimated to be USD 64.75 Million as of 2022.
5. What are some drivers contributing to market growth?
4.; Supportive Government Initiatives And Policies To Adopt Renewable Energy4.; Declining Cost Of Lithium-ion Batteries.
6. What are the notable trends driving market growth?
The Automobile Segment Expected to Dominate the Market.
7. Are there any restraints impacting market growth?
4.; Demand-Supply Mismatch of Raw Materials.
8. Can you provide examples of recent developments in the market?
January 2024: Automotive battery maker Amara Raja Batteries Ltd announced its plans to operate a gigafactory before the end of 2025. The company laid the foundation for one of its first gigafactories in the Mahbubnagar district in Telangana, India. The plant is expected to produce lithium cells and battery packs with a capacity of up to 16 GWh and 5 GWh, respectively.
9. What pricing options are available for accessing the report?
Pricing options include single-user, multi-user, and enterprise licenses priced at USD 4750, USD 5250, and USD 8750 respectively.
10. Is the market size provided in terms of value or volume?
The market size is provided in terms of value, measured in Million and volume, measured in K Units.
11. Are there any specific market keywords associated with the report?
Yes, the market keyword associated with the report is "Lithium-ion Battery Industry," which aids in identifying and referencing the specific market segment covered.
12. How do I determine which pricing option suits my needs best?
The pricing options vary based on user requirements and access needs. Individual users may opt for single-user licenses, while businesses requiring broader access may choose multi-user or enterprise licenses for cost-effective access to the report.
13. Are there any additional resources or data provided in the Lithium-ion Battery Industry report?
While the report offers comprehensive insights, it's advisable to review the specific contents or supplementary materials provided to ascertain if additional resources or data are available.
14. How can I stay updated on further developments or reports in the Lithium-ion Battery Industry?
To stay informed about further developments, trends, and reports in the Lithium-ion Battery Industry, consider subscribing to industry newsletters, following relevant companies and organizations, or regularly checking reputable industry news sources and publications.
Methodology
Step 1 - Identification of Relevant Samples Size from Population Database


Step 2 - Approaches for Defining Global Market Size (Value, Volume* & Price*)

Note*: In applicable scenarios
Step 3 - Data Sources
Primary Research
- Web Analytics
- Survey Reports
- Research Institute
- Latest Research Reports
- Opinion Leaders
Secondary Research
- Annual Reports
- White Paper
- Latest Press Release
- Industry Association
- Paid Database
- Investor Presentations

Step 4 - Data Triangulation
Involves using different sources of information in order to increase the validity of a study
These sources are likely to be stakeholders in a program - participants, other researchers, program staff, other community members, and so on.
Then we put all data in single framework & apply various statistical tools to find out the dynamic on the market.
During the analysis stage, feedback from the stakeholder groups would be compared to determine areas of agreement as well as areas of divergence
