

Key Insights
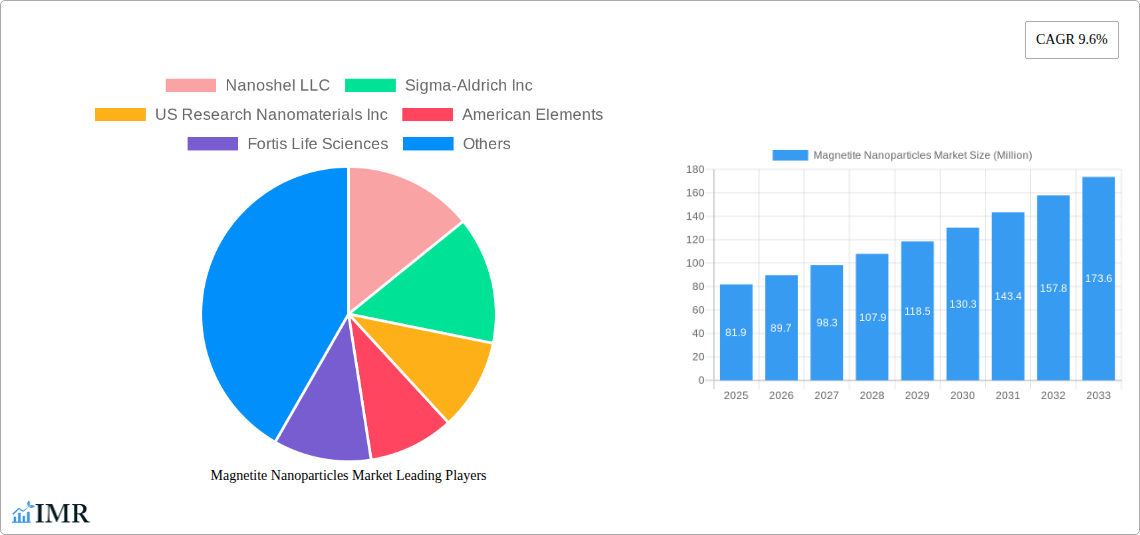
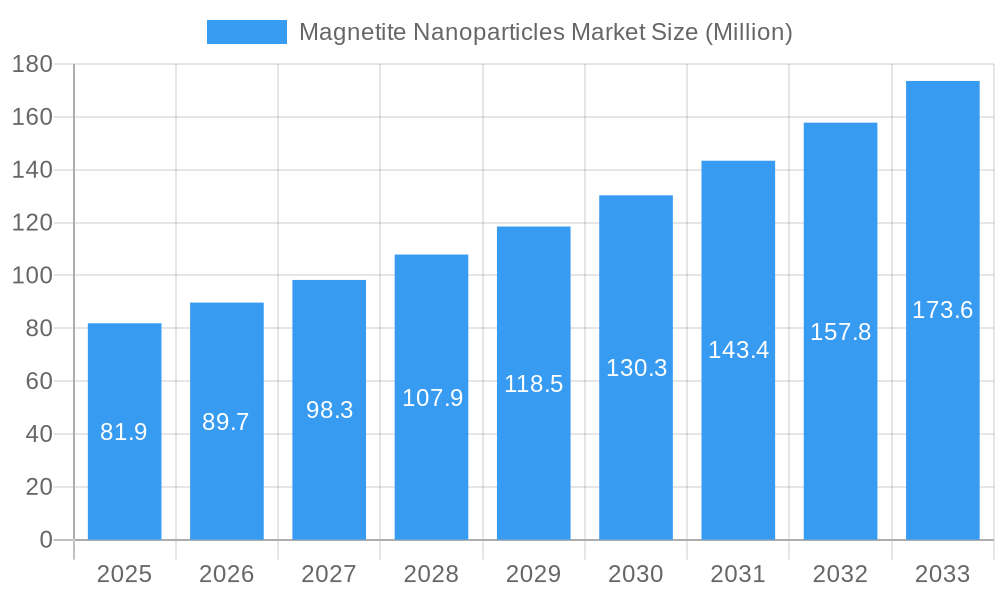
The global magnetite nanoparticles market, valued at $81.9 million in 2025, is projected to experience robust growth, exhibiting a compound annual growth rate (CAGR) of 9.6% from 2025 to 2033. This expansion is fueled by several key drivers. The increasing demand for magnetite nanoparticles in biomedical applications, particularly in drug delivery and magnetic resonance imaging (MRI) contrast agents, is a significant contributor. Furthermore, the rising adoption of these nanoparticles in electronics, driven by advancements in data storage and sensor technologies, is bolstering market growth. The wastewater treatment sector also presents a substantial opportunity, with magnetite nanoparticles playing a crucial role in efficient water purification processes. Growth in the energy sector, specifically in applications like enhanced oil recovery and battery technology, is also positively impacting the market. While challenges such as potential toxicity concerns and the need for cost-effective large-scale production exist, the overall market outlook remains optimistic due to continuous research and development leading to improved synthesis methods and wider applications.
Magnetite Nanoparticles Market Market Size (In Million)
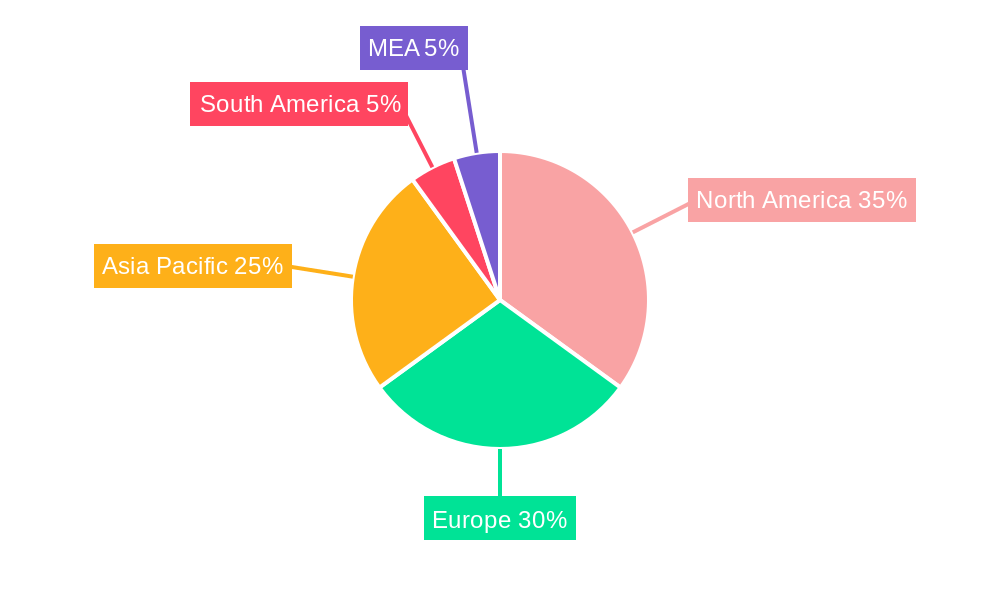
The market segmentation reveals a diversified landscape. Biomedical applications currently dominate, holding a substantial market share, closely followed by the electronics and wastewater treatment segments. Geographically, North America and Europe are currently leading market regions due to established research infrastructure and technological advancements. However, Asia-Pacific is poised for significant growth in the coming years, driven by increasing industrialization and rising investments in nanotechnology research across countries like China, India, and Japan. The competitive landscape is characterized by a mix of established chemical companies and specialized nanomaterials manufacturers. Ongoing innovation and strategic partnerships among players are expected to further drive market expansion and offer diverse product offerings to cater to the growing demands across various applications.
Magnetite Nanoparticles Market Company Market Share
Magnetite Nanoparticles Market: A Comprehensive Market Report (2019-2033)
This comprehensive report provides an in-depth analysis of the Magnetite Nanoparticles market, encompassing market dynamics, growth trends, regional analysis, competitive landscape, and future outlook. The study period covers 2019-2033, with 2025 serving as the base and estimated year. The report is invaluable for industry professionals, investors, and researchers seeking a clear understanding of this rapidly evolving market. The parent market is the broader nanomaterials market, while the child market focuses specifically on magnetite nanoparticles and their diverse applications. The total market size is projected to reach xx Million by 2033.
Magnetite Nanoparticles Market Market Dynamics & Structure
The Magnetite Nanoparticles market is characterized by moderate concentration, with several key players dominating specific segments. Technological innovation, particularly in synthesis methods and surface functionalization, is a primary growth driver. Stringent regulatory frameworks, especially concerning biomedical applications, influence market dynamics. Competitive substitutes, such as other magnetic nanoparticles (e.g., iron oxide nanoparticles), present challenges. The end-user demographics span diverse sectors, creating significant opportunities. Mergers and acquisitions (M&A) activity is increasing, reflecting industry consolidation.
- Market Concentration: Moderately concentrated, with top 5 players holding approximately xx% market share in 2024.
- Technological Innovation: Focus on improved synthesis techniques, enhanced biocompatibility, and targeted drug delivery.
- Regulatory Framework: Stringent regulations for biomedical applications drive higher manufacturing costs and standards.
- Competitive Substitutes: Other magnetic nanoparticles, posing competitive pressures.
- End-User Demographics: Biomedical, electronics, wastewater treatment, and energy sectors are key end-users.
- M&A Trends: Significant increase in M&A activity in recent years, driven by market consolidation and expansion strategies (e.g., xx M&A deals in 2022-2024).
Magnetite Nanoparticles Market Growth Trends & Insights
The Magnetite Nanoparticles market has witnessed substantial growth over the historical period (2019-2024), driven by increasing demand from various sectors. The market size is estimated at xx Million in 2025, exhibiting a CAGR of xx% during the forecast period (2025-2033). This growth is fueled by technological advancements, rising adoption rates across applications (particularly biomedical and electronics), and continuous research and development efforts. Market penetration is highest in the biomedical sector, with significant potential for expansion in other sectors like energy and wastewater treatment. Technological disruptions, including the development of novel synthesis methods and functionalization techniques, are further accelerating market growth. Consumer behavior is shifting toward more environmentally friendly and sustainable solutions, which favors the use of magnetite nanoparticles in various applications.
Dominant Regions, Countries, or Segments in Magnetite Nanoparticles Market
The Biomedical segment currently dominates the Magnetite Nanoparticles market, driven by its extensive applications in diagnostics and therapeutics. North America and Europe represent the leading regions, benefiting from robust research infrastructure and regulatory support. However, Asia-Pacific is emerging as a rapidly growing market due to increasing healthcare spending and technological advancements.
Key Drivers (Biomedical Segment):
- Growing demand for advanced diagnostics and targeted drug delivery systems.
- Rising prevalence of chronic diseases.
- Increasing investments in medical research and development.
Key Drivers (North America & Europe):
- Strong research and development infrastructure.
- Favorable regulatory environment.
- High healthcare expenditure.
Key Drivers (Asia-Pacific):
- Increasing healthcare expenditure.
- Growing adoption of advanced medical technologies.
- Favorable government initiatives.
Magnetite Nanoparticles Market Product Landscape
Magnetite nanoparticles are available in various forms, including monodisperse, functionalized, and coated particles. Key advancements include improved control over particle size and shape, enhanced biocompatibility, and increased stability. These advancements are driven by the need for tailored performance metrics in specific applications, such as improved magnetic resonance imaging (MRI) contrast enhancement or efficient drug delivery. Unique selling propositions include targeted drug delivery, high biocompatibility, and superior magnetic properties.
Key Drivers, Barriers & Challenges in Magnetite Nanoparticles Market
Key Drivers: The rising demand for efficient and targeted drug delivery systems in the biomedical field, the growing need for advanced materials in electronics and energy storage, and the increasing focus on sustainable wastewater treatment solutions are major drivers. Government initiatives promoting nanotechnology research and development further accelerate market growth.
Key Challenges: High production costs, potential toxicity concerns, and regulatory hurdles for biomedical applications pose significant challenges. Supply chain disruptions and competition from other magnetic nanoparticles can also impact market growth. Stringent regulatory compliance requirements can add to production costs and slow down market penetration (estimated impact: xx% reduction in market growth in 2024).
Emerging Opportunities in Magnetite Nanoparticles Market
Emerging opportunities lie in the exploration of new applications, particularly in environmental remediation, catalysis, and advanced sensors. Untapped markets in developing economies also present significant growth potential. The increasing demand for sustainable and eco-friendly solutions is driving innovation in the field of green nanotechnology, creating new opportunities for magnetite nanoparticles in various applications.
Growth Accelerators in the Magnetite Nanoparticles Market Industry
Technological breakthroughs in synthesis techniques and surface functionalization are driving long-term growth. Strategic partnerships between research institutions and industry players are also accelerating market expansion. Growing investments in nanotechnology research and development, particularly in emerging economies, contribute to the market's sustained growth. Expanding applications across various industries (e.g., advanced electronics and energy storage) present promising growth avenues.
Key Players Shaping the Magnetite Nanoparticles Market Market
- Nanoshel LLC
- Sigma-Aldrich Inc
- US Research Nanomaterials Inc
- American Elements
- Fortis Life Sciences
- Reade International Corp
- NNCrystal US Corporation
- Strem Chemicals Inc
- Nanografi Nano Technology
- Cytodiagnostics Inc
- SkySpring Nanomaterials Inc
Notable Milestones in Magnetite Nanoparticles Market Sector
- July 2022: Fortis Life Sciences acquired nanoComposix, strengthening its position in magnetic particle development and manufacturing.
- November 2022: Ascensus Specialties LLC acquired Strem Chemicals UK, expanding its distribution network for high-purity catalysts and precursors.
In-Depth Magnetite Nanoparticles Market Market Outlook
The Magnetite Nanoparticles market is poised for continued growth, driven by ongoing technological advancements, expanding applications, and increasing investments in research and development. Strategic partnerships and market expansion strategies are expected to play a key role in shaping future market dynamics. The focus on developing sustainable and biocompatible magnetite nanoparticles will further drive market growth in the coming years. The market's potential is substantial, with significant opportunities for innovation and expansion across various sectors.
Magnetite Nanoparticles Market Segmentation
-
1. Application
- 1.1. Biomedical
- 1.2. Electronics
- 1.3. Waste Water Treatment
- 1.4. Energy
- 1.5. Other Applications
Magnetite Nanoparticles Market Segmentation By Geography
-
1. Asia Pacific
- 1.1. China
- 1.2. India
- 1.3. Japan
- 1.4. South Korea
- 1.5. Rest of Asia Pacific
-
2. North America
- 2.1. United States
- 2.2. Canada
- 2.3. Mexico
-
3. Europe
- 3.1. Germany
- 3.2. United Kingdom
- 3.3. Italy
- 3.4. France
- 3.5. Rest of Europe
-
4. South America
- 4.1. Brazil
- 4.2. Argentina
- 4.3. Rest of South America
-
5. Middle East and Africa
- 5.1. Saudi Arabia
- 5.2. South Africa
- 5.3. Rest of Middle East and Africa
Magnetite Nanoparticles Market Regional Market Share
Geographic Coverage of Magnetite Nanoparticles Market
Magnetite Nanoparticles Market REPORT HIGHLIGHTS
| Aspects | Details |
|---|---|
| Study Period | 2020-2034 |
| Base Year | 2025 |
| Estimated Year | 2026 |
| Forecast Period | 2026-2034 |
| Historical Period | 2020-2025 |
| Growth Rate | CAGR of 9.6% from 2020-2034 |
| Segmentation |
|
Table of Contents
- 1. Introduction
- 1.1. Research Scope
- 1.2. Market Segmentation
- 1.3. Research Objective
- 1.4. Definitions and Assumptions
- 2. Executive Summary
- 2.1. Market Snapshot
- 3. Market Dynamics
- 3.1. Market Drivers
- 3.2. Market Restrains
- 3.3. Market Trends
- 3.4. Market Opportunities
- 4. Market Factor Analysis
- 4.1. Porters Five Forces
- 4.1.1. Bargaining Power of Suppliers
- 4.1.2. Bargaining Power of Buyers
- 4.1.3. Threat of New Entrants
- 4.1.4. Threat of Substitutes
- 4.1.5. Competitive Rivalry
- 4.2. PESTEL analysis
- 4.3. BCG Analysis
- 4.3.1. Stars (High Growth, High Market Share)
- 4.3.2. Cash Cows (Low Growth, High Market Share)
- 4.3.3. Question Mark (High Growth, Low Market Share)
- 4.3.4. Dogs (Low Growth, Low Market Share)
- 4.4. Ansoff Matrix Analysis
- 4.5. Supply Chain Analysis
- 4.6. Regulatory Landscape
- 4.7. Current Market Potential and Opportunity Assessment (TAM–SAM–SOM Framework)
- 4.8. IMR Analyst Note
- 4.1. Porters Five Forces
- 5. Market Analysis, Insights and Forecast 2021-2033
- 5.1. Market Analysis, Insights and Forecast - by Application
- 5.1.1. Biomedical
- 5.1.2. Electronics
- 5.1.3. Waste Water Treatment
- 5.1.4. Energy
- 5.1.5. Other Applications
- 5.2. Market Analysis, Insights and Forecast - by Region
- 5.2.1. Asia Pacific
- 5.2.2. North America
- 5.2.3. Europe
- 5.2.4. South America
- 5.2.5. Middle East and Africa
- 5.1. Market Analysis, Insights and Forecast - by Application
- 6. Global Magnetite Nanoparticles Market Analysis, Insights and Forecast, 2021-2033
- 6.1. Market Analysis, Insights and Forecast - by Application
- 6.1.1. Biomedical
- 6.1.2. Electronics
- 6.1.3. Waste Water Treatment
- 6.1.4. Energy
- 6.1.5. Other Applications
- 6.1. Market Analysis, Insights and Forecast - by Application
- 7. Asia Pacific Magnetite Nanoparticles Market Analysis, Insights and Forecast, 2020-2032
- 7.1. Market Analysis, Insights and Forecast - by Application
- 7.1.1. Biomedical
- 7.1.2. Electronics
- 7.1.3. Waste Water Treatment
- 7.1.4. Energy
- 7.1.5. Other Applications
- 7.1. Market Analysis, Insights and Forecast - by Application
- 8. North America Magnetite Nanoparticles Market Analysis, Insights and Forecast, 2020-2032
- 8.1. Market Analysis, Insights and Forecast - by Application
- 8.1.1. Biomedical
- 8.1.2. Electronics
- 8.1.3. Waste Water Treatment
- 8.1.4. Energy
- 8.1.5. Other Applications
- 8.1. Market Analysis, Insights and Forecast - by Application
- 9. Europe Magnetite Nanoparticles Market Analysis, Insights and Forecast, 2020-2032
- 9.1. Market Analysis, Insights and Forecast - by Application
- 9.1.1. Biomedical
- 9.1.2. Electronics
- 9.1.3. Waste Water Treatment
- 9.1.4. Energy
- 9.1.5. Other Applications
- 9.1. Market Analysis, Insights and Forecast - by Application
- 10. South America Magnetite Nanoparticles Market Analysis, Insights and Forecast, 2020-2032
- 10.1. Market Analysis, Insights and Forecast - by Application
- 10.1.1. Biomedical
- 10.1.2. Electronics
- 10.1.3. Waste Water Treatment
- 10.1.4. Energy
- 10.1.5. Other Applications
- 10.1. Market Analysis, Insights and Forecast - by Application
- 11. Middle East and Africa Magnetite Nanoparticles Market Analysis, Insights and Forecast, 2020-2032
- 11.1. Market Analysis, Insights and Forecast - by Application
- 11.1.1. Biomedical
- 11.1.2. Electronics
- 11.1.3. Waste Water Treatment
- 11.1.4. Energy
- 11.1.5. Other Applications
- 11.1. Market Analysis, Insights and Forecast - by Application
- 12. Competitive Analysis
- 12.1. Company Profiles
- 12.1.1 Nanoshel LLC
- 12.1.1.1. Company Overview
- 12.1.1.2. Products
- 12.1.1.3. Company Financials
- 12.1.1.4. SWOT Analysis
- 12.1.2 Sigma-Aldrich Inc
- 12.1.2.1. Company Overview
- 12.1.2.2. Products
- 12.1.2.3. Company Financials
- 12.1.2.4. SWOT Analysis
- 12.1.3 US Research Nanomaterials Inc
- 12.1.3.1. Company Overview
- 12.1.3.2. Products
- 12.1.3.3. Company Financials
- 12.1.3.4. SWOT Analysis
- 12.1.4 American Elements
- 12.1.4.1. Company Overview
- 12.1.4.2. Products
- 12.1.4.3. Company Financials
- 12.1.4.4. SWOT Analysis
- 12.1.5 Fortis Life Sciences
- 12.1.5.1. Company Overview
- 12.1.5.2. Products
- 12.1.5.3. Company Financials
- 12.1.5.4. SWOT Analysis
- 12.1.6 Reade International Corp
- 12.1.6.1. Company Overview
- 12.1.6.2. Products
- 12.1.6.3. Company Financials
- 12.1.6.4. SWOT Analysis
- 12.1.7 NNCrystal US Corporation
- 12.1.7.1. Company Overview
- 12.1.7.2. Products
- 12.1.7.3. Company Financials
- 12.1.7.4. SWOT Analysis
- 12.1.8 Strem Chemicals Inc
- 12.1.8.1. Company Overview
- 12.1.8.2. Products
- 12.1.8.3. Company Financials
- 12.1.8.4. SWOT Analysis
- 12.1.9 Nanografi Nano Technology
- 12.1.9.1. Company Overview
- 12.1.9.2. Products
- 12.1.9.3. Company Financials
- 12.1.9.4. SWOT Analysis
- 12.1.10 Cytodiagnostics Inc
- 12.1.10.1. Company Overview
- 12.1.10.2. Products
- 12.1.10.3. Company Financials
- 12.1.10.4. SWOT Analysis
- 12.1.11 SkySpring Nanomaterials Inc
- 12.1.11.1. Company Overview
- 12.1.11.2. Products
- 12.1.11.3. Company Financials
- 12.1.11.4. SWOT Analysis
- 12.1.1 Nanoshel LLC
- 12.2. Market Entropy
- 12.2.1 Company's Key Areas Served
- 12.2.2 Recent Developments
- 12.3. Company Market Share Analysis 2025
- 12.3.1 Top 5 Companies Market Share Analysis
- 12.3.2 Top 3 Companies Market Share Analysis
- 12.4. List of Potential Customers
- 13. Research Methodology
List of Figures
- Figure 1: Global Magnetite Nanoparticles Market Revenue Breakdown (Million, %) by Region 2025 & 2033
- Figure 2: Global Magnetite Nanoparticles Market Volume Breakdown (K Tons, %) by Region 2025 & 2033
- Figure 3: Asia Pacific Magnetite Nanoparticles Market Revenue (Million), by Application 2025 & 2033
- Figure 4: Asia Pacific Magnetite Nanoparticles Market Volume (K Tons), by Application 2025 & 2033
- Figure 5: Asia Pacific Magnetite Nanoparticles Market Revenue Share (%), by Application 2025 & 2033
- Figure 6: Asia Pacific Magnetite Nanoparticles Market Volume Share (%), by Application 2025 & 2033
- Figure 7: Asia Pacific Magnetite Nanoparticles Market Revenue (Million), by Country 2025 & 2033
- Figure 8: Asia Pacific Magnetite Nanoparticles Market Volume (K Tons), by Country 2025 & 2033
- Figure 9: Asia Pacific Magnetite Nanoparticles Market Revenue Share (%), by Country 2025 & 2033
- Figure 10: Asia Pacific Magnetite Nanoparticles Market Volume Share (%), by Country 2025 & 2033
- Figure 11: North America Magnetite Nanoparticles Market Revenue (Million), by Application 2025 & 2033
- Figure 12: North America Magnetite Nanoparticles Market Volume (K Tons), by Application 2025 & 2033
- Figure 13: North America Magnetite Nanoparticles Market Revenue Share (%), by Application 2025 & 2033
- Figure 14: North America Magnetite Nanoparticles Market Volume Share (%), by Application 2025 & 2033
- Figure 15: North America Magnetite Nanoparticles Market Revenue (Million), by Country 2025 & 2033
- Figure 16: North America Magnetite Nanoparticles Market Volume (K Tons), by Country 2025 & 2033
- Figure 17: North America Magnetite Nanoparticles Market Revenue Share (%), by Country 2025 & 2033
- Figure 18: North America Magnetite Nanoparticles Market Volume Share (%), by Country 2025 & 2033
- Figure 19: Europe Magnetite Nanoparticles Market Revenue (Million), by Application 2025 & 2033
- Figure 20: Europe Magnetite Nanoparticles Market Volume (K Tons), by Application 2025 & 2033
- Figure 21: Europe Magnetite Nanoparticles Market Revenue Share (%), by Application 2025 & 2033
- Figure 22: Europe Magnetite Nanoparticles Market Volume Share (%), by Application 2025 & 2033
- Figure 23: Europe Magnetite Nanoparticles Market Revenue (Million), by Country 2025 & 2033
- Figure 24: Europe Magnetite Nanoparticles Market Volume (K Tons), by Country 2025 & 2033
- Figure 25: Europe Magnetite Nanoparticles Market Revenue Share (%), by Country 2025 & 2033
- Figure 26: Europe Magnetite Nanoparticles Market Volume Share (%), by Country 2025 & 2033
- Figure 27: South America Magnetite Nanoparticles Market Revenue (Million), by Application 2025 & 2033
- Figure 28: South America Magnetite Nanoparticles Market Volume (K Tons), by Application 2025 & 2033
- Figure 29: South America Magnetite Nanoparticles Market Revenue Share (%), by Application 2025 & 2033
- Figure 30: South America Magnetite Nanoparticles Market Volume Share (%), by Application 2025 & 2033
- Figure 31: South America Magnetite Nanoparticles Market Revenue (Million), by Country 2025 & 2033
- Figure 32: South America Magnetite Nanoparticles Market Volume (K Tons), by Country 2025 & 2033
- Figure 33: South America Magnetite Nanoparticles Market Revenue Share (%), by Country 2025 & 2033
- Figure 34: South America Magnetite Nanoparticles Market Volume Share (%), by Country 2025 & 2033
- Figure 35: Middle East and Africa Magnetite Nanoparticles Market Revenue (Million), by Application 2025 & 2033
- Figure 36: Middle East and Africa Magnetite Nanoparticles Market Volume (K Tons), by Application 2025 & 2033
- Figure 37: Middle East and Africa Magnetite Nanoparticles Market Revenue Share (%), by Application 2025 & 2033
- Figure 38: Middle East and Africa Magnetite Nanoparticles Market Volume Share (%), by Application 2025 & 2033
- Figure 39: Middle East and Africa Magnetite Nanoparticles Market Revenue (Million), by Country 2025 & 2033
- Figure 40: Middle East and Africa Magnetite Nanoparticles Market Volume (K Tons), by Country 2025 & 2033
- Figure 41: Middle East and Africa Magnetite Nanoparticles Market Revenue Share (%), by Country 2025 & 2033
- Figure 42: Middle East and Africa Magnetite Nanoparticles Market Volume Share (%), by Country 2025 & 2033
List of Tables
- Table 1: Global Magnetite Nanoparticles Market Revenue Million Forecast, by Application 2020 & 2033
- Table 2: Global Magnetite Nanoparticles Market Volume K Tons Forecast, by Application 2020 & 2033
- Table 3: Global Magnetite Nanoparticles Market Revenue Million Forecast, by Region 2020 & 2033
- Table 4: Global Magnetite Nanoparticles Market Volume K Tons Forecast, by Region 2020 & 2033
- Table 5: Global Magnetite Nanoparticles Market Revenue Million Forecast, by Application 2020 & 2033
- Table 6: Global Magnetite Nanoparticles Market Volume K Tons Forecast, by Application 2020 & 2033
- Table 7: Global Magnetite Nanoparticles Market Revenue Million Forecast, by Country 2020 & 2033
- Table 8: Global Magnetite Nanoparticles Market Volume K Tons Forecast, by Country 2020 & 2033
- Table 9: China Magnetite Nanoparticles Market Revenue (Million) Forecast, by Application 2020 & 2033
- Table 10: China Magnetite Nanoparticles Market Volume (K Tons) Forecast, by Application 2020 & 2033
- Table 11: India Magnetite Nanoparticles Market Revenue (Million) Forecast, by Application 2020 & 2033
- Table 12: India Magnetite Nanoparticles Market Volume (K Tons) Forecast, by Application 2020 & 2033
- Table 13: Japan Magnetite Nanoparticles Market Revenue (Million) Forecast, by Application 2020 & 2033
- Table 14: Japan Magnetite Nanoparticles Market Volume (K Tons) Forecast, by Application 2020 & 2033
- Table 15: South Korea Magnetite Nanoparticles Market Revenue (Million) Forecast, by Application 2020 & 2033
- Table 16: South Korea Magnetite Nanoparticles Market Volume (K Tons) Forecast, by Application 2020 & 2033
- Table 17: Rest of Asia Pacific Magnetite Nanoparticles Market Revenue (Million) Forecast, by Application 2020 & 2033
- Table 18: Rest of Asia Pacific Magnetite Nanoparticles Market Volume (K Tons) Forecast, by Application 2020 & 2033
- Table 19: Global Magnetite Nanoparticles Market Revenue Million Forecast, by Application 2020 & 2033
- Table 20: Global Magnetite Nanoparticles Market Volume K Tons Forecast, by Application 2020 & 2033
- Table 21: Global Magnetite Nanoparticles Market Revenue Million Forecast, by Country 2020 & 2033
- Table 22: Global Magnetite Nanoparticles Market Volume K Tons Forecast, by Country 2020 & 2033
- Table 23: United States Magnetite Nanoparticles Market Revenue (Million) Forecast, by Application 2020 & 2033
- Table 24: United States Magnetite Nanoparticles Market Volume (K Tons) Forecast, by Application 2020 & 2033
- Table 25: Canada Magnetite Nanoparticles Market Revenue (Million) Forecast, by Application 2020 & 2033
- Table 26: Canada Magnetite Nanoparticles Market Volume (K Tons) Forecast, by Application 2020 & 2033
- Table 27: Mexico Magnetite Nanoparticles Market Revenue (Million) Forecast, by Application 2020 & 2033
- Table 28: Mexico Magnetite Nanoparticles Market Volume (K Tons) Forecast, by Application 2020 & 2033
- Table 29: Global Magnetite Nanoparticles Market Revenue Million Forecast, by Application 2020 & 2033
- Table 30: Global Magnetite Nanoparticles Market Volume K Tons Forecast, by Application 2020 & 2033
- Table 31: Global Magnetite Nanoparticles Market Revenue Million Forecast, by Country 2020 & 2033
- Table 32: Global Magnetite Nanoparticles Market Volume K Tons Forecast, by Country 2020 & 2033
- Table 33: Germany Magnetite Nanoparticles Market Revenue (Million) Forecast, by Application 2020 & 2033
- Table 34: Germany Magnetite Nanoparticles Market Volume (K Tons) Forecast, by Application 2020 & 2033
- Table 35: United Kingdom Magnetite Nanoparticles Market Revenue (Million) Forecast, by Application 2020 & 2033
- Table 36: United Kingdom Magnetite Nanoparticles Market Volume (K Tons) Forecast, by Application 2020 & 2033
- Table 37: Italy Magnetite Nanoparticles Market Revenue (Million) Forecast, by Application 2020 & 2033
- Table 38: Italy Magnetite Nanoparticles Market Volume (K Tons) Forecast, by Application 2020 & 2033
- Table 39: France Magnetite Nanoparticles Market Revenue (Million) Forecast, by Application 2020 & 2033
- Table 40: France Magnetite Nanoparticles Market Volume (K Tons) Forecast, by Application 2020 & 2033
- Table 41: Rest of Europe Magnetite Nanoparticles Market Revenue (Million) Forecast, by Application 2020 & 2033
- Table 42: Rest of Europe Magnetite Nanoparticles Market Volume (K Tons) Forecast, by Application 2020 & 2033
- Table 43: Global Magnetite Nanoparticles Market Revenue Million Forecast, by Application 2020 & 2033
- Table 44: Global Magnetite Nanoparticles Market Volume K Tons Forecast, by Application 2020 & 2033
- Table 45: Global Magnetite Nanoparticles Market Revenue Million Forecast, by Country 2020 & 2033
- Table 46: Global Magnetite Nanoparticles Market Volume K Tons Forecast, by Country 2020 & 2033
- Table 47: Brazil Magnetite Nanoparticles Market Revenue (Million) Forecast, by Application 2020 & 2033
- Table 48: Brazil Magnetite Nanoparticles Market Volume (K Tons) Forecast, by Application 2020 & 2033
- Table 49: Argentina Magnetite Nanoparticles Market Revenue (Million) Forecast, by Application 2020 & 2033
- Table 50: Argentina Magnetite Nanoparticles Market Volume (K Tons) Forecast, by Application 2020 & 2033
- Table 51: Rest of South America Magnetite Nanoparticles Market Revenue (Million) Forecast, by Application 2020 & 2033
- Table 52: Rest of South America Magnetite Nanoparticles Market Volume (K Tons) Forecast, by Application 2020 & 2033
- Table 53: Global Magnetite Nanoparticles Market Revenue Million Forecast, by Application 2020 & 2033
- Table 54: Global Magnetite Nanoparticles Market Volume K Tons Forecast, by Application 2020 & 2033
- Table 55: Global Magnetite Nanoparticles Market Revenue Million Forecast, by Country 2020 & 2033
- Table 56: Global Magnetite Nanoparticles Market Volume K Tons Forecast, by Country 2020 & 2033
- Table 57: Saudi Arabia Magnetite Nanoparticles Market Revenue (Million) Forecast, by Application 2020 & 2033
- Table 58: Saudi Arabia Magnetite Nanoparticles Market Volume (K Tons) Forecast, by Application 2020 & 2033
- Table 59: South Africa Magnetite Nanoparticles Market Revenue (Million) Forecast, by Application 2020 & 2033
- Table 60: South Africa Magnetite Nanoparticles Market Volume (K Tons) Forecast, by Application 2020 & 2033
- Table 61: Rest of Middle East and Africa Magnetite Nanoparticles Market Revenue (Million) Forecast, by Application 2020 & 2033
- Table 62: Rest of Middle East and Africa Magnetite Nanoparticles Market Volume (K Tons) Forecast, by Application 2020 & 2033
Frequently Asked Questions
1. What is the projected Compound Annual Growth Rate (CAGR) of the Magnetite Nanoparticles Market?
The projected CAGR is approximately 9.6%.
2. Which companies are prominent players in the Magnetite Nanoparticles Market?
Key companies in the market include Nanoshel LLC, Sigma-Aldrich Inc, US Research Nanomaterials Inc, American Elements, Fortis Life Sciences, Reade International Corp, NNCrystal US Corporation, Strem Chemicals Inc, Nanografi Nano Technology, Cytodiagnostics Inc, SkySpring Nanomaterials Inc.
3. What are the main segments of the Magnetite Nanoparticles Market?
The market segments include Application.
4. Can you provide details about the market size?
The market size is estimated to be USD 81.9 Million as of 2022.
5. What are some drivers contributing to market growth?
Rising Demand from Electronics Industry; Growing Demand for Magnetite Nanoparticles in Wastewater Treatment Sector.
6. What are the notable trends driving market growth?
Increasing Demand from Bio-medical Industry.
7. Are there any restraints impacting market growth?
Uncertainty and Volatility in the Raw Material Prices.
8. Can you provide examples of recent developments in the market?
In November 2022, Ascensus Specialties LLC announced its acquisition of the business and certain assets of Strem Chemicals UK, the independent distributor of Ascensus high-purity, research-grade catalysts, ligands, organometallics, metal carbonyls and CVD/ALD precursors for the UK market.
9. What pricing options are available for accessing the report?
Pricing options include single-user, multi-user, and enterprise licenses priced at USD 4750, USD 5250, and USD 8750 respectively.
10. Is the market size provided in terms of value or volume?
The market size is provided in terms of value, measured in Million and volume, measured in K Tons.
11. Are there any specific market keywords associated with the report?
Yes, the market keyword associated with the report is "Magnetite Nanoparticles Market," which aids in identifying and referencing the specific market segment covered.
12. How do I determine which pricing option suits my needs best?
The pricing options vary based on user requirements and access needs. Individual users may opt for single-user licenses, while businesses requiring broader access may choose multi-user or enterprise licenses for cost-effective access to the report.
13. Are there any additional resources or data provided in the Magnetite Nanoparticles Market report?
While the report offers comprehensive insights, it's advisable to review the specific contents or supplementary materials provided to ascertain if additional resources or data are available.
14. How can I stay updated on further developments or reports in the Magnetite Nanoparticles Market?
To stay informed about further developments, trends, and reports in the Magnetite Nanoparticles Market, consider subscribing to industry newsletters, following relevant companies and organizations, or regularly checking reputable industry news sources and publications.
Methodology
Step 1 - Identification of Relevant Samples Size from Population Database


Step 2 - Approaches for Defining Global Market Size (Value, Volume* & Price*)

Note*: In applicable scenarios
Step 3 - Data Sources
Primary Research
- Web Analytics
- Survey Reports
- Research Institute
- Latest Research Reports
- Opinion Leaders
Secondary Research
- Annual Reports
- White Paper
- Latest Press Release
- Industry Association
- Paid Database
- Investor Presentations

Step 4 - Data Triangulation
Involves using different sources of information in order to increase the validity of a study
These sources are likely to be stakeholders in a program - participants, other researchers, program staff, other community members, and so on.
Then we put all data in single framework & apply various statistical tools to find out the dynamic on the market.
During the analysis stage, feedback from the stakeholder groups would be compared to determine areas of agreement as well as areas of divergence