

Key Insights
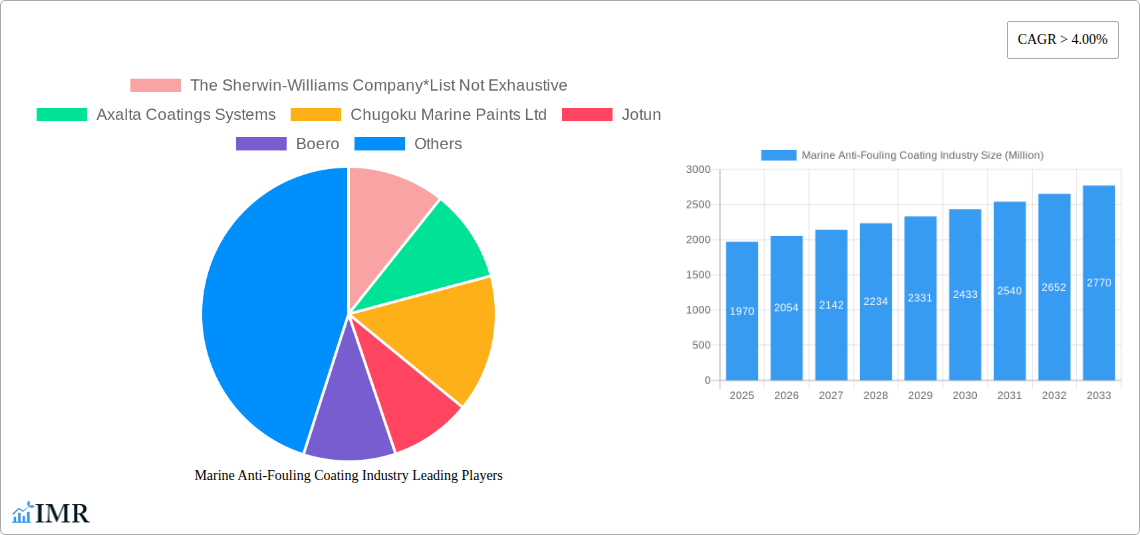
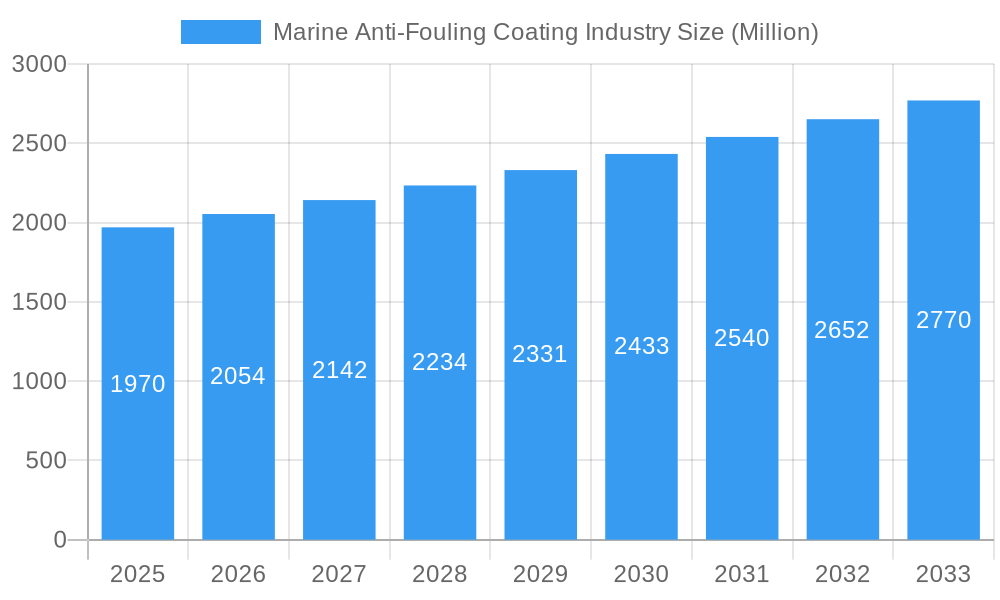
The global marine anti-fouling coating market, valued at $1.97 billion in 2025, is projected to experience robust growth, driven by a Compound Annual Growth Rate (CAGR) exceeding 4% from 2025 to 2033. This expansion is fueled by several key factors. The increasing global maritime trade necessitates regular hull maintenance and coating application to prevent biofouling, which reduces fuel efficiency and increases operational costs. Stringent environmental regulations regarding biocides in anti-fouling paints are pushing innovation towards environmentally friendly, self-polishing, and hybrid solutions, thereby stimulating market growth. Furthermore, the burgeoning demand for larger and more sophisticated vessels, particularly in the offshore oil and gas, and aquaculture sectors, further contributes to the market's expansion. The rising awareness of the economic and environmental impacts of biofouling is also influencing the adoption of advanced coating technologies. Growth will be particularly strong in the Asia-Pacific region, driven by significant shipbuilding and maritime activities in countries like China, Japan, and South Korea.
Marine Anti-Fouling Coating Industry Market Size (In Billion)
Segment-wise, the copper-based coatings segment currently holds a significant market share due to their proven efficacy and cost-effectiveness. However, the self-polishing (silver-based) and hybrid segments are expected to witness faster growth owing to their environmentally friendly nature and superior performance. In terms of application, the hull coatings segment dominates, representing the largest share of the market. However, the growing demand for protective coatings in other applications such as tanks and specialized vessels will contribute to the overall market expansion. While challenges such as fluctuating raw material prices and stringent regulatory compliance pose some constraints, the overall market outlook for marine anti-fouling coatings remains optimistic, driven by technological advancements and increasing global shipping activity. The competitive landscape is characterized by the presence of both established global players and regional manufacturers, leading to a dynamic and innovative market.
Marine Anti-Fouling Coating Industry Company Market Share
Marine Anti-Fouling Coating Industry Market Report: 2019-2033
This comprehensive report provides an in-depth analysis of the marine anti-fouling coating industry, covering market dynamics, growth trends, key players, and future outlook. The study period spans from 2019 to 2033, with 2025 as the base and estimated year. The report offers valuable insights for industry professionals, investors, and stakeholders seeking to understand and navigate this evolving market. The total market value is projected to reach xx Million by 2033.
Marine Anti-Fouling Coating Industry Market Dynamics & Structure
The global marine anti-fouling coating market is characterized by a moderately concentrated landscape, with key players like The Sherwin-Williams Company, Axalta Coatings Systems, Jotun, and Akzo Nobel NV holding significant market share. The market structure is influenced by technological innovation, stringent environmental regulations, and the availability of competitive substitutes. The industry is witnessing a surge in mergers and acquisitions (M&A) activities, driven by the need for expansion, technology acquisition, and enhanced market presence. The total number of M&A deals in the last five years stands at approximately xx.
- Market Concentration: High concentration with the top 10 players accounting for approximately 70% of the global market share.
- Technological Innovation: Focus on developing biocide-free, environmentally friendly coatings and solutions using UV-C light and other innovative technologies.
- Regulatory Framework: Stringent regulations related to biocide usage and environmental impact are driving the adoption of sustainable coatings.
- Competitive Substitutes: Alternatives such as hull cleaning technologies are emerging as competitive solutions, although not yet widespread.
- End-User Demographics: The market is driven by commercial shipping, naval vessels, and the growing yacht and leisure boat segment.
- M&A Trends: An increase in strategic acquisitions to expand product portfolios and global reach. Innovation barriers include high R&D costs and the need for regulatory approvals.
Marine Anti-Fouling Coating Industry Growth Trends & Insights
The marine anti-fouling coating market has exhibited steady growth over the historical period (2019-2024), with a Compound Annual Growth Rate (CAGR) of xx%. This growth is primarily fueled by the increasing demand for efficient and environmentally sustainable solutions from the shipping and marine industries. The market is witnessing increasing adoption rates of advanced coatings, particularly biocide-free and self-polishing options, driven by growing environmental concerns and stricter regulations. Technological disruptions, such as the development of UV-C based fouling control systems, are reshaping the industry landscape. Consumer behavior is shifting towards eco-friendly and high-performance coatings. Market penetration of biocide-free coatings is expected to increase from xx% in 2025 to xx% by 2033.
The market size is projected to reach xx Million in 2025 and xx Million by 2033. The increasing adoption of sophisticated vessel maintenance practices and stricter environmental standards are key drivers propelling this market growth.
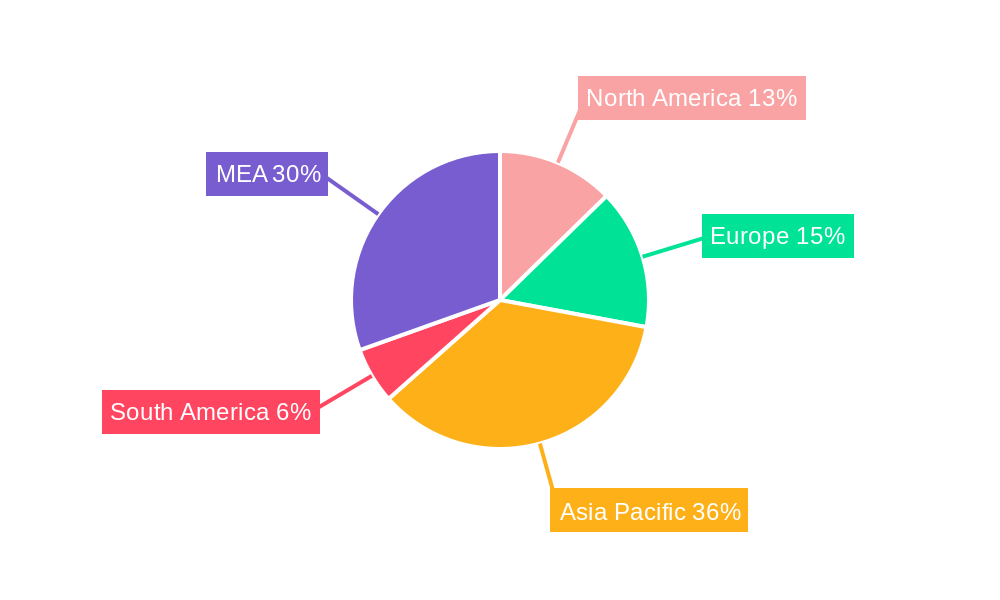
Dominant Regions, Countries, or Segments in Marine Anti-Fouling Coating Industry
The Asia-Pacific region currently dominates the marine anti-fouling coating market, driven by significant growth in the shipping and shipbuilding industries. Within this region, China and other Southeast Asian countries contribute a large share to the overall market size due to their flourishing maritime activities and increasing investment in infrastructure. In terms of segments, the hull coatings segment holds the largest market share owing to its wide application across various vessel types.
- By Type: Copper-based coatings still represent a significant portion of the market; however, the self-polishing and hybrid segments are experiencing rapid growth due to their improved performance and environmental benefits. The "Other Types" segment, including organometallic and silane-based coatings, is also witnessing growth due to advancements in material science.
- By Application: Hull coatings constitute the largest segment, followed by tank coatings and other applications (yachts and vessels). The growth of the yacht and leisure boat industry is driving demand for specialized anti-fouling coatings in this segment.
- Key Drivers: Growth in global shipping and shipbuilding, increased awareness of environmental regulations, and ongoing technological advancements in coating formulations.
Marine Anti-Fouling Coating Industry Product Landscape
The marine anti-fouling coating market showcases a diverse range of products, each offering unique features and benefits. Recent innovations include copper-free formulations that prioritize vessel performance, emissions reduction, and sustainability, along with biocide-free options that minimize environmental impact. Self-polishing coatings provide extended protection, while hybrid solutions combine the advantages of different coating types. Key performance metrics include longevity, biocide release rate, fouling resistance, and overall cost-effectiveness. Unique selling propositions often emphasize environmental compatibility and improved fuel efficiency. Advancements include the integration of nanotechnology for enhanced performance and durability.
Key Drivers, Barriers & Challenges in Marine Anti-Fouling Coating Industry
Key Drivers: Stringent environmental regulations promoting biocide reduction; rising demand from the shipping and shipbuilding industries; continuous technological advancements leading to improved performance and eco-friendly alternatives; increasing focus on fuel efficiency and operational cost savings.
Challenges & Restraints: High R&D costs associated with developing new environmentally compliant solutions; regulatory hurdles and compliance requirements; competition from alternative fouling control technologies (e.g., UV-C systems); supply chain disruptions impacting raw material availability and cost. The impact of these challenges is estimated to decrease the market CAGR by approximately xx% in the forecast period.
Emerging Opportunities in Marine Anti-Fouling Coating Industry
Emerging opportunities exist in the development and adoption of biocide-free and sustainable coating solutions. Untapped markets include smaller vessel segments and developing economies. Innovative applications, such as coatings with self-cleaning capabilities and enhanced antifouling properties, offer significant potential. Evolving consumer preferences towards environmentally responsible products present a crucial growth avenue.
Growth Accelerators in the Marine Anti-Fouling Coating Industry Industry
The marine anti-fouling coating industry's long-term growth will be significantly accelerated by technological breakthroughs in biocide-free formulations, enhanced performance coatings, and the development of sustainable materials. Strategic partnerships between coating manufacturers, shipyards, and research institutions can foster innovation and drive market expansion. The increasing adoption of digital technologies for remote monitoring and predictive maintenance will also propel growth.
Key Players Shaping the Marine Anti-Fouling Coating Industry Market
- The Sherwin-Williams Company
- Axalta Coatings Systems
- Chugoku Marine Paints Ltd
- Jotun
- Boero
- RPM International Inc
- Kansai Paint Co Ltd
- Akzo Nobel NV
- PPG Industries Inc
- Nippon Paint Marine Coatings Co Ltd
- BASF SE
- Hempel A/S
- Lanxess
Notable Milestones in Marine Anti-Fouling Coating Industry Sector
- November 2022: AkzoNobel NV launched a new biocide-free (B-Free) fouling control range, demonstrating a shift towards environmentally friendly solutions.
- December 2022: I-Tech AB and LANXESS successfully tested antifouling coating formulations, showcasing collaboration in biocide technology.
- April 2023: Damen Shipyards, AkzoNobel, and Philips collaborated on a UV-C light-based fouling control solution, highlighting innovative approaches to fouling management.
- October 2023: Hempel A/S opened new production facilities, indicating increased capacity to meet growing market demands.
- March 2024: PPG Industries Inc. launched PPG Nexeon 810, a copper-free antifouling coating emphasizing vessel performance and sustainability.
In-Depth Marine Anti-Fouling Coating Industry Market Outlook
The future of the marine anti-fouling coating market looks promising, driven by the continued demand for sustainable and high-performance solutions. The focus on biocide reduction, technological innovation, and strategic partnerships will further accelerate market growth. Emerging opportunities in innovative applications and untapped markets will shape the industry's future landscape, creating significant potential for both established players and new entrants. The market is poised for sustained growth with a projected CAGR of xx% during the forecast period (2025-2033).
Marine Anti-Fouling Coating Industry Segmentation
-
1. Type
- 1.1. Copper-based
- 1.2. Self-polishing (Silver-based)
- 1.3. Hybrid
- 1.4. Other Types (Organo Metallic, Silane)
-
2. Application
- 2.1. Hull Coatings
- 2.2. Tank Coatings
- 2.3. Other Applications (Yachts and Vessels)
Marine Anti-Fouling Coating Industry Segmentation By Geography
-
1. Asia Pacific
- 1.1. China
- 1.2. India
- 1.3. Japan
- 1.4. South Korea
- 1.5. Thailand
- 1.6. Vietnam
- 1.7. Indonesia
- 1.8. Malaysia
- 1.9. Rest of Asia Pacific
-
2. North America
- 2.1. United States
- 2.2. Canada
- 2.3. Mexico
-
3. Europe
- 3.1. Germany
- 3.2. United Kingdom
- 3.3. France
- 3.4. Italy
- 3.5. Spain
- 3.6. Russia
- 3.7. NORDIC Countries
- 3.8. Turkey
- 3.9. Rest of Europe
-
4. South America
- 4.1. Brazil
- 4.2. Argentina
- 4.3. Colombia
- 4.4. Rest of South America
-
5. Middle East and Africa
- 5.1. Saudi Arabia
- 5.2. South Africa
- 5.3. Nigeria
- 5.4. United Arab Emirates
- 5.5. Qatar
- 5.6. Egypt
- 5.7. Rest of Middle East and Africa
Marine Anti-Fouling Coating Industry Regional Market Share
Geographic Coverage of Marine Anti-Fouling Coating Industry
Marine Anti-Fouling Coating Industry REPORT HIGHLIGHTS
| Aspects | Details |
|---|---|
| Study Period | 2020-2034 |
| Base Year | 2025 |
| Estimated Year | 2026 |
| Forecast Period | 2026-2034 |
| Historical Period | 2020-2025 |
| Growth Rate | CAGR of > 4.00% from 2020-2034 |
| Segmentation |
|
Table of Contents
- 1. Introduction
- 1.1. Research Scope
- 1.2. Market Segmentation
- 1.3. Research Objective
- 1.4. Definitions and Assumptions
- 2. Executive Summary
- 2.1. Market Snapshot
- 3. Market Dynamics
- 3.1. Market Drivers
- 3.2. Market Restrains
- 3.3. Market Trends
- 3.4. Market Opportunities
- 4. Market Factor Analysis
- 4.1. Porters Five Forces
- 4.1.1. Bargaining Power of Suppliers
- 4.1.2. Bargaining Power of Buyers
- 4.1.3. Threat of New Entrants
- 4.1.4. Threat of Substitutes
- 4.1.5. Competitive Rivalry
- 4.2. PESTEL analysis
- 4.3. BCG Analysis
- 4.3.1. Stars (High Growth, High Market Share)
- 4.3.2. Cash Cows (Low Growth, High Market Share)
- 4.3.3. Question Mark (High Growth, Low Market Share)
- 4.3.4. Dogs (Low Growth, Low Market Share)
- 4.4. Ansoff Matrix Analysis
- 4.5. Supply Chain Analysis
- 4.6. Regulatory Landscape
- 4.7. Current Market Potential and Opportunity Assessment (TAM–SAM–SOM Framework)
- 4.8. IMR Analyst Note
- 4.1. Porters Five Forces
- 5. Market Analysis, Insights and Forecast 2021-2033
- 5.1. Market Analysis, Insights and Forecast - by Type
- 5.1.1. Copper-based
- 5.1.2. Self-polishing (Silver-based)
- 5.1.3. Hybrid
- 5.1.4. Other Types (Organo Metallic, Silane)
- 5.2. Market Analysis, Insights and Forecast - by Application
- 5.2.1. Hull Coatings
- 5.2.2. Tank Coatings
- 5.2.3. Other Applications (Yachts and Vessels)
- 5.3. Market Analysis, Insights and Forecast - by Region
- 5.3.1. Asia Pacific
- 5.3.2. North America
- 5.3.3. Europe
- 5.3.4. South America
- 5.3.5. Middle East and Africa
- 5.1. Market Analysis, Insights and Forecast - by Type
- 6. Global Marine Anti-Fouling Coating Industry Analysis, Insights and Forecast, 2021-2033
- 6.1. Market Analysis, Insights and Forecast - by Type
- 6.1.1. Copper-based
- 6.1.2. Self-polishing (Silver-based)
- 6.1.3. Hybrid
- 6.1.4. Other Types (Organo Metallic, Silane)
- 6.2. Market Analysis, Insights and Forecast - by Application
- 6.2.1. Hull Coatings
- 6.2.2. Tank Coatings
- 6.2.3. Other Applications (Yachts and Vessels)
- 6.1. Market Analysis, Insights and Forecast - by Type
- 7. Asia Pacific Marine Anti-Fouling Coating Industry Analysis, Insights and Forecast, 2020-2032
- 7.1. Market Analysis, Insights and Forecast - by Type
- 7.1.1. Copper-based
- 7.1.2. Self-polishing (Silver-based)
- 7.1.3. Hybrid
- 7.1.4. Other Types (Organo Metallic, Silane)
- 7.2. Market Analysis, Insights and Forecast - by Application
- 7.2.1. Hull Coatings
- 7.2.2. Tank Coatings
- 7.2.3. Other Applications (Yachts and Vessels)
- 7.1. Market Analysis, Insights and Forecast - by Type
- 8. North America Marine Anti-Fouling Coating Industry Analysis, Insights and Forecast, 2020-2032
- 8.1. Market Analysis, Insights and Forecast - by Type
- 8.1.1. Copper-based
- 8.1.2. Self-polishing (Silver-based)
- 8.1.3. Hybrid
- 8.1.4. Other Types (Organo Metallic, Silane)
- 8.2. Market Analysis, Insights and Forecast - by Application
- 8.2.1. Hull Coatings
- 8.2.2. Tank Coatings
- 8.2.3. Other Applications (Yachts and Vessels)
- 8.1. Market Analysis, Insights and Forecast - by Type
- 9. Europe Marine Anti-Fouling Coating Industry Analysis, Insights and Forecast, 2020-2032
- 9.1. Market Analysis, Insights and Forecast - by Type
- 9.1.1. Copper-based
- 9.1.2. Self-polishing (Silver-based)
- 9.1.3. Hybrid
- 9.1.4. Other Types (Organo Metallic, Silane)
- 9.2. Market Analysis, Insights and Forecast - by Application
- 9.2.1. Hull Coatings
- 9.2.2. Tank Coatings
- 9.2.3. Other Applications (Yachts and Vessels)
- 9.1. Market Analysis, Insights and Forecast - by Type
- 10. South America Marine Anti-Fouling Coating Industry Analysis, Insights and Forecast, 2020-2032
- 10.1. Market Analysis, Insights and Forecast - by Type
- 10.1.1. Copper-based
- 10.1.2. Self-polishing (Silver-based)
- 10.1.3. Hybrid
- 10.1.4. Other Types (Organo Metallic, Silane)
- 10.2. Market Analysis, Insights and Forecast - by Application
- 10.2.1. Hull Coatings
- 10.2.2. Tank Coatings
- 10.2.3. Other Applications (Yachts and Vessels)
- 10.1. Market Analysis, Insights and Forecast - by Type
- 11. Middle East and Africa Marine Anti-Fouling Coating Industry Analysis, Insights and Forecast, 2020-2032
- 11.1. Market Analysis, Insights and Forecast - by Type
- 11.1.1. Copper-based
- 11.1.2. Self-polishing (Silver-based)
- 11.1.3. Hybrid
- 11.1.4. Other Types (Organo Metallic, Silane)
- 11.2. Market Analysis, Insights and Forecast - by Application
- 11.2.1. Hull Coatings
- 11.2.2. Tank Coatings
- 11.2.3. Other Applications (Yachts and Vessels)
- 11.1. Market Analysis, Insights and Forecast - by Type
- 12. Competitive Analysis
- 12.1. Company Profiles
- 12.1.1 The Sherwin-Williams Company*List Not Exhaustive
- 12.1.1.1. Company Overview
- 12.1.1.2. Products
- 12.1.1.3. Company Financials
- 12.1.1.4. SWOT Analysis
- 12.1.2 Axalta Coatings Systems
- 12.1.2.1. Company Overview
- 12.1.2.2. Products
- 12.1.2.3. Company Financials
- 12.1.2.4. SWOT Analysis
- 12.1.3 Chugoku Marine Paints Ltd
- 12.1.3.1. Company Overview
- 12.1.3.2. Products
- 12.1.3.3. Company Financials
- 12.1.3.4. SWOT Analysis
- 12.1.4 Jotun
- 12.1.4.1. Company Overview
- 12.1.4.2. Products
- 12.1.4.3. Company Financials
- 12.1.4.4. SWOT Analysis
- 12.1.5 Boero
- 12.1.5.1. Company Overview
- 12.1.5.2. Products
- 12.1.5.3. Company Financials
- 12.1.5.4. SWOT Analysis
- 12.1.6 RPM International Inc
- 12.1.6.1. Company Overview
- 12.1.6.2. Products
- 12.1.6.3. Company Financials
- 12.1.6.4. SWOT Analysis
- 12.1.7 Kansai Paint Co Ltd
- 12.1.7.1. Company Overview
- 12.1.7.2. Products
- 12.1.7.3. Company Financials
- 12.1.7.4. SWOT Analysis
- 12.1.8 Akzo Nobel NV
- 12.1.8.1. Company Overview
- 12.1.8.2. Products
- 12.1.8.3. Company Financials
- 12.1.8.4. SWOT Analysis
- 12.1.9 PPG Industries Inc
- 12.1.9.1. Company Overview
- 12.1.9.2. Products
- 12.1.9.3. Company Financials
- 12.1.9.4. SWOT Analysis
- 12.1.10 Nippon Paint Marine Coatings Co Ltd
- 12.1.10.1. Company Overview
- 12.1.10.2. Products
- 12.1.10.3. Company Financials
- 12.1.10.4. SWOT Analysis
- 12.1.11 BASF SE
- 12.1.11.1. Company Overview
- 12.1.11.2. Products
- 12.1.11.3. Company Financials
- 12.1.11.4. SWOT Analysis
- 12.1.12 Hempel A/S
- 12.1.12.1. Company Overview
- 12.1.12.2. Products
- 12.1.12.3. Company Financials
- 12.1.12.4. SWOT Analysis
- 12.1.13 Lanxess
- 12.1.13.1. Company Overview
- 12.1.13.2. Products
- 12.1.13.3. Company Financials
- 12.1.13.4. SWOT Analysis
- 12.1.1 The Sherwin-Williams Company*List Not Exhaustive
- 12.2. Market Entropy
- 12.2.1 Company's Key Areas Served
- 12.2.2 Recent Developments
- 12.3. Company Market Share Analysis 2025
- 12.3.1 Top 5 Companies Market Share Analysis
- 12.3.2 Top 3 Companies Market Share Analysis
- 12.4. List of Potential Customers
- 13. Research Methodology
List of Figures
- Figure 1: Global Marine Anti-Fouling Coating Industry Revenue Breakdown (Million, %) by Region 2025 & 2033
- Figure 2: Global Marine Anti-Fouling Coating Industry Volume Breakdown (liter, %) by Region 2025 & 2033
- Figure 3: Asia Pacific Marine Anti-Fouling Coating Industry Revenue (Million), by Type 2025 & 2033
- Figure 4: Asia Pacific Marine Anti-Fouling Coating Industry Volume (liter), by Type 2025 & 2033
- Figure 5: Asia Pacific Marine Anti-Fouling Coating Industry Revenue Share (%), by Type 2025 & 2033
- Figure 6: Asia Pacific Marine Anti-Fouling Coating Industry Volume Share (%), by Type 2025 & 2033
- Figure 7: Asia Pacific Marine Anti-Fouling Coating Industry Revenue (Million), by Application 2025 & 2033
- Figure 8: Asia Pacific Marine Anti-Fouling Coating Industry Volume (liter), by Application 2025 & 2033
- Figure 9: Asia Pacific Marine Anti-Fouling Coating Industry Revenue Share (%), by Application 2025 & 2033
- Figure 10: Asia Pacific Marine Anti-Fouling Coating Industry Volume Share (%), by Application 2025 & 2033
- Figure 11: Asia Pacific Marine Anti-Fouling Coating Industry Revenue (Million), by Country 2025 & 2033
- Figure 12: Asia Pacific Marine Anti-Fouling Coating Industry Volume (liter), by Country 2025 & 2033
- Figure 13: Asia Pacific Marine Anti-Fouling Coating Industry Revenue Share (%), by Country 2025 & 2033
- Figure 14: Asia Pacific Marine Anti-Fouling Coating Industry Volume Share (%), by Country 2025 & 2033
- Figure 15: North America Marine Anti-Fouling Coating Industry Revenue (Million), by Type 2025 & 2033
- Figure 16: North America Marine Anti-Fouling Coating Industry Volume (liter), by Type 2025 & 2033
- Figure 17: North America Marine Anti-Fouling Coating Industry Revenue Share (%), by Type 2025 & 2033
- Figure 18: North America Marine Anti-Fouling Coating Industry Volume Share (%), by Type 2025 & 2033
- Figure 19: North America Marine Anti-Fouling Coating Industry Revenue (Million), by Application 2025 & 2033
- Figure 20: North America Marine Anti-Fouling Coating Industry Volume (liter), by Application 2025 & 2033
- Figure 21: North America Marine Anti-Fouling Coating Industry Revenue Share (%), by Application 2025 & 2033
- Figure 22: North America Marine Anti-Fouling Coating Industry Volume Share (%), by Application 2025 & 2033
- Figure 23: North America Marine Anti-Fouling Coating Industry Revenue (Million), by Country 2025 & 2033
- Figure 24: North America Marine Anti-Fouling Coating Industry Volume (liter), by Country 2025 & 2033
- Figure 25: North America Marine Anti-Fouling Coating Industry Revenue Share (%), by Country 2025 & 2033
- Figure 26: North America Marine Anti-Fouling Coating Industry Volume Share (%), by Country 2025 & 2033
- Figure 27: Europe Marine Anti-Fouling Coating Industry Revenue (Million), by Type 2025 & 2033
- Figure 28: Europe Marine Anti-Fouling Coating Industry Volume (liter), by Type 2025 & 2033
- Figure 29: Europe Marine Anti-Fouling Coating Industry Revenue Share (%), by Type 2025 & 2033
- Figure 30: Europe Marine Anti-Fouling Coating Industry Volume Share (%), by Type 2025 & 2033
- Figure 31: Europe Marine Anti-Fouling Coating Industry Revenue (Million), by Application 2025 & 2033
- Figure 32: Europe Marine Anti-Fouling Coating Industry Volume (liter), by Application 2025 & 2033
- Figure 33: Europe Marine Anti-Fouling Coating Industry Revenue Share (%), by Application 2025 & 2033
- Figure 34: Europe Marine Anti-Fouling Coating Industry Volume Share (%), by Application 2025 & 2033
- Figure 35: Europe Marine Anti-Fouling Coating Industry Revenue (Million), by Country 2025 & 2033
- Figure 36: Europe Marine Anti-Fouling Coating Industry Volume (liter), by Country 2025 & 2033
- Figure 37: Europe Marine Anti-Fouling Coating Industry Revenue Share (%), by Country 2025 & 2033
- Figure 38: Europe Marine Anti-Fouling Coating Industry Volume Share (%), by Country 2025 & 2033
- Figure 39: South America Marine Anti-Fouling Coating Industry Revenue (Million), by Type 2025 & 2033
- Figure 40: South America Marine Anti-Fouling Coating Industry Volume (liter), by Type 2025 & 2033
- Figure 41: South America Marine Anti-Fouling Coating Industry Revenue Share (%), by Type 2025 & 2033
- Figure 42: South America Marine Anti-Fouling Coating Industry Volume Share (%), by Type 2025 & 2033
- Figure 43: South America Marine Anti-Fouling Coating Industry Revenue (Million), by Application 2025 & 2033
- Figure 44: South America Marine Anti-Fouling Coating Industry Volume (liter), by Application 2025 & 2033
- Figure 45: South America Marine Anti-Fouling Coating Industry Revenue Share (%), by Application 2025 & 2033
- Figure 46: South America Marine Anti-Fouling Coating Industry Volume Share (%), by Application 2025 & 2033
- Figure 47: South America Marine Anti-Fouling Coating Industry Revenue (Million), by Country 2025 & 2033
- Figure 48: South America Marine Anti-Fouling Coating Industry Volume (liter), by Country 2025 & 2033
- Figure 49: South America Marine Anti-Fouling Coating Industry Revenue Share (%), by Country 2025 & 2033
- Figure 50: South America Marine Anti-Fouling Coating Industry Volume Share (%), by Country 2025 & 2033
- Figure 51: Middle East and Africa Marine Anti-Fouling Coating Industry Revenue (Million), by Type 2025 & 2033
- Figure 52: Middle East and Africa Marine Anti-Fouling Coating Industry Volume (liter), by Type 2025 & 2033
- Figure 53: Middle East and Africa Marine Anti-Fouling Coating Industry Revenue Share (%), by Type 2025 & 2033
- Figure 54: Middle East and Africa Marine Anti-Fouling Coating Industry Volume Share (%), by Type 2025 & 2033
- Figure 55: Middle East and Africa Marine Anti-Fouling Coating Industry Revenue (Million), by Application 2025 & 2033
- Figure 56: Middle East and Africa Marine Anti-Fouling Coating Industry Volume (liter), by Application 2025 & 2033
- Figure 57: Middle East and Africa Marine Anti-Fouling Coating Industry Revenue Share (%), by Application 2025 & 2033
- Figure 58: Middle East and Africa Marine Anti-Fouling Coating Industry Volume Share (%), by Application 2025 & 2033
- Figure 59: Middle East and Africa Marine Anti-Fouling Coating Industry Revenue (Million), by Country 2025 & 2033
- Figure 60: Middle East and Africa Marine Anti-Fouling Coating Industry Volume (liter), by Country 2025 & 2033
- Figure 61: Middle East and Africa Marine Anti-Fouling Coating Industry Revenue Share (%), by Country 2025 & 2033
- Figure 62: Middle East and Africa Marine Anti-Fouling Coating Industry Volume Share (%), by Country 2025 & 2033
List of Tables
- Table 1: Global Marine Anti-Fouling Coating Industry Revenue Million Forecast, by Type 2020 & 2033
- Table 2: Global Marine Anti-Fouling Coating Industry Volume liter Forecast, by Type 2020 & 2033
- Table 3: Global Marine Anti-Fouling Coating Industry Revenue Million Forecast, by Application 2020 & 2033
- Table 4: Global Marine Anti-Fouling Coating Industry Volume liter Forecast, by Application 2020 & 2033
- Table 5: Global Marine Anti-Fouling Coating Industry Revenue Million Forecast, by Region 2020 & 2033
- Table 6: Global Marine Anti-Fouling Coating Industry Volume liter Forecast, by Region 2020 & 2033
- Table 7: Global Marine Anti-Fouling Coating Industry Revenue Million Forecast, by Type 2020 & 2033
- Table 8: Global Marine Anti-Fouling Coating Industry Volume liter Forecast, by Type 2020 & 2033
- Table 9: Global Marine Anti-Fouling Coating Industry Revenue Million Forecast, by Application 2020 & 2033
- Table 10: Global Marine Anti-Fouling Coating Industry Volume liter Forecast, by Application 2020 & 2033
- Table 11: Global Marine Anti-Fouling Coating Industry Revenue Million Forecast, by Country 2020 & 2033
- Table 12: Global Marine Anti-Fouling Coating Industry Volume liter Forecast, by Country 2020 & 2033
- Table 13: China Marine Anti-Fouling Coating Industry Revenue (Million) Forecast, by Application 2020 & 2033
- Table 14: China Marine Anti-Fouling Coating Industry Volume (liter) Forecast, by Application 2020 & 2033
- Table 15: India Marine Anti-Fouling Coating Industry Revenue (Million) Forecast, by Application 2020 & 2033
- Table 16: India Marine Anti-Fouling Coating Industry Volume (liter) Forecast, by Application 2020 & 2033
- Table 17: Japan Marine Anti-Fouling Coating Industry Revenue (Million) Forecast, by Application 2020 & 2033
- Table 18: Japan Marine Anti-Fouling Coating Industry Volume (liter) Forecast, by Application 2020 & 2033
- Table 19: South Korea Marine Anti-Fouling Coating Industry Revenue (Million) Forecast, by Application 2020 & 2033
- Table 20: South Korea Marine Anti-Fouling Coating Industry Volume (liter) Forecast, by Application 2020 & 2033
- Table 21: Thailand Marine Anti-Fouling Coating Industry Revenue (Million) Forecast, by Application 2020 & 2033
- Table 22: Thailand Marine Anti-Fouling Coating Industry Volume (liter) Forecast, by Application 2020 & 2033
- Table 23: Vietnam Marine Anti-Fouling Coating Industry Revenue (Million) Forecast, by Application 2020 & 2033
- Table 24: Vietnam Marine Anti-Fouling Coating Industry Volume (liter) Forecast, by Application 2020 & 2033
- Table 25: Indonesia Marine Anti-Fouling Coating Industry Revenue (Million) Forecast, by Application 2020 & 2033
- Table 26: Indonesia Marine Anti-Fouling Coating Industry Volume (liter) Forecast, by Application 2020 & 2033
- Table 27: Malaysia Marine Anti-Fouling Coating Industry Revenue (Million) Forecast, by Application 2020 & 2033
- Table 28: Malaysia Marine Anti-Fouling Coating Industry Volume (liter) Forecast, by Application 2020 & 2033
- Table 29: Rest of Asia Pacific Marine Anti-Fouling Coating Industry Revenue (Million) Forecast, by Application 2020 & 2033
- Table 30: Rest of Asia Pacific Marine Anti-Fouling Coating Industry Volume (liter) Forecast, by Application 2020 & 2033
- Table 31: Global Marine Anti-Fouling Coating Industry Revenue Million Forecast, by Type 2020 & 2033
- Table 32: Global Marine Anti-Fouling Coating Industry Volume liter Forecast, by Type 2020 & 2033
- Table 33: Global Marine Anti-Fouling Coating Industry Revenue Million Forecast, by Application 2020 & 2033
- Table 34: Global Marine Anti-Fouling Coating Industry Volume liter Forecast, by Application 2020 & 2033
- Table 35: Global Marine Anti-Fouling Coating Industry Revenue Million Forecast, by Country 2020 & 2033
- Table 36: Global Marine Anti-Fouling Coating Industry Volume liter Forecast, by Country 2020 & 2033
- Table 37: United States Marine Anti-Fouling Coating Industry Revenue (Million) Forecast, by Application 2020 & 2033
- Table 38: United States Marine Anti-Fouling Coating Industry Volume (liter) Forecast, by Application 2020 & 2033
- Table 39: Canada Marine Anti-Fouling Coating Industry Revenue (Million) Forecast, by Application 2020 & 2033
- Table 40: Canada Marine Anti-Fouling Coating Industry Volume (liter) Forecast, by Application 2020 & 2033
- Table 41: Mexico Marine Anti-Fouling Coating Industry Revenue (Million) Forecast, by Application 2020 & 2033
- Table 42: Mexico Marine Anti-Fouling Coating Industry Volume (liter) Forecast, by Application 2020 & 2033
- Table 43: Global Marine Anti-Fouling Coating Industry Revenue Million Forecast, by Type 2020 & 2033
- Table 44: Global Marine Anti-Fouling Coating Industry Volume liter Forecast, by Type 2020 & 2033
- Table 45: Global Marine Anti-Fouling Coating Industry Revenue Million Forecast, by Application 2020 & 2033
- Table 46: Global Marine Anti-Fouling Coating Industry Volume liter Forecast, by Application 2020 & 2033
- Table 47: Global Marine Anti-Fouling Coating Industry Revenue Million Forecast, by Country 2020 & 2033
- Table 48: Global Marine Anti-Fouling Coating Industry Volume liter Forecast, by Country 2020 & 2033
- Table 49: Germany Marine Anti-Fouling Coating Industry Revenue (Million) Forecast, by Application 2020 & 2033
- Table 50: Germany Marine Anti-Fouling Coating Industry Volume (liter) Forecast, by Application 2020 & 2033
- Table 51: United Kingdom Marine Anti-Fouling Coating Industry Revenue (Million) Forecast, by Application 2020 & 2033
- Table 52: United Kingdom Marine Anti-Fouling Coating Industry Volume (liter) Forecast, by Application 2020 & 2033
- Table 53: France Marine Anti-Fouling Coating Industry Revenue (Million) Forecast, by Application 2020 & 2033
- Table 54: France Marine Anti-Fouling Coating Industry Volume (liter) Forecast, by Application 2020 & 2033
- Table 55: Italy Marine Anti-Fouling Coating Industry Revenue (Million) Forecast, by Application 2020 & 2033
- Table 56: Italy Marine Anti-Fouling Coating Industry Volume (liter) Forecast, by Application 2020 & 2033
- Table 57: Spain Marine Anti-Fouling Coating Industry Revenue (Million) Forecast, by Application 2020 & 2033
- Table 58: Spain Marine Anti-Fouling Coating Industry Volume (liter) Forecast, by Application 2020 & 2033
- Table 59: Russia Marine Anti-Fouling Coating Industry Revenue (Million) Forecast, by Application 2020 & 2033
- Table 60: Russia Marine Anti-Fouling Coating Industry Volume (liter) Forecast, by Application 2020 & 2033
- Table 61: NORDIC Countries Marine Anti-Fouling Coating Industry Revenue (Million) Forecast, by Application 2020 & 2033
- Table 62: NORDIC Countries Marine Anti-Fouling Coating Industry Volume (liter) Forecast, by Application 2020 & 2033
- Table 63: Turkey Marine Anti-Fouling Coating Industry Revenue (Million) Forecast, by Application 2020 & 2033
- Table 64: Turkey Marine Anti-Fouling Coating Industry Volume (liter) Forecast, by Application 2020 & 2033
- Table 65: Rest of Europe Marine Anti-Fouling Coating Industry Revenue (Million) Forecast, by Application 2020 & 2033
- Table 66: Rest of Europe Marine Anti-Fouling Coating Industry Volume (liter) Forecast, by Application 2020 & 2033
- Table 67: Global Marine Anti-Fouling Coating Industry Revenue Million Forecast, by Type 2020 & 2033
- Table 68: Global Marine Anti-Fouling Coating Industry Volume liter Forecast, by Type 2020 & 2033
- Table 69: Global Marine Anti-Fouling Coating Industry Revenue Million Forecast, by Application 2020 & 2033
- Table 70: Global Marine Anti-Fouling Coating Industry Volume liter Forecast, by Application 2020 & 2033
- Table 71: Global Marine Anti-Fouling Coating Industry Revenue Million Forecast, by Country 2020 & 2033
- Table 72: Global Marine Anti-Fouling Coating Industry Volume liter Forecast, by Country 2020 & 2033
- Table 73: Brazil Marine Anti-Fouling Coating Industry Revenue (Million) Forecast, by Application 2020 & 2033
- Table 74: Brazil Marine Anti-Fouling Coating Industry Volume (liter) Forecast, by Application 2020 & 2033
- Table 75: Argentina Marine Anti-Fouling Coating Industry Revenue (Million) Forecast, by Application 2020 & 2033
- Table 76: Argentina Marine Anti-Fouling Coating Industry Volume (liter) Forecast, by Application 2020 & 2033
- Table 77: Colombia Marine Anti-Fouling Coating Industry Revenue (Million) Forecast, by Application 2020 & 2033
- Table 78: Colombia Marine Anti-Fouling Coating Industry Volume (liter) Forecast, by Application 2020 & 2033
- Table 79: Rest of South America Marine Anti-Fouling Coating Industry Revenue (Million) Forecast, by Application 2020 & 2033
- Table 80: Rest of South America Marine Anti-Fouling Coating Industry Volume (liter) Forecast, by Application 2020 & 2033
- Table 81: Global Marine Anti-Fouling Coating Industry Revenue Million Forecast, by Type 2020 & 2033
- Table 82: Global Marine Anti-Fouling Coating Industry Volume liter Forecast, by Type 2020 & 2033
- Table 83: Global Marine Anti-Fouling Coating Industry Revenue Million Forecast, by Application 2020 & 2033
- Table 84: Global Marine Anti-Fouling Coating Industry Volume liter Forecast, by Application 2020 & 2033
- Table 85: Global Marine Anti-Fouling Coating Industry Revenue Million Forecast, by Country 2020 & 2033
- Table 86: Global Marine Anti-Fouling Coating Industry Volume liter Forecast, by Country 2020 & 2033
- Table 87: Saudi Arabia Marine Anti-Fouling Coating Industry Revenue (Million) Forecast, by Application 2020 & 2033
- Table 88: Saudi Arabia Marine Anti-Fouling Coating Industry Volume (liter) Forecast, by Application 2020 & 2033
- Table 89: South Africa Marine Anti-Fouling Coating Industry Revenue (Million) Forecast, by Application 2020 & 2033
- Table 90: South Africa Marine Anti-Fouling Coating Industry Volume (liter) Forecast, by Application 2020 & 2033
- Table 91: Nigeria Marine Anti-Fouling Coating Industry Revenue (Million) Forecast, by Application 2020 & 2033
- Table 92: Nigeria Marine Anti-Fouling Coating Industry Volume (liter) Forecast, by Application 2020 & 2033
- Table 93: United Arab Emirates Marine Anti-Fouling Coating Industry Revenue (Million) Forecast, by Application 2020 & 2033
- Table 94: United Arab Emirates Marine Anti-Fouling Coating Industry Volume (liter) Forecast, by Application 2020 & 2033
- Table 95: Qatar Marine Anti-Fouling Coating Industry Revenue (Million) Forecast, by Application 2020 & 2033
- Table 96: Qatar Marine Anti-Fouling Coating Industry Volume (liter) Forecast, by Application 2020 & 2033
- Table 97: Egypt Marine Anti-Fouling Coating Industry Revenue (Million) Forecast, by Application 2020 & 2033
- Table 98: Egypt Marine Anti-Fouling Coating Industry Volume (liter) Forecast, by Application 2020 & 2033
- Table 99: Rest of Middle East and Africa Marine Anti-Fouling Coating Industry Revenue (Million) Forecast, by Application 2020 & 2033
- Table 100: Rest of Middle East and Africa Marine Anti-Fouling Coating Industry Volume (liter) Forecast, by Application 2020 & 2033
Frequently Asked Questions
1. What is the projected Compound Annual Growth Rate (CAGR) of the Marine Anti-Fouling Coating Industry?
The projected CAGR is approximately > 4.00%.
2. Which companies are prominent players in the Marine Anti-Fouling Coating Industry?
Key companies in the market include The Sherwin-Williams Company*List Not Exhaustive, Axalta Coatings Systems, Chugoku Marine Paints Ltd, Jotun, Boero, RPM International Inc, Kansai Paint Co Ltd, Akzo Nobel NV, PPG Industries Inc, Nippon Paint Marine Coatings Co Ltd, BASF SE, Hempel A/S, Lanxess.
3. What are the main segments of the Marine Anti-Fouling Coating Industry?
The market segments include Type, Application.
4. Can you provide details about the market size?
The market size is estimated to be USD 1.97 Million as of 2022.
5. What are some drivers contributing to market growth?
Increasing Production of Leisure Boats and Cruise Ships; Increase in Ship Repairs and Maintenance Activities; Surging Demand from Oil and Gas Industry.
6. What are the notable trends driving market growth?
Hull Coatings Segment to Dominate the Market.
7. Are there any restraints impacting market growth?
Stringent Government Regulations; Increased Usage of High-standard Durable Products.
8. Can you provide examples of recent developments in the market?
March 2024: PPG Industries Inc. launched PPG Nexeon 810, a copper-free antifouling coating developed with an emphasis on vessel performance, emissions reduction, and sustainability. It can yield an immediate boost in power of up to 10% and enhance operational efficiency by up to 15% due to improved fouling control performance.
9. What pricing options are available for accessing the report?
Pricing options include single-user, multi-user, and enterprise licenses priced at USD 4750, USD 5250, and USD 8750 respectively.
10. Is the market size provided in terms of value or volume?
The market size is provided in terms of value, measured in Million and volume, measured in liter.
11. Are there any specific market keywords associated with the report?
Yes, the market keyword associated with the report is "Marine Anti-Fouling Coating Industry," which aids in identifying and referencing the specific market segment covered.
12. How do I determine which pricing option suits my needs best?
The pricing options vary based on user requirements and access needs. Individual users may opt for single-user licenses, while businesses requiring broader access may choose multi-user or enterprise licenses for cost-effective access to the report.
13. Are there any additional resources or data provided in the Marine Anti-Fouling Coating Industry report?
While the report offers comprehensive insights, it's advisable to review the specific contents or supplementary materials provided to ascertain if additional resources or data are available.
14. How can I stay updated on further developments or reports in the Marine Anti-Fouling Coating Industry?
To stay informed about further developments, trends, and reports in the Marine Anti-Fouling Coating Industry, consider subscribing to industry newsletters, following relevant companies and organizations, or regularly checking reputable industry news sources and publications.
Methodology
Step 1 - Identification of Relevant Samples Size from Population Database


Step 2 - Approaches for Defining Global Market Size (Value, Volume* & Price*)

Note*: In applicable scenarios
Step 3 - Data Sources
Primary Research
- Web Analytics
- Survey Reports
- Research Institute
- Latest Research Reports
- Opinion Leaders
Secondary Research
- Annual Reports
- White Paper
- Latest Press Release
- Industry Association
- Paid Database
- Investor Presentations

Step 4 - Data Triangulation
Involves using different sources of information in order to increase the validity of a study
These sources are likely to be stakeholders in a program - participants, other researchers, program staff, other community members, and so on.
Then we put all data in single framework & apply various statistical tools to find out the dynamic on the market.
During the analysis stage, feedback from the stakeholder groups would be compared to determine areas of agreement as well as areas of divergence