

Key Insights
The global Melamine Formaldehyde Resin market is forecast to reach $993.01 million by 2025, exhibiting a Compound Annual Growth Rate (CAGR) of 9.3%. This expansion is propelled by escalating demand across critical sectors including construction, automotive, and paints & coatings. Growth in developing economies, particularly in infrastructure development, is a key driver for laminates and wood adhesives. The automotive industry's utilization of molding compounds and the paints and coatings sector's preference for durable, high-performance resins further accelerate market trends. Innovations in resin properties, such as enhanced durability and water resistance, are also stimulating market progression. The market is segmented by type (Iso-butylated Melamine Formaldehyde Resin, n-butylated Melamine Formaldehyde Resin, and Others) and application (Laminates, Wood Adhesives, Molding Compounds, Paints and Coatings, and Others). Key market participants include BASF SE, Hexion, and AkzoNobel NV, alongside regional players, fostering a dynamic competitive landscape. The Asia-Pacific region is anticipated to lead market growth due to rapid industrialization and infrastructure advancements.
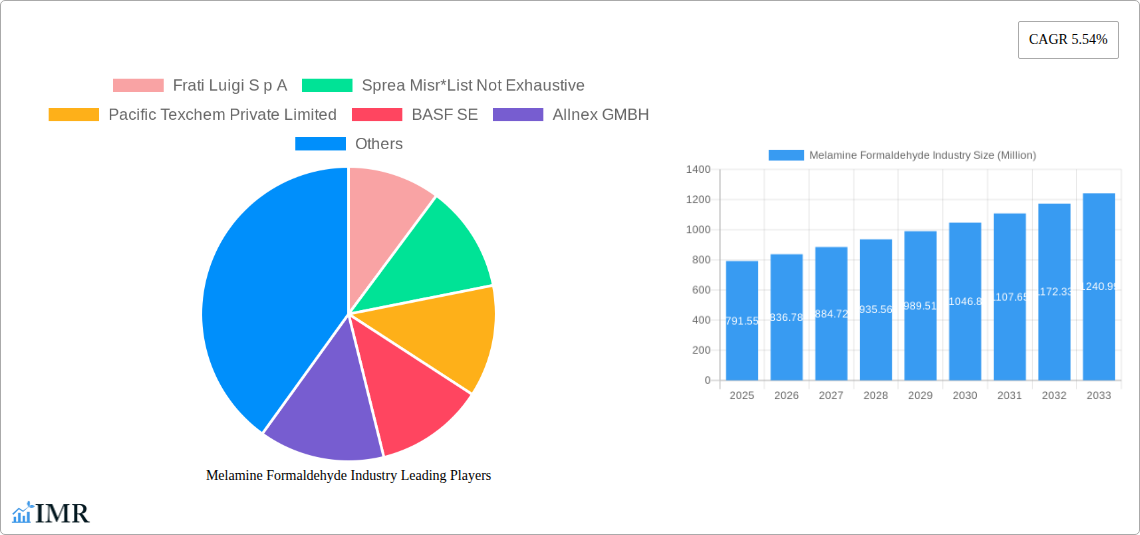
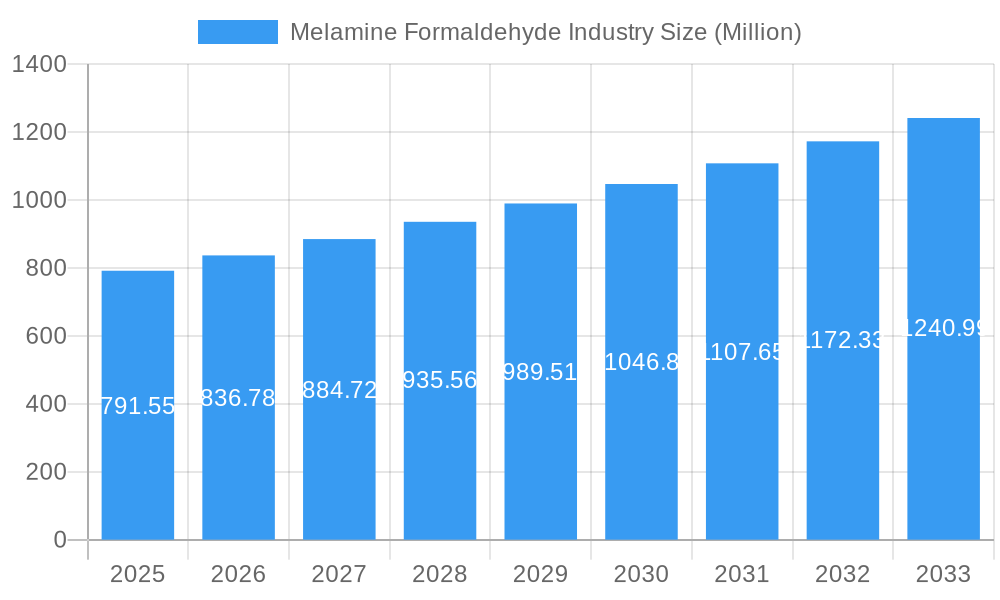
Melamine Formaldehyde Industry Market Size (In Million)
Challenges for the Melamine Formaldehyde Resin market include raw material price volatility for melamine and formaldehyde, and stringent environmental regulations regarding formaldehyde emissions. These regulations necessitate investment in sustainable production processes, presenting opportunities for companies to adopt greener technologies. While initial investment in sustainable solutions may be a barrier, developing innovative products with enhanced safety profiles and environmental responsibility is crucial for long-term market success and addressing consumer health concerns. Balancing cost-effectiveness with environmental stewardship and consumer safety will define the industry's future trajectory.
Melamine Formaldehyde Industry Company Market Share
Melamine Formaldehyde Industry Market Report: 2019-2033
This comprehensive report provides an in-depth analysis of the Melamine Formaldehyde industry, encompassing market dynamics, growth trends, regional landscapes, and key player strategies. With a focus on the parent market of resins and the child market of various applications, this report offers invaluable insights for industry professionals, investors, and strategic decision-makers. The study period covers 2019-2033, with a base year of 2025 and a forecast period of 2025-2033.
Melamine Formaldehyde Industry Market Dynamics & Structure
This section analyzes the market structure, competitive landscape, and key influencing factors. The global Melamine Formaldehyde market size in 2024 was valued at approximately 2000 Million units, and is projected to reach xx Million units by 2033. Market concentration is moderately high, with several major players controlling a significant share. Technological advancements, particularly in resin formulations and application methods, are major drivers of innovation. Stringent environmental regulations regarding formaldehyde emissions pose a significant challenge, influencing product development and adoption. The market also experiences competitive pressure from alternative adhesive and coating materials. M&A activity is moderate, with several strategic acquisitions observed in recent years.
- Market Concentration: Moderately high, with top 5 players holding approximately 60% market share (2024).
- Technological Innovation: Focus on low-formaldehyde emission resins and improved performance characteristics.
- Regulatory Framework: Stringent environmental regulations impacting production and application.
- Competitive Substitutes: Growing competition from alternative adhesives and coatings.
- M&A Activity: Moderate activity, with approximately 5-10 significant deals annually (2019-2024).
- End-User Demographics: Primarily driven by the construction, furniture, and automotive industries.
Melamine Formaldehyde Industry Growth Trends & Insights
The Melamine Formaldehyde market experienced a steady growth trajectory between 2019 and 2024, largely driven by increased demand from construction and furniture sectors. However, growth rates have been influenced by economic fluctuations and varying regulatory landscapes across different regions. Technological disruptions, such as the development of low-formaldehyde resins, have impacted adoption rates positively. Consumer preferences are shifting towards more sustainable and environmentally friendly products, influencing manufacturers to innovate and adapt their offerings. The projected CAGR for the forecast period (2025-2033) is estimated at 4.5%. Market penetration remains high in developed regions but presents substantial growth opportunities in developing economies. The global market value in 2025 is predicted to be 2200 Million units.
Dominant Regions, Countries, or Segments in Melamine Formaldehyde Industry
The Asia-Pacific region dominates the Melamine Formaldehyde market, driven by robust growth in the construction and furniture industries in countries like China and India. North America and Europe also hold significant market shares. Within the product segments, Iso-butylated Melamine Formaldehyde Resin and n-butylated Melamine Formaldehyde Resin account for the largest market shares, owing to their wide application in laminates and wood adhesives.
- Dominant Region: Asia-Pacific (approximately 45% market share in 2024).
- Key Drivers in Asia-Pacific: Rapid urbanization, infrastructure development, and rising disposable incomes.
- Dominant Application Segment: Laminates (approximately 35% market share in 2024), driven by extensive use in construction and furniture.
- Dominant Type Segment: Iso-butylated Melamine Formaldehyde Resin (approximately 50% market share in 2024).
Melamine Formaldehyde Industry Product Landscape
Product innovation centers on developing low-formaldehyde-emission resins that meet stringent environmental regulations while maintaining performance characteristics. This involves modifying the resin's chemical structure and improving manufacturing processes. The key selling propositions are improved durability, enhanced bonding strength, and reduced environmental impact. Recent advancements include the introduction of water-based resins to further minimize the environmental footprint.
Key Drivers, Barriers & Challenges in Melamine Formaldehyde Industry
Key Drivers:
- Increased demand from the construction and furniture sectors.
- Growing use in automotive and other industrial applications.
- Development of low-formaldehyde-emission resins.
Challenges:
- Stringent environmental regulations limiting formaldehyde emissions.
- Fluctuations in raw material prices (e.g., melamine and formaldehyde).
- Competition from alternative adhesive and coating materials.
- Supply chain disruptions impacting production and distribution.
Emerging Opportunities in Melamine Formaldehyde Industry
Emerging opportunities include exploring new applications in specialized areas like aerospace and electronics, focusing on developing bio-based or recycled-content resins, and expanding into emerging markets with high growth potential in developing economies. The rise of green building practices and sustainable materials presents an exciting opportunity for the industry.
Growth Accelerators in the Melamine Formaldehyde Industry Industry
The industry's growth will be significantly accelerated by continued technological innovation focusing on sustainable and high-performance resins, strategic partnerships and collaborations between resin manufacturers and end-users to develop tailored solutions, and the expansion into emerging markets through targeted marketing and distribution strategies.
Key Players Shaping the Melamine Formaldehyde Industry Market
- Frati Luigi S p A
- Sprea Misr
- Pacific Texchem Private Limited
- BASF SE
- Allnex GMBH
- Hexion
- Metadynea Metafrax Group
- AkzoNobel NV
- Arclin Inc
- Cornerstone Chemical
Notable Milestones in Melamine Formaldehyde Industry Sector
- 2021: BASF SE launched a new range of low-formaldehyde-emission resins.
- 2022: Hexion acquired a smaller resin manufacturer, expanding its market share.
- 2023: Allnex GMBH invested in a new manufacturing facility for increased production capacity.
- (Further milestones will be detailed in the complete report)
In-Depth Melamine Formaldehyde Industry Market Outlook
The Melamine Formaldehyde market is poised for continued growth, driven by innovation in sustainable and high-performance resins, expansion into new applications, and rising demand from key end-use sectors. Strategic partnerships, market diversification, and technological advancements will play a crucial role in shaping the industry's future and unlocking significant growth opportunities over the forecast period. The market is projected to experience robust growth, particularly in developing economies.
Melamine Formaldehyde Industry Segmentation
-
1. Type
- 1.1. Iso-butylated Melamine Formaldehyde Resin
- 1.2. n-butylated Melamine Formaldehyde Resin
- 1.3. Other Types
-
2. Application
- 2.1. Laminates
- 2.2. Wood Adhesives
- 2.3. Molding Compounds
- 2.4. Paints and Coatings
- 2.5. Other Applications
Melamine Formaldehyde Industry Segmentation By Geography
-
1. Asia Pacific
- 1.1. China
- 1.2. India
- 1.3. Japan
- 1.4. South Korea
- 1.5. Rest of Asia Pacific
-
2. North America
- 2.1. United States
- 2.2. Canada
- 2.3. Mexico
-
3. Europe
- 3.1. Germany
- 3.2. United Kingdom
- 3.3. France
- 3.4. Italy
- 3.5. Rest of Europe
-
4. South America
- 4.1. Brazil
- 4.2. Argentina
- 4.3. Rest of South America
-
5. Middle East and Africa
- 5.1. Saudi Arabia
- 5.2. South Africa
- 5.3. Rest of Middle East and Africa
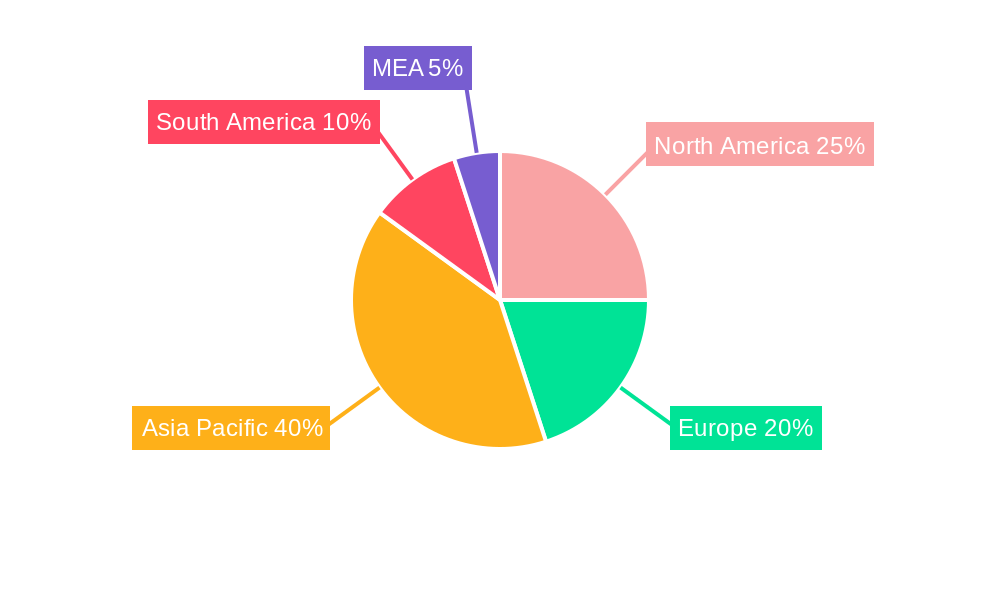
Melamine Formaldehyde Industry Regional Market Share
Geographic Coverage of Melamine Formaldehyde Industry
Melamine Formaldehyde Industry REPORT HIGHLIGHTS
| Aspects | Details |
|---|---|
| Study Period | 2020-2034 |
| Base Year | 2025 |
| Estimated Year | 2026 |
| Forecast Period | 2026-2034 |
| Historical Period | 2020-2025 |
| Growth Rate | CAGR of 9.3% from 2020-2034 |
| Segmentation |
|
Table of Contents
- 1. Introduction
- 1.1. Research Scope
- 1.2. Market Segmentation
- 1.3. Research Objective
- 1.4. Definitions and Assumptions
- 2. Executive Summary
- 2.1. Market Snapshot
- 3. Market Dynamics
- 3.1. Market Drivers
- 3.2. Market Restrains
- 3.3. Market Trends
- 3.4. Market Opportunities
- 4. Market Factor Analysis
- 4.1. Porters Five Forces
- 4.1.1. Bargaining Power of Suppliers
- 4.1.2. Bargaining Power of Buyers
- 4.1.3. Threat of New Entrants
- 4.1.4. Threat of Substitutes
- 4.1.5. Competitive Rivalry
- 4.2. PESTEL analysis
- 4.3. BCG Analysis
- 4.3.1. Stars (High Growth, High Market Share)
- 4.3.2. Cash Cows (Low Growth, High Market Share)
- 4.3.3. Question Mark (High Growth, Low Market Share)
- 4.3.4. Dogs (Low Growth, Low Market Share)
- 4.4. Ansoff Matrix Analysis
- 4.5. Supply Chain Analysis
- 4.6. Regulatory Landscape
- 4.7. Current Market Potential and Opportunity Assessment (TAM–SAM–SOM Framework)
- 4.8. IMR Analyst Note
- 4.1. Porters Five Forces
- 5. Market Analysis, Insights and Forecast 2021-2033
- 5.1. Market Analysis, Insights and Forecast - by Type
- 5.1.1. Iso-butylated Melamine Formaldehyde Resin
- 5.1.2. n-butylated Melamine Formaldehyde Resin
- 5.1.3. Other Types
- 5.2. Market Analysis, Insights and Forecast - by Application
- 5.2.1. Laminates
- 5.2.2. Wood Adhesives
- 5.2.3. Molding Compounds
- 5.2.4. Paints and Coatings
- 5.2.5. Other Applications
- 5.3. Market Analysis, Insights and Forecast - by Region
- 5.3.1. Asia Pacific
- 5.3.2. North America
- 5.3.3. Europe
- 5.3.4. South America
- 5.3.5. Middle East and Africa
- 5.1. Market Analysis, Insights and Forecast - by Type
- 6. Global Melamine Formaldehyde Industry Analysis, Insights and Forecast, 2021-2033
- 6.1. Market Analysis, Insights and Forecast - by Type
- 6.1.1. Iso-butylated Melamine Formaldehyde Resin
- 6.1.2. n-butylated Melamine Formaldehyde Resin
- 6.1.3. Other Types
- 6.2. Market Analysis, Insights and Forecast - by Application
- 6.2.1. Laminates
- 6.2.2. Wood Adhesives
- 6.2.3. Molding Compounds
- 6.2.4. Paints and Coatings
- 6.2.5. Other Applications
- 6.1. Market Analysis, Insights and Forecast - by Type
- 7. Asia Pacific Melamine Formaldehyde Industry Analysis, Insights and Forecast, 2020-2032
- 7.1. Market Analysis, Insights and Forecast - by Type
- 7.1.1. Iso-butylated Melamine Formaldehyde Resin
- 7.1.2. n-butylated Melamine Formaldehyde Resin
- 7.1.3. Other Types
- 7.2. Market Analysis, Insights and Forecast - by Application
- 7.2.1. Laminates
- 7.2.2. Wood Adhesives
- 7.2.3. Molding Compounds
- 7.2.4. Paints and Coatings
- 7.2.5. Other Applications
- 7.1. Market Analysis, Insights and Forecast - by Type
- 8. North America Melamine Formaldehyde Industry Analysis, Insights and Forecast, 2020-2032
- 8.1. Market Analysis, Insights and Forecast - by Type
- 8.1.1. Iso-butylated Melamine Formaldehyde Resin
- 8.1.2. n-butylated Melamine Formaldehyde Resin
- 8.1.3. Other Types
- 8.2. Market Analysis, Insights and Forecast - by Application
- 8.2.1. Laminates
- 8.2.2. Wood Adhesives
- 8.2.3. Molding Compounds
- 8.2.4. Paints and Coatings
- 8.2.5. Other Applications
- 8.1. Market Analysis, Insights and Forecast - by Type
- 9. Europe Melamine Formaldehyde Industry Analysis, Insights and Forecast, 2020-2032
- 9.1. Market Analysis, Insights and Forecast - by Type
- 9.1.1. Iso-butylated Melamine Formaldehyde Resin
- 9.1.2. n-butylated Melamine Formaldehyde Resin
- 9.1.3. Other Types
- 9.2. Market Analysis, Insights and Forecast - by Application
- 9.2.1. Laminates
- 9.2.2. Wood Adhesives
- 9.2.3. Molding Compounds
- 9.2.4. Paints and Coatings
- 9.2.5. Other Applications
- 9.1. Market Analysis, Insights and Forecast - by Type
- 10. South America Melamine Formaldehyde Industry Analysis, Insights and Forecast, 2020-2032
- 10.1. Market Analysis, Insights and Forecast - by Type
- 10.1.1. Iso-butylated Melamine Formaldehyde Resin
- 10.1.2. n-butylated Melamine Formaldehyde Resin
- 10.1.3. Other Types
- 10.2. Market Analysis, Insights and Forecast - by Application
- 10.2.1. Laminates
- 10.2.2. Wood Adhesives
- 10.2.3. Molding Compounds
- 10.2.4. Paints and Coatings
- 10.2.5. Other Applications
- 10.1. Market Analysis, Insights and Forecast - by Type
- 11. Middle East and Africa Melamine Formaldehyde Industry Analysis, Insights and Forecast, 2020-2032
- 11.1. Market Analysis, Insights and Forecast - by Type
- 11.1.1. Iso-butylated Melamine Formaldehyde Resin
- 11.1.2. n-butylated Melamine Formaldehyde Resin
- 11.1.3. Other Types
- 11.2. Market Analysis, Insights and Forecast - by Application
- 11.2.1. Laminates
- 11.2.2. Wood Adhesives
- 11.2.3. Molding Compounds
- 11.2.4. Paints and Coatings
- 11.2.5. Other Applications
- 11.1. Market Analysis, Insights and Forecast - by Type
- 12. Competitive Analysis
- 12.1. Company Profiles
- 12.1.1 Frati Luigi S p A
- 12.1.1.1. Company Overview
- 12.1.1.2. Products
- 12.1.1.3. Company Financials
- 12.1.1.4. SWOT Analysis
- 12.1.2 Sprea Misr*List Not Exhaustive
- 12.1.2.1. Company Overview
- 12.1.2.2. Products
- 12.1.2.3. Company Financials
- 12.1.2.4. SWOT Analysis
- 12.1.3 Pacific Texchem Private Limited
- 12.1.3.1. Company Overview
- 12.1.3.2. Products
- 12.1.3.3. Company Financials
- 12.1.3.4. SWOT Analysis
- 12.1.4 BASF SE
- 12.1.4.1. Company Overview
- 12.1.4.2. Products
- 12.1.4.3. Company Financials
- 12.1.4.4. SWOT Analysis
- 12.1.5 Allnex GMBH
- 12.1.5.1. Company Overview
- 12.1.5.2. Products
- 12.1.5.3. Company Financials
- 12.1.5.4. SWOT Analysis
- 12.1.6 Hexion
- 12.1.6.1. Company Overview
- 12.1.6.2. Products
- 12.1.6.3. Company Financials
- 12.1.6.4. SWOT Analysis
- 12.1.7 Metadynea Metafrax Group
- 12.1.7.1. Company Overview
- 12.1.7.2. Products
- 12.1.7.3. Company Financials
- 12.1.7.4. SWOT Analysis
- 12.1.8 AkzoNobel NV
- 12.1.8.1. Company Overview
- 12.1.8.2. Products
- 12.1.8.3. Company Financials
- 12.1.8.4. SWOT Analysis
- 12.1.9 Arclin Inc
- 12.1.9.1. Company Overview
- 12.1.9.2. Products
- 12.1.9.3. Company Financials
- 12.1.9.4. SWOT Analysis
- 12.1.10 Cornerstone Chemical
- 12.1.10.1. Company Overview
- 12.1.10.2. Products
- 12.1.10.3. Company Financials
- 12.1.10.4. SWOT Analysis
- 12.1.1 Frati Luigi S p A
- 12.2. Market Entropy
- 12.2.1 Company's Key Areas Served
- 12.2.2 Recent Developments
- 12.3. Company Market Share Analysis 2025
- 12.3.1 Top 5 Companies Market Share Analysis
- 12.3.2 Top 3 Companies Market Share Analysis
- 12.4. List of Potential Customers
- 13. Research Methodology
List of Figures
- Figure 1: Global Melamine Formaldehyde Industry Revenue Breakdown (million, %) by Region 2025 & 2033
- Figure 2: Global Melamine Formaldehyde Industry Volume Breakdown (K Tons, %) by Region 2025 & 2033
- Figure 3: Asia Pacific Melamine Formaldehyde Industry Revenue (million), by Type 2025 & 2033
- Figure 4: Asia Pacific Melamine Formaldehyde Industry Volume (K Tons), by Type 2025 & 2033
- Figure 5: Asia Pacific Melamine Formaldehyde Industry Revenue Share (%), by Type 2025 & 2033
- Figure 6: Asia Pacific Melamine Formaldehyde Industry Volume Share (%), by Type 2025 & 2033
- Figure 7: Asia Pacific Melamine Formaldehyde Industry Revenue (million), by Application 2025 & 2033
- Figure 8: Asia Pacific Melamine Formaldehyde Industry Volume (K Tons), by Application 2025 & 2033
- Figure 9: Asia Pacific Melamine Formaldehyde Industry Revenue Share (%), by Application 2025 & 2033
- Figure 10: Asia Pacific Melamine Formaldehyde Industry Volume Share (%), by Application 2025 & 2033
- Figure 11: Asia Pacific Melamine Formaldehyde Industry Revenue (million), by Country 2025 & 2033
- Figure 12: Asia Pacific Melamine Formaldehyde Industry Volume (K Tons), by Country 2025 & 2033
- Figure 13: Asia Pacific Melamine Formaldehyde Industry Revenue Share (%), by Country 2025 & 2033
- Figure 14: Asia Pacific Melamine Formaldehyde Industry Volume Share (%), by Country 2025 & 2033
- Figure 15: North America Melamine Formaldehyde Industry Revenue (million), by Type 2025 & 2033
- Figure 16: North America Melamine Formaldehyde Industry Volume (K Tons), by Type 2025 & 2033
- Figure 17: North America Melamine Formaldehyde Industry Revenue Share (%), by Type 2025 & 2033
- Figure 18: North America Melamine Formaldehyde Industry Volume Share (%), by Type 2025 & 2033
- Figure 19: North America Melamine Formaldehyde Industry Revenue (million), by Application 2025 & 2033
- Figure 20: North America Melamine Formaldehyde Industry Volume (K Tons), by Application 2025 & 2033
- Figure 21: North America Melamine Formaldehyde Industry Revenue Share (%), by Application 2025 & 2033
- Figure 22: North America Melamine Formaldehyde Industry Volume Share (%), by Application 2025 & 2033
- Figure 23: North America Melamine Formaldehyde Industry Revenue (million), by Country 2025 & 2033
- Figure 24: North America Melamine Formaldehyde Industry Volume (K Tons), by Country 2025 & 2033
- Figure 25: North America Melamine Formaldehyde Industry Revenue Share (%), by Country 2025 & 2033
- Figure 26: North America Melamine Formaldehyde Industry Volume Share (%), by Country 2025 & 2033
- Figure 27: Europe Melamine Formaldehyde Industry Revenue (million), by Type 2025 & 2033
- Figure 28: Europe Melamine Formaldehyde Industry Volume (K Tons), by Type 2025 & 2033
- Figure 29: Europe Melamine Formaldehyde Industry Revenue Share (%), by Type 2025 & 2033
- Figure 30: Europe Melamine Formaldehyde Industry Volume Share (%), by Type 2025 & 2033
- Figure 31: Europe Melamine Formaldehyde Industry Revenue (million), by Application 2025 & 2033
- Figure 32: Europe Melamine Formaldehyde Industry Volume (K Tons), by Application 2025 & 2033
- Figure 33: Europe Melamine Formaldehyde Industry Revenue Share (%), by Application 2025 & 2033
- Figure 34: Europe Melamine Formaldehyde Industry Volume Share (%), by Application 2025 & 2033
- Figure 35: Europe Melamine Formaldehyde Industry Revenue (million), by Country 2025 & 2033
- Figure 36: Europe Melamine Formaldehyde Industry Volume (K Tons), by Country 2025 & 2033
- Figure 37: Europe Melamine Formaldehyde Industry Revenue Share (%), by Country 2025 & 2033
- Figure 38: Europe Melamine Formaldehyde Industry Volume Share (%), by Country 2025 & 2033
- Figure 39: South America Melamine Formaldehyde Industry Revenue (million), by Type 2025 & 2033
- Figure 40: South America Melamine Formaldehyde Industry Volume (K Tons), by Type 2025 & 2033
- Figure 41: South America Melamine Formaldehyde Industry Revenue Share (%), by Type 2025 & 2033
- Figure 42: South America Melamine Formaldehyde Industry Volume Share (%), by Type 2025 & 2033
- Figure 43: South America Melamine Formaldehyde Industry Revenue (million), by Application 2025 & 2033
- Figure 44: South America Melamine Formaldehyde Industry Volume (K Tons), by Application 2025 & 2033
- Figure 45: South America Melamine Formaldehyde Industry Revenue Share (%), by Application 2025 & 2033
- Figure 46: South America Melamine Formaldehyde Industry Volume Share (%), by Application 2025 & 2033
- Figure 47: South America Melamine Formaldehyde Industry Revenue (million), by Country 2025 & 2033
- Figure 48: South America Melamine Formaldehyde Industry Volume (K Tons), by Country 2025 & 2033
- Figure 49: South America Melamine Formaldehyde Industry Revenue Share (%), by Country 2025 & 2033
- Figure 50: South America Melamine Formaldehyde Industry Volume Share (%), by Country 2025 & 2033
- Figure 51: Middle East and Africa Melamine Formaldehyde Industry Revenue (million), by Type 2025 & 2033
- Figure 52: Middle East and Africa Melamine Formaldehyde Industry Volume (K Tons), by Type 2025 & 2033
- Figure 53: Middle East and Africa Melamine Formaldehyde Industry Revenue Share (%), by Type 2025 & 2033
- Figure 54: Middle East and Africa Melamine Formaldehyde Industry Volume Share (%), by Type 2025 & 2033
- Figure 55: Middle East and Africa Melamine Formaldehyde Industry Revenue (million), by Application 2025 & 2033
- Figure 56: Middle East and Africa Melamine Formaldehyde Industry Volume (K Tons), by Application 2025 & 2033
- Figure 57: Middle East and Africa Melamine Formaldehyde Industry Revenue Share (%), by Application 2025 & 2033
- Figure 58: Middle East and Africa Melamine Formaldehyde Industry Volume Share (%), by Application 2025 & 2033
- Figure 59: Middle East and Africa Melamine Formaldehyde Industry Revenue (million), by Country 2025 & 2033
- Figure 60: Middle East and Africa Melamine Formaldehyde Industry Volume (K Tons), by Country 2025 & 2033
- Figure 61: Middle East and Africa Melamine Formaldehyde Industry Revenue Share (%), by Country 2025 & 2033
- Figure 62: Middle East and Africa Melamine Formaldehyde Industry Volume Share (%), by Country 2025 & 2033
List of Tables
- Table 1: Global Melamine Formaldehyde Industry Revenue million Forecast, by Type 2020 & 2033
- Table 2: Global Melamine Formaldehyde Industry Volume K Tons Forecast, by Type 2020 & 2033
- Table 3: Global Melamine Formaldehyde Industry Revenue million Forecast, by Application 2020 & 2033
- Table 4: Global Melamine Formaldehyde Industry Volume K Tons Forecast, by Application 2020 & 2033
- Table 5: Global Melamine Formaldehyde Industry Revenue million Forecast, by Region 2020 & 2033
- Table 6: Global Melamine Formaldehyde Industry Volume K Tons Forecast, by Region 2020 & 2033
- Table 7: Global Melamine Formaldehyde Industry Revenue million Forecast, by Type 2020 & 2033
- Table 8: Global Melamine Formaldehyde Industry Volume K Tons Forecast, by Type 2020 & 2033
- Table 9: Global Melamine Formaldehyde Industry Revenue million Forecast, by Application 2020 & 2033
- Table 10: Global Melamine Formaldehyde Industry Volume K Tons Forecast, by Application 2020 & 2033
- Table 11: Global Melamine Formaldehyde Industry Revenue million Forecast, by Country 2020 & 2033
- Table 12: Global Melamine Formaldehyde Industry Volume K Tons Forecast, by Country 2020 & 2033
- Table 13: China Melamine Formaldehyde Industry Revenue (million) Forecast, by Application 2020 & 2033
- Table 14: China Melamine Formaldehyde Industry Volume (K Tons) Forecast, by Application 2020 & 2033
- Table 15: India Melamine Formaldehyde Industry Revenue (million) Forecast, by Application 2020 & 2033
- Table 16: India Melamine Formaldehyde Industry Volume (K Tons) Forecast, by Application 2020 & 2033
- Table 17: Japan Melamine Formaldehyde Industry Revenue (million) Forecast, by Application 2020 & 2033
- Table 18: Japan Melamine Formaldehyde Industry Volume (K Tons) Forecast, by Application 2020 & 2033
- Table 19: South Korea Melamine Formaldehyde Industry Revenue (million) Forecast, by Application 2020 & 2033
- Table 20: South Korea Melamine Formaldehyde Industry Volume (K Tons) Forecast, by Application 2020 & 2033
- Table 21: Rest of Asia Pacific Melamine Formaldehyde Industry Revenue (million) Forecast, by Application 2020 & 2033
- Table 22: Rest of Asia Pacific Melamine Formaldehyde Industry Volume (K Tons) Forecast, by Application 2020 & 2033
- Table 23: Global Melamine Formaldehyde Industry Revenue million Forecast, by Type 2020 & 2033
- Table 24: Global Melamine Formaldehyde Industry Volume K Tons Forecast, by Type 2020 & 2033
- Table 25: Global Melamine Formaldehyde Industry Revenue million Forecast, by Application 2020 & 2033
- Table 26: Global Melamine Formaldehyde Industry Volume K Tons Forecast, by Application 2020 & 2033
- Table 27: Global Melamine Formaldehyde Industry Revenue million Forecast, by Country 2020 & 2033
- Table 28: Global Melamine Formaldehyde Industry Volume K Tons Forecast, by Country 2020 & 2033
- Table 29: United States Melamine Formaldehyde Industry Revenue (million) Forecast, by Application 2020 & 2033
- Table 30: United States Melamine Formaldehyde Industry Volume (K Tons) Forecast, by Application 2020 & 2033
- Table 31: Canada Melamine Formaldehyde Industry Revenue (million) Forecast, by Application 2020 & 2033
- Table 32: Canada Melamine Formaldehyde Industry Volume (K Tons) Forecast, by Application 2020 & 2033
- Table 33: Mexico Melamine Formaldehyde Industry Revenue (million) Forecast, by Application 2020 & 2033
- Table 34: Mexico Melamine Formaldehyde Industry Volume (K Tons) Forecast, by Application 2020 & 2033
- Table 35: Global Melamine Formaldehyde Industry Revenue million Forecast, by Type 2020 & 2033
- Table 36: Global Melamine Formaldehyde Industry Volume K Tons Forecast, by Type 2020 & 2033
- Table 37: Global Melamine Formaldehyde Industry Revenue million Forecast, by Application 2020 & 2033
- Table 38: Global Melamine Formaldehyde Industry Volume K Tons Forecast, by Application 2020 & 2033
- Table 39: Global Melamine Formaldehyde Industry Revenue million Forecast, by Country 2020 & 2033
- Table 40: Global Melamine Formaldehyde Industry Volume K Tons Forecast, by Country 2020 & 2033
- Table 41: Germany Melamine Formaldehyde Industry Revenue (million) Forecast, by Application 2020 & 2033
- Table 42: Germany Melamine Formaldehyde Industry Volume (K Tons) Forecast, by Application 2020 & 2033
- Table 43: United Kingdom Melamine Formaldehyde Industry Revenue (million) Forecast, by Application 2020 & 2033
- Table 44: United Kingdom Melamine Formaldehyde Industry Volume (K Tons) Forecast, by Application 2020 & 2033
- Table 45: France Melamine Formaldehyde Industry Revenue (million) Forecast, by Application 2020 & 2033
- Table 46: France Melamine Formaldehyde Industry Volume (K Tons) Forecast, by Application 2020 & 2033
- Table 47: Italy Melamine Formaldehyde Industry Revenue (million) Forecast, by Application 2020 & 2033
- Table 48: Italy Melamine Formaldehyde Industry Volume (K Tons) Forecast, by Application 2020 & 2033
- Table 49: Rest of Europe Melamine Formaldehyde Industry Revenue (million) Forecast, by Application 2020 & 2033
- Table 50: Rest of Europe Melamine Formaldehyde Industry Volume (K Tons) Forecast, by Application 2020 & 2033
- Table 51: Global Melamine Formaldehyde Industry Revenue million Forecast, by Type 2020 & 2033
- Table 52: Global Melamine Formaldehyde Industry Volume K Tons Forecast, by Type 2020 & 2033
- Table 53: Global Melamine Formaldehyde Industry Revenue million Forecast, by Application 2020 & 2033
- Table 54: Global Melamine Formaldehyde Industry Volume K Tons Forecast, by Application 2020 & 2033
- Table 55: Global Melamine Formaldehyde Industry Revenue million Forecast, by Country 2020 & 2033
- Table 56: Global Melamine Formaldehyde Industry Volume K Tons Forecast, by Country 2020 & 2033
- Table 57: Brazil Melamine Formaldehyde Industry Revenue (million) Forecast, by Application 2020 & 2033
- Table 58: Brazil Melamine Formaldehyde Industry Volume (K Tons) Forecast, by Application 2020 & 2033
- Table 59: Argentina Melamine Formaldehyde Industry Revenue (million) Forecast, by Application 2020 & 2033
- Table 60: Argentina Melamine Formaldehyde Industry Volume (K Tons) Forecast, by Application 2020 & 2033
- Table 61: Rest of South America Melamine Formaldehyde Industry Revenue (million) Forecast, by Application 2020 & 2033
- Table 62: Rest of South America Melamine Formaldehyde Industry Volume (K Tons) Forecast, by Application 2020 & 2033
- Table 63: Global Melamine Formaldehyde Industry Revenue million Forecast, by Type 2020 & 2033
- Table 64: Global Melamine Formaldehyde Industry Volume K Tons Forecast, by Type 2020 & 2033
- Table 65: Global Melamine Formaldehyde Industry Revenue million Forecast, by Application 2020 & 2033
- Table 66: Global Melamine Formaldehyde Industry Volume K Tons Forecast, by Application 2020 & 2033
- Table 67: Global Melamine Formaldehyde Industry Revenue million Forecast, by Country 2020 & 2033
- Table 68: Global Melamine Formaldehyde Industry Volume K Tons Forecast, by Country 2020 & 2033
- Table 69: Saudi Arabia Melamine Formaldehyde Industry Revenue (million) Forecast, by Application 2020 & 2033
- Table 70: Saudi Arabia Melamine Formaldehyde Industry Volume (K Tons) Forecast, by Application 2020 & 2033
- Table 71: South Africa Melamine Formaldehyde Industry Revenue (million) Forecast, by Application 2020 & 2033
- Table 72: South Africa Melamine Formaldehyde Industry Volume (K Tons) Forecast, by Application 2020 & 2033
- Table 73: Rest of Middle East and Africa Melamine Formaldehyde Industry Revenue (million) Forecast, by Application 2020 & 2033
- Table 74: Rest of Middle East and Africa Melamine Formaldehyde Industry Volume (K Tons) Forecast, by Application 2020 & 2033
Frequently Asked Questions
1. What is the projected Compound Annual Growth Rate (CAGR) of the Melamine Formaldehyde Industry?
The projected CAGR is approximately 9.3%.
2. Which companies are prominent players in the Melamine Formaldehyde Industry?
Key companies in the market include Frati Luigi S p A, Sprea Misr*List Not Exhaustive, Pacific Texchem Private Limited, BASF SE, Allnex GMBH, Hexion, Metadynea Metafrax Group, AkzoNobel NV, Arclin Inc, Cornerstone Chemical.
3. What are the main segments of the Melamine Formaldehyde Industry?
The market segments include Type, Application.
4. Can you provide details about the market size?
The market size is estimated to be USD 993.01 million as of 2022.
5. What are some drivers contributing to market growth?
Growing Demand for Formica Laminated Furniture; Growth in the Construction Industry; Other Drivers.
6. What are the notable trends driving market growth?
Laminates Segment to Dominate the Market.
7. Are there any restraints impacting market growth?
Decline in the Automotive Industry; Other Restraints.
8. Can you provide examples of recent developments in the market?
The recent developments about the major players in the market are being covered in the complete study.
9. What pricing options are available for accessing the report?
Pricing options include single-user, multi-user, and enterprise licenses priced at USD 3,950, USD 4,950, and USD 6,950 respectively.
10. Is the market size provided in terms of value or volume?
The market size is provided in terms of value, measured in million and volume, measured in K Tons.
11. Are there any specific market keywords associated with the report?
Yes, the market keyword associated with the report is "Melamine Formaldehyde Industry," which aids in identifying and referencing the specific market segment covered.
12. How do I determine which pricing option suits my needs best?
The pricing options vary based on user requirements and access needs. Individual users may opt for single-user licenses, while businesses requiring broader access may choose multi-user or enterprise licenses for cost-effective access to the report.
13. Are there any additional resources or data provided in the Melamine Formaldehyde Industry report?
While the report offers comprehensive insights, it's advisable to review the specific contents or supplementary materials provided to ascertain if additional resources or data are available.
14. How can I stay updated on further developments or reports in the Melamine Formaldehyde Industry?
To stay informed about further developments, trends, and reports in the Melamine Formaldehyde Industry, consider subscribing to industry newsletters, following relevant companies and organizations, or regularly checking reputable industry news sources and publications.
Methodology
Step 1 - Identification of Relevant Samples Size from Population Database


Step 2 - Approaches for Defining Global Market Size (Value, Volume* & Price*)

Note*: In applicable scenarios
Step 3 - Data Sources
Primary Research
- Web Analytics
- Survey Reports
- Research Institute
- Latest Research Reports
- Opinion Leaders
Secondary Research
- Annual Reports
- White Paper
- Latest Press Release
- Industry Association
- Paid Database
- Investor Presentations

Step 4 - Data Triangulation
Involves using different sources of information in order to increase the validity of a study
These sources are likely to be stakeholders in a program - participants, other researchers, program staff, other community members, and so on.
Then we put all data in single framework & apply various statistical tools to find out the dynamic on the market.
During the analysis stage, feedback from the stakeholder groups would be compared to determine areas of agreement as well as areas of divergence