

Key Insights
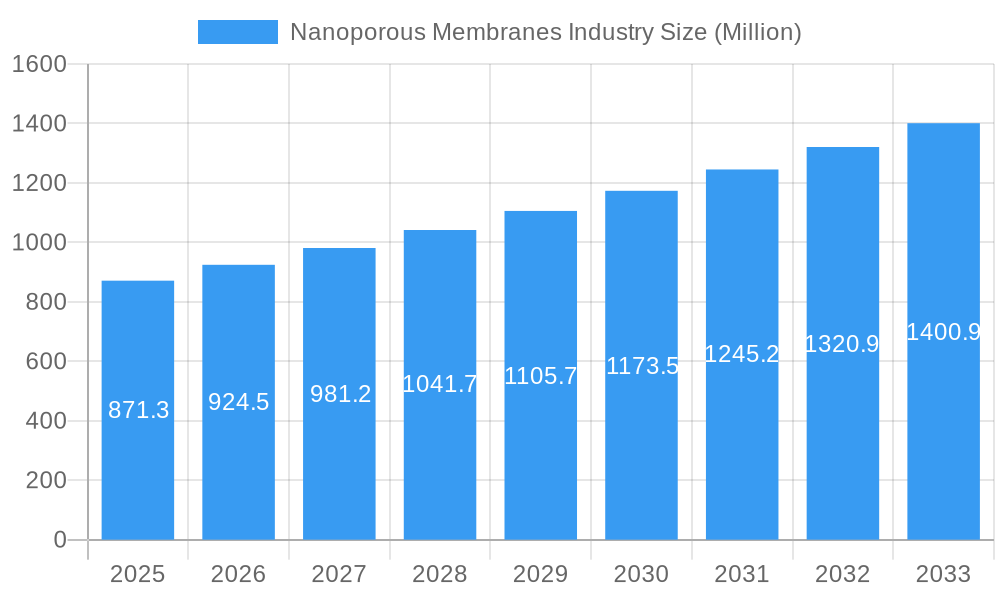
The nanoporous membranes market, valued at $871.3 million in 2025, is projected to experience robust growth, driven by increasing demand across diverse applications. A compound annual growth rate (CAGR) of 6% from 2025 to 2033 indicates a substantial market expansion. Key drivers include the rising need for advanced water purification technologies, particularly in regions facing water scarcity. The burgeoning fuel cell industry, seeking efficient and durable membrane materials, further fuels market growth. Furthermore, the expanding biomedical sector's reliance on nanoporous membranes for drug delivery and diagnostics contributes significantly to market expansion. The organic segment is expected to maintain a significant market share due to its biocompatibility and sustainability, although inorganic materials like ceramics, carbon nanotubes, and graphene are gaining traction owing to their enhanced performance in specific applications. The water treatment application segment currently dominates, but significant growth potential lies in fuel cells and biomedical applications. This market growth is partially tempered by challenges related to the high cost of manufacturing some advanced nanoporous membranes and the need for further research and development to enhance their performance and durability. Competition is intense, with established players like SUEZ Environnement SA and Koch Membrane Systems Inc. alongside emerging innovators driving innovation and expanding market reach. Geographic expansion is also a key growth factor, with North America and Asia-Pacific projected to lead the market due to their robust industrial sectors and increasing government investments in water infrastructure and renewable energy.
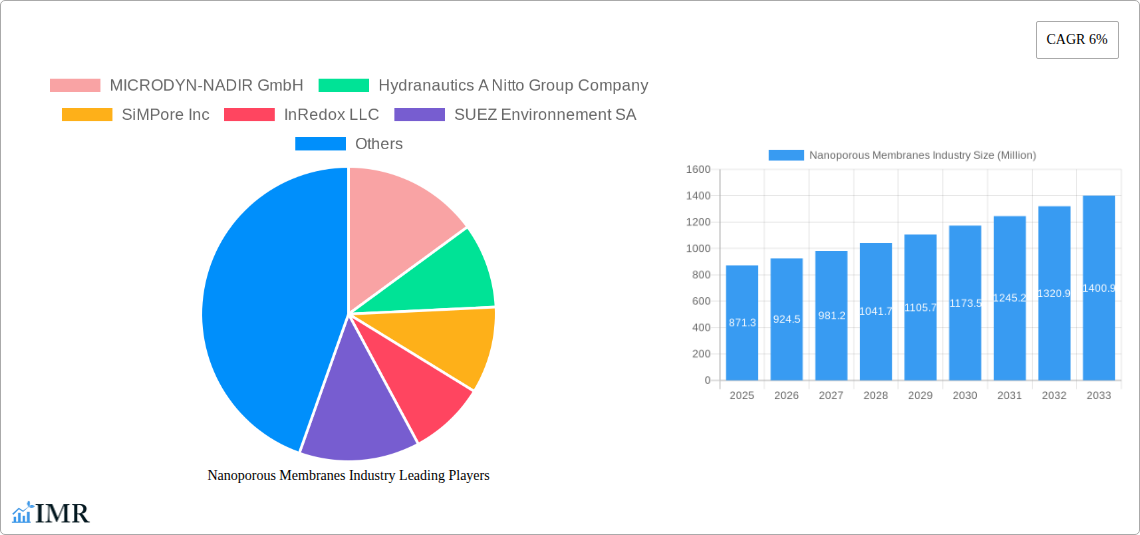
Nanoporous Membranes Industry Market Size (In Million)
The forecast period of 2025-2033 presents significant opportunities for both established and emerging players. Strategic collaborations, technological advancements, and targeted investments in research and development will be crucial for sustained success. Companies are focusing on developing cost-effective manufacturing processes and enhancing membrane performance characteristics to meet the evolving needs of various industries. The market is poised for continued expansion as the demand for efficient and sustainable separation and purification technologies continues to grow. The growing awareness of environmental concerns and the increasing regulatory focus on water quality further bolster market prospects for nanoporous membrane technologies in the coming years.
Nanoporous Membranes Industry Company Market Share
Nanoporous Membranes Industry: A Comprehensive Market Report (2019-2033)
This comprehensive report provides an in-depth analysis of the global nanoporous membranes market, encompassing market dynamics, growth trends, regional analysis, product landscape, and key players. The study period covers 2019-2033, with 2025 as the base and estimated year. The report forecasts market trends from 2025-2033, analyzing historical data from 2019-2024. The market is segmented by material type (Organic, Inorganic - Ceramics, Carbon Nanotubes, and Graphene, Hybrid) and application (Water Treatment, Fuel Cells, Biomedical, Food Processing, Other Applications). The total market value in 2025 is estimated at xx Million.
Nanoporous Membranes Industry Market Dynamics & Structure
The nanoporous membranes market is characterized by moderate concentration, with key players holding significant market share. Technological innovation, particularly in materials science and nanotechnology, is a major driver. Regulatory frameworks related to water treatment and environmental protection influence market growth. Competitive pressure exists from alternative filtration technologies. The end-user demographics are diverse, encompassing various industries. M&A activity has been relatively moderate in recent years, with xx deals recorded between 2019 and 2024.
- Market Concentration: Moderately concentrated, with top 5 players holding approximately xx% market share in 2025.
- Innovation Drivers: Advancements in nanomaterials, membrane fabrication techniques, and surface modification.
- Regulatory Landscape: Stringent environmental regulations drive adoption in water treatment and other sectors.
- Competitive Substitutes: Reverse osmosis, ultrafiltration, and other membrane technologies.
- End-User Demographics: Water treatment plants, pharmaceutical companies, chemical manufacturers, and fuel cell developers.
- M&A Trends: A moderate level of consolidation, with xx M&A deals observed during the historical period (2019-2024). Future M&A activity is expected to focus on expanding product portfolios and geographical reach.
Nanoporous Membranes Industry Growth Trends & Insights
The nanoporous membranes market exhibited a CAGR of xx% during the historical period (2019-2024), driven by increasing demand from water treatment, biomedical, and fuel cell applications. Market adoption is steadily growing, particularly in emerging economies with burgeoning industrialization and stricter environmental regulations. Technological disruptions, such as the development of novel nanomaterials and improved membrane fabrication techniques, are accelerating market growth. Consumer behavior shifts towards sustainable solutions are also positively impacting market adoption. The market is expected to maintain a CAGR of xx% from 2025 to 2033, reaching xx Million by 2033.
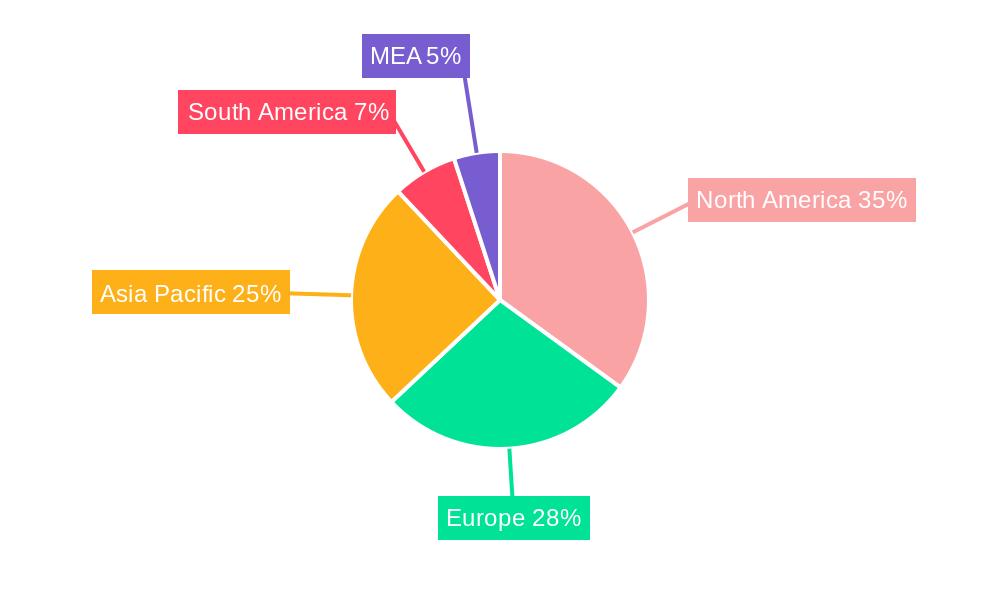
Dominant Regions, Countries, or Segments in Nanoporous Membranes Industry
North America currently holds the largest market share, driven by strong demand for water purification and robust technological advancements. Asia-Pacific is anticipated to exhibit the fastest growth rate due to rapid industrialization and increasing government investments in infrastructure. The water treatment segment is the largest application area, while inorganic materials (particularly ceramics and carbon nanotubes) dominate the material type segment.
- Key Drivers in North America: High environmental awareness, stringent regulations, and significant investments in water treatment infrastructure.
- Key Drivers in Asia-Pacific: Rapid industrialization, increasing population, and government initiatives to improve water quality.
- Market Share: North America (xx%), Asia-Pacific (xx%), Europe (xx%), Rest of World (xx%) in 2025.
- Growth Potential: Highest growth potential lies in Asia-Pacific driven by increasing demand for clean water and energy solutions.
Nanoporous Membranes Industry Product Landscape
Nanoporous membranes are characterized by varying pore sizes, surface modifications, and material compositions. Innovations focus on enhancing selectivity, permeability, and fouling resistance. Advancements in nanomaterials are enabling the development of membranes with enhanced performance metrics, leading to improved efficiency in water purification, gas separation, and biomedical applications. Unique selling propositions include superior filtration efficiency, extended lifespan, and reduced operational costs.
Key Drivers, Barriers & Challenges in Nanoporous Membranes Industry
Key Drivers: Growing demand for clean water, increasing energy needs, advancements in nanomaterials, and stringent environmental regulations.
Challenges: High manufacturing costs, limited scalability, and potential long-term fouling issues. Supply chain disruptions can affect the availability of raw materials, leading to price fluctuations. Regulatory hurdles in certain regions can slow down market penetration. Intense competition among existing players and the emergence of new entrants create pricing pressures.
Emerging Opportunities in Nanoporous Membranes Industry
Untapped markets in developing countries, increasing demand for advanced filtration in various industries, and the rising popularity of personalized medicine are significant opportunities. Innovative applications in areas such as gas separation, biosensors, and drug delivery systems are also opening up new avenues for growth. Evolving consumer preferences toward eco-friendly and sustainable solutions further boost market potential.
Growth Accelerators in the Nanoporous Membranes Industry Industry
Technological advancements, particularly in materials science and membrane fabrication, are key growth accelerators. Strategic partnerships and collaborations among industry players facilitate the development of innovative products. Market expansion strategies, including geographical diversification and penetration into new applications, are driving long-term growth.
Key Players Shaping the Nanoporous Membranes Industry Market
- MICRODYN-NADIR GmbH
- Hydranautics A Nitto Group Company
- SiMPore Inc
- InRedox LLC
- SUEZ Environnement SA
- Osmotech Membranes Pvt Ltd
- Hunan Keensen Technology Co Ltd
- Synder Filtration Inc
- AXEON Water Technologies Inc
- inopor GmbH
- BASF SE
- Toray Chemical Korea Inc
- DowDuPont Inc
- Koch Membrane Systems Inc
- SmartMembranes GmbH
- Applied Membranes Inc
- Alfa Laval AB
- Pure-Pro Water Corporation
Notable Milestones in Nanoporous Membranes Industry Sector
- 2020: Launch of a novel graphene-based nanoporous membrane by SiMPore Inc.
- 2022: Acquisition of a smaller membrane manufacturer by SUEZ Environnement SA.
- 2023: Development of a new ceramic membrane with enhanced fouling resistance by MICRODYN-NADIR GmbH.
- 2024: Introduction of a high-flux hybrid nanoporous membrane for water treatment by Koch Membrane Systems Inc.
In-Depth Nanoporous Membranes Industry Market Outlook
The nanoporous membranes market is poised for significant growth, driven by technological innovations, strategic partnerships, and expanding applications. Future market potential lies in emerging economies, with opportunities for market expansion and penetration into new sectors. Strategic alliances and investments in research and development will play a vital role in shaping the future of the industry. The focus will be on sustainable and cost-effective solutions, driving innovation and growth in the years to come.
Nanoporous Membranes Industry Segmentation
-
1. Material Type
- 1.1. Organic
- 1.2. Inorgani
- 1.3. Hybrid
-
2. Application
- 2.1. Water Treatment
- 2.2. Fuel Cells
- 2.3. Biomedical
- 2.4. Food Processing
- 2.5. Other Applications
Nanoporous Membranes Industry Segmentation By Geography
-
1. Asia Pacific
- 1.1. China
- 1.2. India
- 1.3. Japan
- 1.4. South Korea
- 1.5. ASEAN Countries
- 1.6. Rest of Asia Pacific
-
2. North America
- 2.1. United States
- 2.2. Canada
- 2.3. Rest of North America
-
3. Europe
- 3.1. Germany
- 3.2. United Kingdom
- 3.3. Italy
- 3.4. France
- 3.5. Spain
- 3.6. Rest of Europe
-
4. South America
- 4.1. Brazil
- 4.2. Argentina
- 4.3. Rest of South America
- 5. Middle East
-
6. Saudi Arabia
- 6.1. South Africa
- 6.2. Rest of Middle East
Nanoporous Membranes Industry Regional Market Share
Geographic Coverage of Nanoporous Membranes Industry
Nanoporous Membranes Industry REPORT HIGHLIGHTS
| Aspects | Details |
|---|---|
| Study Period | 2020-2034 |
| Base Year | 2025 |
| Estimated Year | 2026 |
| Forecast Period | 2026-2034 |
| Historical Period | 2020-2025 |
| Growth Rate | CAGR of 6% from 2020-2034 |
| Segmentation |
|
Table of Contents
- 1. Introduction
- 1.1. Research Scope
- 1.2. Market Segmentation
- 1.3. Research Objective
- 1.4. Definitions and Assumptions
- 2. Executive Summary
- 2.1. Market Snapshot
- 3. Market Dynamics
- 3.1. Market Drivers
- 3.2. Market Restrains
- 3.3. Market Trends
- 3.4. Market Opportunities
- 4. Market Factor Analysis
- 4.1. Porters Five Forces
- 4.1.1. Bargaining Power of Suppliers
- 4.1.2. Bargaining Power of Buyers
- 4.1.3. Threat of New Entrants
- 4.1.4. Threat of Substitutes
- 4.1.5. Competitive Rivalry
- 4.2. PESTEL analysis
- 4.3. BCG Analysis
- 4.3.1. Stars (High Growth, High Market Share)
- 4.3.2. Cash Cows (Low Growth, High Market Share)
- 4.3.3. Question Mark (High Growth, Low Market Share)
- 4.3.4. Dogs (Low Growth, Low Market Share)
- 4.4. Ansoff Matrix Analysis
- 4.5. Supply Chain Analysis
- 4.6. Regulatory Landscape
- 4.7. Current Market Potential and Opportunity Assessment (TAM–SAM–SOM Framework)
- 4.8. IMR Analyst Note
- 4.1. Porters Five Forces
- 5. Market Analysis, Insights and Forecast 2021-2033
- 5.1. Market Analysis, Insights and Forecast - by Material Type
- 5.1.1. Organic
- 5.1.2. Inorgani
- 5.1.3. Hybrid
- 5.2. Market Analysis, Insights and Forecast - by Application
- 5.2.1. Water Treatment
- 5.2.2. Fuel Cells
- 5.2.3. Biomedical
- 5.2.4. Food Processing
- 5.2.5. Other Applications
- 5.3. Market Analysis, Insights and Forecast - by Region
- 5.3.1. Asia Pacific
- 5.3.2. North America
- 5.3.3. Europe
- 5.3.4. South America
- 5.3.5. Middle East
- 5.3.6. Saudi Arabia
- 5.1. Market Analysis, Insights and Forecast - by Material Type
- 6. Global Nanoporous Membranes Industry Analysis, Insights and Forecast, 2021-2033
- 6.1. Market Analysis, Insights and Forecast - by Material Type
- 6.1.1. Organic
- 6.1.2. Inorgani
- 6.1.3. Hybrid
- 6.2. Market Analysis, Insights and Forecast - by Application
- 6.2.1. Water Treatment
- 6.2.2. Fuel Cells
- 6.2.3. Biomedical
- 6.2.4. Food Processing
- 6.2.5. Other Applications
- 6.1. Market Analysis, Insights and Forecast - by Material Type
- 7. Asia Pacific Nanoporous Membranes Industry Analysis, Insights and Forecast, 2020-2032
- 7.1. Market Analysis, Insights and Forecast - by Material Type
- 7.1.1. Organic
- 7.1.2. Inorgani
- 7.1.3. Hybrid
- 7.2. Market Analysis, Insights and Forecast - by Application
- 7.2.1. Water Treatment
- 7.2.2. Fuel Cells
- 7.2.3. Biomedical
- 7.2.4. Food Processing
- 7.2.5. Other Applications
- 7.1. Market Analysis, Insights and Forecast - by Material Type
- 8. North America Nanoporous Membranes Industry Analysis, Insights and Forecast, 2020-2032
- 8.1. Market Analysis, Insights and Forecast - by Material Type
- 8.1.1. Organic
- 8.1.2. Inorgani
- 8.1.3. Hybrid
- 8.2. Market Analysis, Insights and Forecast - by Application
- 8.2.1. Water Treatment
- 8.2.2. Fuel Cells
- 8.2.3. Biomedical
- 8.2.4. Food Processing
- 8.2.5. Other Applications
- 8.1. Market Analysis, Insights and Forecast - by Material Type
- 9. Europe Nanoporous Membranes Industry Analysis, Insights and Forecast, 2020-2032
- 9.1. Market Analysis, Insights and Forecast - by Material Type
- 9.1.1. Organic
- 9.1.2. Inorgani
- 9.1.3. Hybrid
- 9.2. Market Analysis, Insights and Forecast - by Application
- 9.2.1. Water Treatment
- 9.2.2. Fuel Cells
- 9.2.3. Biomedical
- 9.2.4. Food Processing
- 9.2.5. Other Applications
- 9.1. Market Analysis, Insights and Forecast - by Material Type
- 10. South America Nanoporous Membranes Industry Analysis, Insights and Forecast, 2020-2032
- 10.1. Market Analysis, Insights and Forecast - by Material Type
- 10.1.1. Organic
- 10.1.2. Inorgani
- 10.1.3. Hybrid
- 10.2. Market Analysis, Insights and Forecast - by Application
- 10.2.1. Water Treatment
- 10.2.2. Fuel Cells
- 10.2.3. Biomedical
- 10.2.4. Food Processing
- 10.2.5. Other Applications
- 10.1. Market Analysis, Insights and Forecast - by Material Type
- 11. Middle East Nanoporous Membranes Industry Analysis, Insights and Forecast, 2020-2032
- 11.1. Market Analysis, Insights and Forecast - by Material Type
- 11.1.1. Organic
- 11.1.2. Inorgani
- 11.1.3. Hybrid
- 11.2. Market Analysis, Insights and Forecast - by Application
- 11.2.1. Water Treatment
- 11.2.2. Fuel Cells
- 11.2.3. Biomedical
- 11.2.4. Food Processing
- 11.2.5. Other Applications
- 11.1. Market Analysis, Insights and Forecast - by Material Type
- 12. Saudi Arabia Nanoporous Membranes Industry Analysis, Insights and Forecast, 2020-2032
- 12.1. Market Analysis, Insights and Forecast - by Material Type
- 12.1.1. Organic
- 12.1.2. Inorgani
- 12.1.3. Hybrid
- 12.2. Market Analysis, Insights and Forecast - by Application
- 12.2.1. Water Treatment
- 12.2.2. Fuel Cells
- 12.2.3. Biomedical
- 12.2.4. Food Processing
- 12.2.5. Other Applications
- 12.1. Market Analysis, Insights and Forecast - by Material Type
- 13. Competitive Analysis
- 13.1. Company Profiles
- 13.1.1 MICRODYN-NADIR GmbH
- 13.1.1.1. Company Overview
- 13.1.1.2. Products
- 13.1.1.3. Company Financials
- 13.1.1.4. SWOT Analysis
- 13.1.2 Hydranautics A Nitto Group Company
- 13.1.2.1. Company Overview
- 13.1.2.2. Products
- 13.1.2.3. Company Financials
- 13.1.2.4. SWOT Analysis
- 13.1.3 SiMPore Inc
- 13.1.3.1. Company Overview
- 13.1.3.2. Products
- 13.1.3.3. Company Financials
- 13.1.3.4. SWOT Analysis
- 13.1.4 InRedox LLC
- 13.1.4.1. Company Overview
- 13.1.4.2. Products
- 13.1.4.3. Company Financials
- 13.1.4.4. SWOT Analysis
- 13.1.5 SUEZ Environnement SA
- 13.1.5.1. Company Overview
- 13.1.5.2. Products
- 13.1.5.3. Company Financials
- 13.1.5.4. SWOT Analysis
- 13.1.6 Osmotech Membranes Pvt Ltd
- 13.1.6.1. Company Overview
- 13.1.6.2. Products
- 13.1.6.3. Company Financials
- 13.1.6.4. SWOT Analysis
- 13.1.7 Hunan Keensen Technology Co Ltd
- 13.1.7.1. Company Overview
- 13.1.7.2. Products
- 13.1.7.3. Company Financials
- 13.1.7.4. SWOT Analysis
- 13.1.8 Synder Filtration Inc
- 13.1.8.1. Company Overview
- 13.1.8.2. Products
- 13.1.8.3. Company Financials
- 13.1.8.4. SWOT Analysis
- 13.1.9 AXEON Water Technologies Inc
- 13.1.9.1. Company Overview
- 13.1.9.2. Products
- 13.1.9.3. Company Financials
- 13.1.9.4. SWOT Analysis
- 13.1.10 inopor GmbH
- 13.1.10.1. Company Overview
- 13.1.10.2. Products
- 13.1.10.3. Company Financials
- 13.1.10.4. SWOT Analysis
- 13.1.11 BASF SE
- 13.1.11.1. Company Overview
- 13.1.11.2. Products
- 13.1.11.3. Company Financials
- 13.1.11.4. SWOT Analysis
- 13.1.12 Toray Chemical Korea Inc
- 13.1.12.1. Company Overview
- 13.1.12.2. Products
- 13.1.12.3. Company Financials
- 13.1.12.4. SWOT Analysis
- 13.1.13 DowDuPont Inc
- 13.1.13.1. Company Overview
- 13.1.13.2. Products
- 13.1.13.3. Company Financials
- 13.1.13.4. SWOT Analysis
- 13.1.14 Koch Membrane Systems Inc
- 13.1.14.1. Company Overview
- 13.1.14.2. Products
- 13.1.14.3. Company Financials
- 13.1.14.4. SWOT Analysis
- 13.1.15 SmartMembranes GmbH
- 13.1.15.1. Company Overview
- 13.1.15.2. Products
- 13.1.15.3. Company Financials
- 13.1.15.4. SWOT Analysis
- 13.1.16 Applied Membranes Inc
- 13.1.16.1. Company Overview
- 13.1.16.2. Products
- 13.1.16.3. Company Financials
- 13.1.16.4. SWOT Analysis
- 13.1.17 Alfa Laval AB
- 13.1.17.1. Company Overview
- 13.1.17.2. Products
- 13.1.17.3. Company Financials
- 13.1.17.4. SWOT Analysis
- 13.1.18 Pure-Pro Water Corporation
- 13.1.18.1. Company Overview
- 13.1.18.2. Products
- 13.1.18.3. Company Financials
- 13.1.18.4. SWOT Analysis
- 13.1.1 MICRODYN-NADIR GmbH
- 13.2. Market Entropy
- 13.2.1 Company's Key Areas Served
- 13.2.2 Recent Developments
- 13.3. Company Market Share Analysis 2025
- 13.3.1 Top 5 Companies Market Share Analysis
- 13.3.2 Top 3 Companies Market Share Analysis
- 13.4. List of Potential Customers
- 14. Research Methodology
List of Figures
- Figure 1: Global Nanoporous Membranes Industry Revenue Breakdown (Million, %) by Region 2025 & 2033
- Figure 2: Global Nanoporous Membranes Industry Volume Breakdown (K Units, %) by Region 2025 & 2033
- Figure 3: Asia Pacific Nanoporous Membranes Industry Revenue (Million), by Material Type 2025 & 2033
- Figure 4: Asia Pacific Nanoporous Membranes Industry Volume (K Units), by Material Type 2025 & 2033
- Figure 5: Asia Pacific Nanoporous Membranes Industry Revenue Share (%), by Material Type 2025 & 2033
- Figure 6: Asia Pacific Nanoporous Membranes Industry Volume Share (%), by Material Type 2025 & 2033
- Figure 7: Asia Pacific Nanoporous Membranes Industry Revenue (Million), by Application 2025 & 2033
- Figure 8: Asia Pacific Nanoporous Membranes Industry Volume (K Units), by Application 2025 & 2033
- Figure 9: Asia Pacific Nanoporous Membranes Industry Revenue Share (%), by Application 2025 & 2033
- Figure 10: Asia Pacific Nanoporous Membranes Industry Volume Share (%), by Application 2025 & 2033
- Figure 11: Asia Pacific Nanoporous Membranes Industry Revenue (Million), by Country 2025 & 2033
- Figure 12: Asia Pacific Nanoporous Membranes Industry Volume (K Units), by Country 2025 & 2033
- Figure 13: Asia Pacific Nanoporous Membranes Industry Revenue Share (%), by Country 2025 & 2033
- Figure 14: Asia Pacific Nanoporous Membranes Industry Volume Share (%), by Country 2025 & 2033
- Figure 15: North America Nanoporous Membranes Industry Revenue (Million), by Material Type 2025 & 2033
- Figure 16: North America Nanoporous Membranes Industry Volume (K Units), by Material Type 2025 & 2033
- Figure 17: North America Nanoporous Membranes Industry Revenue Share (%), by Material Type 2025 & 2033
- Figure 18: North America Nanoporous Membranes Industry Volume Share (%), by Material Type 2025 & 2033
- Figure 19: North America Nanoporous Membranes Industry Revenue (Million), by Application 2025 & 2033
- Figure 20: North America Nanoporous Membranes Industry Volume (K Units), by Application 2025 & 2033
- Figure 21: North America Nanoporous Membranes Industry Revenue Share (%), by Application 2025 & 2033
- Figure 22: North America Nanoporous Membranes Industry Volume Share (%), by Application 2025 & 2033
- Figure 23: North America Nanoporous Membranes Industry Revenue (Million), by Country 2025 & 2033
- Figure 24: North America Nanoporous Membranes Industry Volume (K Units), by Country 2025 & 2033
- Figure 25: North America Nanoporous Membranes Industry Revenue Share (%), by Country 2025 & 2033
- Figure 26: North America Nanoporous Membranes Industry Volume Share (%), by Country 2025 & 2033
- Figure 27: Europe Nanoporous Membranes Industry Revenue (Million), by Material Type 2025 & 2033
- Figure 28: Europe Nanoporous Membranes Industry Volume (K Units), by Material Type 2025 & 2033
- Figure 29: Europe Nanoporous Membranes Industry Revenue Share (%), by Material Type 2025 & 2033
- Figure 30: Europe Nanoporous Membranes Industry Volume Share (%), by Material Type 2025 & 2033
- Figure 31: Europe Nanoporous Membranes Industry Revenue (Million), by Application 2025 & 2033
- Figure 32: Europe Nanoporous Membranes Industry Volume (K Units), by Application 2025 & 2033
- Figure 33: Europe Nanoporous Membranes Industry Revenue Share (%), by Application 2025 & 2033
- Figure 34: Europe Nanoporous Membranes Industry Volume Share (%), by Application 2025 & 2033
- Figure 35: Europe Nanoporous Membranes Industry Revenue (Million), by Country 2025 & 2033
- Figure 36: Europe Nanoporous Membranes Industry Volume (K Units), by Country 2025 & 2033
- Figure 37: Europe Nanoporous Membranes Industry Revenue Share (%), by Country 2025 & 2033
- Figure 38: Europe Nanoporous Membranes Industry Volume Share (%), by Country 2025 & 2033
- Figure 39: South America Nanoporous Membranes Industry Revenue (Million), by Material Type 2025 & 2033
- Figure 40: South America Nanoporous Membranes Industry Volume (K Units), by Material Type 2025 & 2033
- Figure 41: South America Nanoporous Membranes Industry Revenue Share (%), by Material Type 2025 & 2033
- Figure 42: South America Nanoporous Membranes Industry Volume Share (%), by Material Type 2025 & 2033
- Figure 43: South America Nanoporous Membranes Industry Revenue (Million), by Application 2025 & 2033
- Figure 44: South America Nanoporous Membranes Industry Volume (K Units), by Application 2025 & 2033
- Figure 45: South America Nanoporous Membranes Industry Revenue Share (%), by Application 2025 & 2033
- Figure 46: South America Nanoporous Membranes Industry Volume Share (%), by Application 2025 & 2033
- Figure 47: South America Nanoporous Membranes Industry Revenue (Million), by Country 2025 & 2033
- Figure 48: South America Nanoporous Membranes Industry Volume (K Units), by Country 2025 & 2033
- Figure 49: South America Nanoporous Membranes Industry Revenue Share (%), by Country 2025 & 2033
- Figure 50: South America Nanoporous Membranes Industry Volume Share (%), by Country 2025 & 2033
- Figure 51: Middle East Nanoporous Membranes Industry Revenue (Million), by Material Type 2025 & 2033
- Figure 52: Middle East Nanoporous Membranes Industry Volume (K Units), by Material Type 2025 & 2033
- Figure 53: Middle East Nanoporous Membranes Industry Revenue Share (%), by Material Type 2025 & 2033
- Figure 54: Middle East Nanoporous Membranes Industry Volume Share (%), by Material Type 2025 & 2033
- Figure 55: Middle East Nanoporous Membranes Industry Revenue (Million), by Application 2025 & 2033
- Figure 56: Middle East Nanoporous Membranes Industry Volume (K Units), by Application 2025 & 2033
- Figure 57: Middle East Nanoporous Membranes Industry Revenue Share (%), by Application 2025 & 2033
- Figure 58: Middle East Nanoporous Membranes Industry Volume Share (%), by Application 2025 & 2033
- Figure 59: Middle East Nanoporous Membranes Industry Revenue (Million), by Country 2025 & 2033
- Figure 60: Middle East Nanoporous Membranes Industry Volume (K Units), by Country 2025 & 2033
- Figure 61: Middle East Nanoporous Membranes Industry Revenue Share (%), by Country 2025 & 2033
- Figure 62: Middle East Nanoporous Membranes Industry Volume Share (%), by Country 2025 & 2033
- Figure 63: Saudi Arabia Nanoporous Membranes Industry Revenue (Million), by Material Type 2025 & 2033
- Figure 64: Saudi Arabia Nanoporous Membranes Industry Volume (K Units), by Material Type 2025 & 2033
- Figure 65: Saudi Arabia Nanoporous Membranes Industry Revenue Share (%), by Material Type 2025 & 2033
- Figure 66: Saudi Arabia Nanoporous Membranes Industry Volume Share (%), by Material Type 2025 & 2033
- Figure 67: Saudi Arabia Nanoporous Membranes Industry Revenue (Million), by Application 2025 & 2033
- Figure 68: Saudi Arabia Nanoporous Membranes Industry Volume (K Units), by Application 2025 & 2033
- Figure 69: Saudi Arabia Nanoporous Membranes Industry Revenue Share (%), by Application 2025 & 2033
- Figure 70: Saudi Arabia Nanoporous Membranes Industry Volume Share (%), by Application 2025 & 2033
- Figure 71: Saudi Arabia Nanoporous Membranes Industry Revenue (Million), by Country 2025 & 2033
- Figure 72: Saudi Arabia Nanoporous Membranes Industry Volume (K Units), by Country 2025 & 2033
- Figure 73: Saudi Arabia Nanoporous Membranes Industry Revenue Share (%), by Country 2025 & 2033
- Figure 74: Saudi Arabia Nanoporous Membranes Industry Volume Share (%), by Country 2025 & 2033
List of Tables
- Table 1: Global Nanoporous Membranes Industry Revenue Million Forecast, by Material Type 2020 & 2033
- Table 2: Global Nanoporous Membranes Industry Volume K Units Forecast, by Material Type 2020 & 2033
- Table 3: Global Nanoporous Membranes Industry Revenue Million Forecast, by Application 2020 & 2033
- Table 4: Global Nanoporous Membranes Industry Volume K Units Forecast, by Application 2020 & 2033
- Table 5: Global Nanoporous Membranes Industry Revenue Million Forecast, by Region 2020 & 2033
- Table 6: Global Nanoporous Membranes Industry Volume K Units Forecast, by Region 2020 & 2033
- Table 7: Global Nanoporous Membranes Industry Revenue Million Forecast, by Material Type 2020 & 2033
- Table 8: Global Nanoporous Membranes Industry Volume K Units Forecast, by Material Type 2020 & 2033
- Table 9: Global Nanoporous Membranes Industry Revenue Million Forecast, by Application 2020 & 2033
- Table 10: Global Nanoporous Membranes Industry Volume K Units Forecast, by Application 2020 & 2033
- Table 11: Global Nanoporous Membranes Industry Revenue Million Forecast, by Country 2020 & 2033
- Table 12: Global Nanoporous Membranes Industry Volume K Units Forecast, by Country 2020 & 2033
- Table 13: China Nanoporous Membranes Industry Revenue (Million) Forecast, by Application 2020 & 2033
- Table 14: China Nanoporous Membranes Industry Volume (K Units) Forecast, by Application 2020 & 2033
- Table 15: India Nanoporous Membranes Industry Revenue (Million) Forecast, by Application 2020 & 2033
- Table 16: India Nanoporous Membranes Industry Volume (K Units) Forecast, by Application 2020 & 2033
- Table 17: Japan Nanoporous Membranes Industry Revenue (Million) Forecast, by Application 2020 & 2033
- Table 18: Japan Nanoporous Membranes Industry Volume (K Units) Forecast, by Application 2020 & 2033
- Table 19: South Korea Nanoporous Membranes Industry Revenue (Million) Forecast, by Application 2020 & 2033
- Table 20: South Korea Nanoporous Membranes Industry Volume (K Units) Forecast, by Application 2020 & 2033
- Table 21: ASEAN Countries Nanoporous Membranes Industry Revenue (Million) Forecast, by Application 2020 & 2033
- Table 22: ASEAN Countries Nanoporous Membranes Industry Volume (K Units) Forecast, by Application 2020 & 2033
- Table 23: Rest of Asia Pacific Nanoporous Membranes Industry Revenue (Million) Forecast, by Application 2020 & 2033
- Table 24: Rest of Asia Pacific Nanoporous Membranes Industry Volume (K Units) Forecast, by Application 2020 & 2033
- Table 25: Global Nanoporous Membranes Industry Revenue Million Forecast, by Material Type 2020 & 2033
- Table 26: Global Nanoporous Membranes Industry Volume K Units Forecast, by Material Type 2020 & 2033
- Table 27: Global Nanoporous Membranes Industry Revenue Million Forecast, by Application 2020 & 2033
- Table 28: Global Nanoporous Membranes Industry Volume K Units Forecast, by Application 2020 & 2033
- Table 29: Global Nanoporous Membranes Industry Revenue Million Forecast, by Country 2020 & 2033
- Table 30: Global Nanoporous Membranes Industry Volume K Units Forecast, by Country 2020 & 2033
- Table 31: United States Nanoporous Membranes Industry Revenue (Million) Forecast, by Application 2020 & 2033
- Table 32: United States Nanoporous Membranes Industry Volume (K Units) Forecast, by Application 2020 & 2033
- Table 33: Canada Nanoporous Membranes Industry Revenue (Million) Forecast, by Application 2020 & 2033
- Table 34: Canada Nanoporous Membranes Industry Volume (K Units) Forecast, by Application 2020 & 2033
- Table 35: Rest of North America Nanoporous Membranes Industry Revenue (Million) Forecast, by Application 2020 & 2033
- Table 36: Rest of North America Nanoporous Membranes Industry Volume (K Units) Forecast, by Application 2020 & 2033
- Table 37: Global Nanoporous Membranes Industry Revenue Million Forecast, by Material Type 2020 & 2033
- Table 38: Global Nanoporous Membranes Industry Volume K Units Forecast, by Material Type 2020 & 2033
- Table 39: Global Nanoporous Membranes Industry Revenue Million Forecast, by Application 2020 & 2033
- Table 40: Global Nanoporous Membranes Industry Volume K Units Forecast, by Application 2020 & 2033
- Table 41: Global Nanoporous Membranes Industry Revenue Million Forecast, by Country 2020 & 2033
- Table 42: Global Nanoporous Membranes Industry Volume K Units Forecast, by Country 2020 & 2033
- Table 43: Germany Nanoporous Membranes Industry Revenue (Million) Forecast, by Application 2020 & 2033
- Table 44: Germany Nanoporous Membranes Industry Volume (K Units) Forecast, by Application 2020 & 2033
- Table 45: United Kingdom Nanoporous Membranes Industry Revenue (Million) Forecast, by Application 2020 & 2033
- Table 46: United Kingdom Nanoporous Membranes Industry Volume (K Units) Forecast, by Application 2020 & 2033
- Table 47: Italy Nanoporous Membranes Industry Revenue (Million) Forecast, by Application 2020 & 2033
- Table 48: Italy Nanoporous Membranes Industry Volume (K Units) Forecast, by Application 2020 & 2033
- Table 49: France Nanoporous Membranes Industry Revenue (Million) Forecast, by Application 2020 & 2033
- Table 50: France Nanoporous Membranes Industry Volume (K Units) Forecast, by Application 2020 & 2033
- Table 51: Spain Nanoporous Membranes Industry Revenue (Million) Forecast, by Application 2020 & 2033
- Table 52: Spain Nanoporous Membranes Industry Volume (K Units) Forecast, by Application 2020 & 2033
- Table 53: Rest of Europe Nanoporous Membranes Industry Revenue (Million) Forecast, by Application 2020 & 2033
- Table 54: Rest of Europe Nanoporous Membranes Industry Volume (K Units) Forecast, by Application 2020 & 2033
- Table 55: Global Nanoporous Membranes Industry Revenue Million Forecast, by Material Type 2020 & 2033
- Table 56: Global Nanoporous Membranes Industry Volume K Units Forecast, by Material Type 2020 & 2033
- Table 57: Global Nanoporous Membranes Industry Revenue Million Forecast, by Application 2020 & 2033
- Table 58: Global Nanoporous Membranes Industry Volume K Units Forecast, by Application 2020 & 2033
- Table 59: Global Nanoporous Membranes Industry Revenue Million Forecast, by Country 2020 & 2033
- Table 60: Global Nanoporous Membranes Industry Volume K Units Forecast, by Country 2020 & 2033
- Table 61: Brazil Nanoporous Membranes Industry Revenue (Million) Forecast, by Application 2020 & 2033
- Table 62: Brazil Nanoporous Membranes Industry Volume (K Units) Forecast, by Application 2020 & 2033
- Table 63: Argentina Nanoporous Membranes Industry Revenue (Million) Forecast, by Application 2020 & 2033
- Table 64: Argentina Nanoporous Membranes Industry Volume (K Units) Forecast, by Application 2020 & 2033
- Table 65: Rest of South America Nanoporous Membranes Industry Revenue (Million) Forecast, by Application 2020 & 2033
- Table 66: Rest of South America Nanoporous Membranes Industry Volume (K Units) Forecast, by Application 2020 & 2033
- Table 67: Global Nanoporous Membranes Industry Revenue Million Forecast, by Material Type 2020 & 2033
- Table 68: Global Nanoporous Membranes Industry Volume K Units Forecast, by Material Type 2020 & 2033
- Table 69: Global Nanoporous Membranes Industry Revenue Million Forecast, by Application 2020 & 2033
- Table 70: Global Nanoporous Membranes Industry Volume K Units Forecast, by Application 2020 & 2033
- Table 71: Global Nanoporous Membranes Industry Revenue Million Forecast, by Country 2020 & 2033
- Table 72: Global Nanoporous Membranes Industry Volume K Units Forecast, by Country 2020 & 2033
- Table 73: Global Nanoporous Membranes Industry Revenue Million Forecast, by Material Type 2020 & 2033
- Table 74: Global Nanoporous Membranes Industry Volume K Units Forecast, by Material Type 2020 & 2033
- Table 75: Global Nanoporous Membranes Industry Revenue Million Forecast, by Application 2020 & 2033
- Table 76: Global Nanoporous Membranes Industry Volume K Units Forecast, by Application 2020 & 2033
- Table 77: Global Nanoporous Membranes Industry Revenue Million Forecast, by Country 2020 & 2033
- Table 78: Global Nanoporous Membranes Industry Volume K Units Forecast, by Country 2020 & 2033
- Table 79: South Africa Nanoporous Membranes Industry Revenue (Million) Forecast, by Application 2020 & 2033
- Table 80: South Africa Nanoporous Membranes Industry Volume (K Units) Forecast, by Application 2020 & 2033
- Table 81: Rest of Middle East Nanoporous Membranes Industry Revenue (Million) Forecast, by Application 2020 & 2033
- Table 82: Rest of Middle East Nanoporous Membranes Industry Volume (K Units) Forecast, by Application 2020 & 2033
Frequently Asked Questions
1. What is the projected Compound Annual Growth Rate (CAGR) of the Nanoporous Membranes Industry?
The projected CAGR is approximately 6%.
2. Which companies are prominent players in the Nanoporous Membranes Industry?
Key companies in the market include MICRODYN-NADIR GmbH, Hydranautics A Nitto Group Company, SiMPore Inc, InRedox LLC, SUEZ Environnement SA, Osmotech Membranes Pvt Ltd, Hunan Keensen Technology Co Ltd, Synder Filtration Inc, AXEON Water Technologies Inc, inopor GmbH, BASF SE, Toray Chemical Korea Inc, DowDuPont Inc, Koch Membrane Systems Inc, SmartMembranes GmbH, Applied Membranes Inc, Alfa Laval AB, Pure-Pro Water Corporation.
3. What are the main segments of the Nanoporous Membranes Industry?
The market segments include Material Type, Application.
4. Can you provide details about the market size?
The market size is estimated to be USD 871.3 Million as of 2022.
5. What are some drivers contributing to market growth?
; Growing Need to Treat Wastewater; Rising Water Desalination Activities.
6. What are the notable trends driving market growth?
Growing Demand from Water Treatment Application.
7. Are there any restraints impacting market growth?
; Low Adoption in the Developing Countries; Poor Fouling Resistance of Nanoporous Membranes; Supply Deficiency of Nanomaterials.
8. Can you provide examples of recent developments in the market?
N/A
9. What pricing options are available for accessing the report?
Pricing options include single-user, multi-user, and enterprise licenses priced at USD 4750, USD 5250, and USD 8750 respectively.
10. Is the market size provided in terms of value or volume?
The market size is provided in terms of value, measured in Million and volume, measured in K Units.
11. Are there any specific market keywords associated with the report?
Yes, the market keyword associated with the report is "Nanoporous Membranes Industry," which aids in identifying and referencing the specific market segment covered.
12. How do I determine which pricing option suits my needs best?
The pricing options vary based on user requirements and access needs. Individual users may opt for single-user licenses, while businesses requiring broader access may choose multi-user or enterprise licenses for cost-effective access to the report.
13. Are there any additional resources or data provided in the Nanoporous Membranes Industry report?
While the report offers comprehensive insights, it's advisable to review the specific contents or supplementary materials provided to ascertain if additional resources or data are available.
14. How can I stay updated on further developments or reports in the Nanoporous Membranes Industry?
To stay informed about further developments, trends, and reports in the Nanoporous Membranes Industry, consider subscribing to industry newsletters, following relevant companies and organizations, or regularly checking reputable industry news sources and publications.
Methodology
Step 1 - Identification of Relevant Samples Size from Population Database


Step 2 - Approaches for Defining Global Market Size (Value, Volume* & Price*)

Note*: In applicable scenarios
Step 3 - Data Sources
Primary Research
- Web Analytics
- Survey Reports
- Research Institute
- Latest Research Reports
- Opinion Leaders
Secondary Research
- Annual Reports
- White Paper
- Latest Press Release
- Industry Association
- Paid Database
- Investor Presentations

Step 4 - Data Triangulation
Involves using different sources of information in order to increase the validity of a study
These sources are likely to be stakeholders in a program - participants, other researchers, program staff, other community members, and so on.
Then we put all data in single framework & apply various statistical tools to find out the dynamic on the market.
During the analysis stage, feedback from the stakeholder groups would be compared to determine areas of agreement as well as areas of divergence