

Key Insights
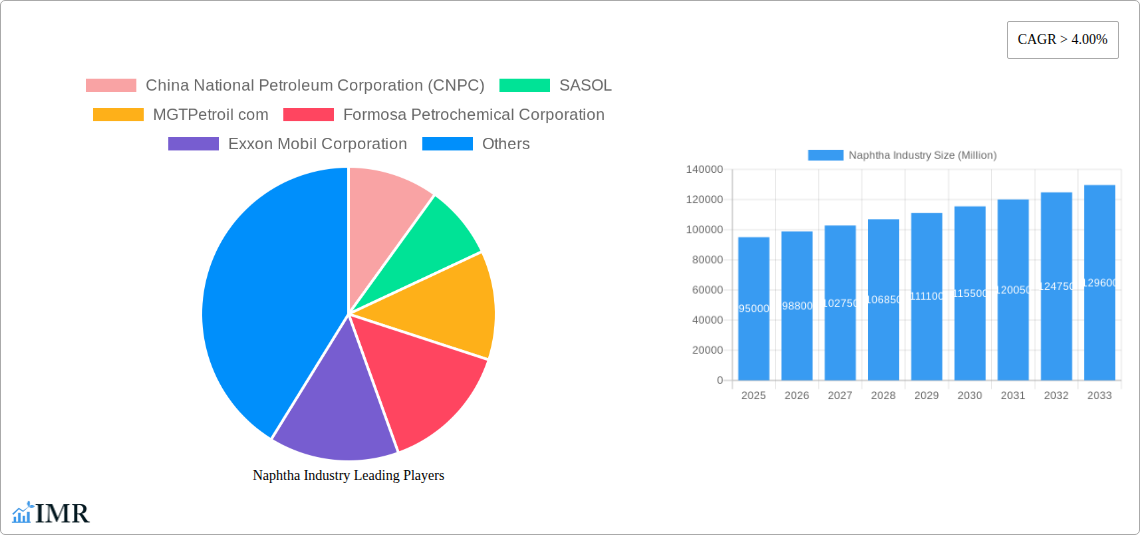
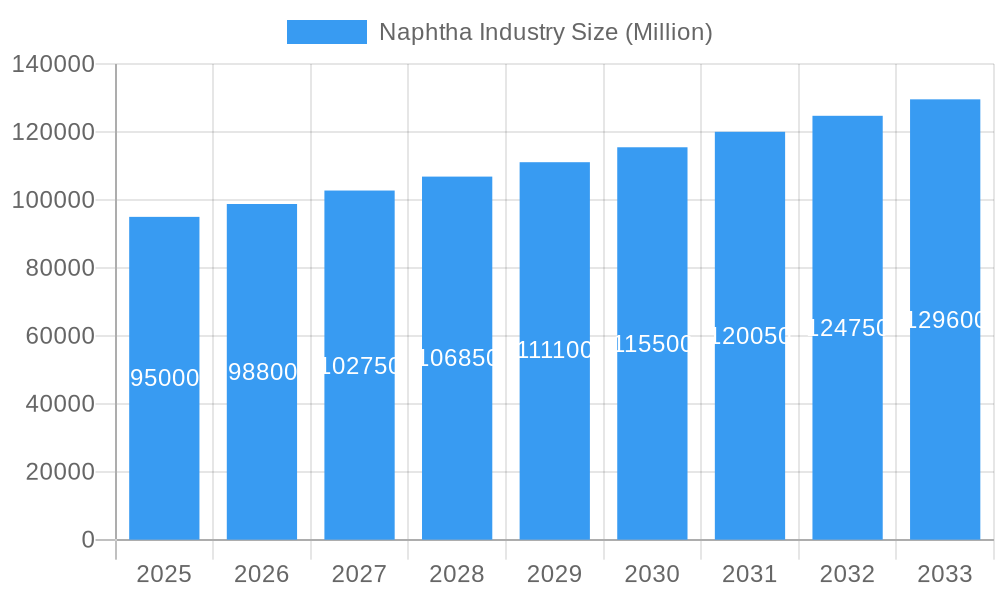
The global Naphtha market is poised for robust expansion, projected to reach a significant market size of approximately USD 95,000 million by 2025, with a Compound Annual Growth Rate (CAGR) exceeding 4.00% through 2033. This growth is primarily fueled by the burgeoning demand from the petrochemical sector, where naphtha serves as a crucial feedstock for the production of olefins like ethylene and propylene, essential building blocks for plastics, synthetic fibers, and other vital materials. The escalating global population and increasing disposable incomes worldwide are driving higher consumption of these downstream products, directly translating into sustained demand for naphtha. Furthermore, the paints and coatings industry, as well as the agriculture sector, are contributing to market growth through their increasing reliance on naphtha-derived solvents and agrochemicals. While the market demonstrates strong upward momentum, potential restraints such as fluctuating crude oil prices, which directly impact naphtha production costs, and increasing environmental regulations could pose challenges to sustained, unhindered growth. However, strategic investments in advanced refining technologies and the development of alternative feedstock sources are expected to mitigate these concerns.
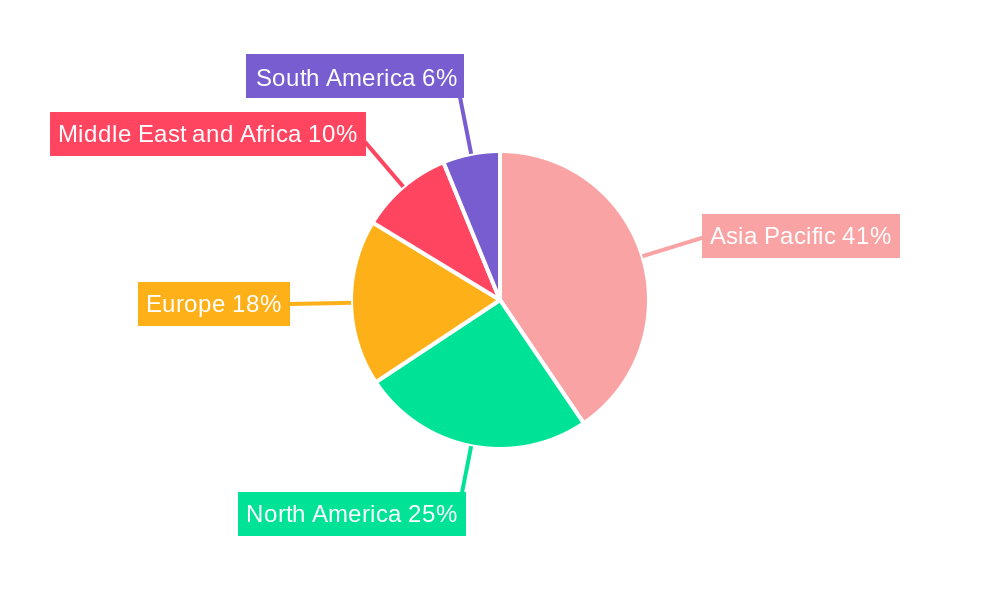
Naphtha Industry Market Size (In Billion)
The market segmentation reveals a clear dominance of the petrochemical industry as the primary end-user, underscoring its pivotal role in the naphtha value chain. Within the naphtha types, both light and heavy naphtha find significant applications, catering to diverse petrochemical processes. Geographically, the Asia Pacific region, led by China and India, is expected to emerge as the largest and fastest-growing market due to rapid industrialization, expanding manufacturing capabilities, and a growing consumer base. North America and Europe also represent substantial markets, driven by established petrochemical infrastructure and demand for high-value chemical derivatives. Middle East and Africa, with its abundant crude oil reserves and increasing downstream investments, is another region exhibiting promising growth potential. Key players such as China National Petroleum Corporation (CNPC), SASOL, Exxon Mobil Corporation, and Saudi Aramco are actively investing in capacity expansions and technological advancements to capitalize on these market opportunities, further solidifying the global naphtha landscape.
Naphtha Industry Company Market Share
This comprehensive report offers an in-depth analysis of the global naphtha industry, covering market dynamics, growth trajectories, regional dominance, product innovations, key players, and future opportunities. The report is structured to provide actionable insights for industry stakeholders, including manufacturers, suppliers, investors, and policymakers. The study spans from 2019 to 2033, with a base year of 2025 and a forecast period of 2025–2033. All monetary values are presented in Million units.
Naphtha Industry Market Dynamics & Structure
The naphtha industry is characterized by a moderately concentrated market structure, driven by the significant capital investments required for production facilities and the presence of a few dominant global players. Technological innovation remains a key differentiator, with ongoing advancements in refining processes and the development of specialized naphtha grades for diverse applications. Regulatory frameworks, particularly concerning environmental standards and emissions, significantly influence production methods and feedstock choices. The competitive landscape includes a range of product substitutes, primarily natural gas liquids (NGLs) and other refined petroleum products, which can impact naphtha demand based on price volatility and availability. End-user demographics are shifting, with a growing demand from burgeoning petrochemical sectors in Asia and increasing adoption in niche applications like advanced materials. Mergers and acquisitions (M&A) activity, while not excessively high, often involves strategic consolidations to enhance market share, secure feedstock access, and expand geographical reach. For instance, the recent consolidation of upstream and downstream operations by major oil and gas companies underscores this trend. Innovation barriers include the high cost of research and development for new refining technologies and the lengthy approval processes for new product applications. Market share percentages for leading companies are closely guarded, but industry estimates suggest that players like Saudi Aramco and CNPC command substantial portions of the global supply.
- Market Concentration: Dominated by integrated oil and gas companies and large petrochemical producers.
- Technological Innovation Drivers: Advancements in cracking technologies, catalyst development, and feedstock optimization.
- Regulatory Frameworks: Stringent environmental regulations and emissions standards influencing production processes.
- Competitive Product Substitutes: Natural Gas Liquids (NGLs), LPG, and other refined petroleum fractions.
- End-User Demographics: Growing demand from the petrochemical sector, particularly in emerging economies.
- M&A Trends: Strategic acquisitions focused on feedstock security, vertical integration, and market expansion.
- Example: Recent multi-billion-dollar investments in new chemical complexes signify strategic expansion.
Naphtha Industry Growth Trends & Insights
The global naphtha market is projected to witness robust growth over the forecast period (2025–2033), driven by escalating demand from the petrochemical industry, particularly for the production of olefins like ethylene and propylene, which are fundamental building blocks for plastics and synthetic fibers. The market size is estimated to reach USD $XXX Million by 2033, exhibiting a Compound Annual Growth Rate (CAGR) of approximately X.XX% from the base year 2025. Adoption rates for naphtha as a primary feedstock in new petrochemical projects remain high, especially in regions with significant refining capacities and proximity to end-user markets. Technological disruptions, such as the development of more efficient steam crackers and the increasing utilization of lighter feedstocks, are continuously reshaping the industry landscape. Consumer behavior shifts, characterized by a growing global demand for consumer goods, packaging materials, and automotive components, directly translate into higher naphtha consumption. Market penetration of naphtha derivatives is expanding, fueled by economic development and increasing disposable incomes in emerging economies. The interplay between crude oil prices, the availability of alternative feedstocks, and geopolitical factors will continue to influence market dynamics. Insights from our research indicate that while traditional end-use sectors remain strong, the emergence of novel applications in advanced materials and specialty chemicals presents significant future growth potential. The continuous optimization of refinery operations to maximize naphtha yields is a key trend, impacting overall supply and price stability.
Dominant Regions, Countries, or Segments in Naphtha Industry
The Petrochemical end-user industry is unequivocally the dominant segment driving growth in the global naphtha market. This segment's dominance is attributed to its intrinsic reliance on naphtha as a primary feedstock for producing essential olefins like ethylene and propylene. These olefins, in turn, are the foundational components for a vast array of plastics, resins, and synthetic fibers that permeate almost every aspect of modern life, from packaging and automotive components to textiles and construction materials. The burgeoning demand for these downstream products, particularly in rapidly industrializing economies across Asia-Pacific, has propelled the petrochemical sector to the forefront of naphtha consumption.
Within the Asia-Pacific region, countries like China and India stand out as major drivers of naphtha demand. China, with its vast refining infrastructure and massive petrochemical industry, is the world's largest consumer and producer of naphtha derivatives. Significant investments by companies like PetroChina Company Limited and China National Petroleum Corporation (CNPC) in expanding their petrochemical capacities underscore this dominance. The country's economic growth and increasing domestic consumption of consumer goods directly fuel the demand for naphtha. India, another rapidly growing economy, is also witnessing substantial investments in its petrochemical sector, driven by government initiatives and a large, young population. Reliance Industries Limited is a prime example of a company significantly contributing to India's petrochemical expansion.
- Dominant Segment: Petrochemical Industry.
- Key Drivers: Production of ethylene, propylene, and other olefins for plastics, synthetic fibers, and resins.
- Market Share: Accounts for over 70% of global naphtha consumption.
- Dominant Region: Asia-Pacific.
- Key Countries: China, India, South Korea, and Southeast Asian nations.
- Growth Potential: Driven by industrialization, urbanization, and increasing consumer spending.
- Market Share: Estimated to hold over 55% of the global naphtha market.
- Dominant Countries (within Asia-Pacific):
- China: Largest consumer and producer, supported by major players like Sinopec and CNPC.
- Key Drivers: Massive domestic demand, extensive refining capacity, and strategic investments.
- India: Rapidly expanding petrochemical sector, with companies like Reliance Industries Limited leading the charge.
- Key Drivers: Government support, growing middle class, and demand for downstream products.
- China: Largest consumer and producer, supported by major players like Sinopec and CNPC.
The Light Naphtha type also plays a crucial role due to its higher yield of valuable olefins in steam crackers compared to heavy naphtha, making it the preferred feedstock for many petrochemical operations. However, heavy naphtha remains important as a blending component in gasoline and as a feedstock for aromatics production.
Naphtha Industry Product Landscape
The naphtha product landscape is characterized by continuous innovation in refining processes and product specifications to meet evolving end-user demands. Light Naphtha, with its higher paraffin content, is primarily favored for its superior yield of ethylene and other light olefins in steam cracking, making it a cornerstone for the petrochemical industry. Heavy Naphtha, rich in naphthenes and aromatics, finds significant application in gasoline blending for octane enhancement and as a feedstock for aromatics production, crucial for the synthesis of various chemicals and materials. Innovations are focused on improving the efficiency of naphtha production, enhancing its quality for specific applications, and developing more sustainable refining practices. Technological advancements in catalytic reforming and isomerization processes are critical in optimizing the yield and composition of naphtha grades. Performance metrics such as octane number, aromatics content, and sulfur levels are rigorously controlled to meet stringent industry standards and environmental regulations. The unique selling proposition of specialized naphtha grades lies in their tailored compositions that maximize efficiency and product yields for particular downstream chemical synthesis or fuel blending requirements.
Key Drivers, Barriers & Challenges in Naphtha Industry
Key Drivers:
- Growing Petrochemical Demand: Escalating global demand for plastics, synthetic fibers, and other petrochemical derivatives is the primary growth engine.
- Economic Growth in Emerging Markets: Industrialization and rising disposable incomes in Asia, Africa, and Latin America are boosting consumption.
- Technological Advancements: Improved refining technologies enhancing naphtha yield and quality.
- Limited Viable Alternatives: For many core petrochemical processes, naphtha remains a cost-effective and readily available feedstock.
Key Barriers & Challenges:
- Crude Oil Price Volatility: Fluctuations in crude oil prices directly impact naphtha production costs and market competitiveness.
- Environmental Regulations: Stringent regulations on emissions and refining processes can increase operational costs and require significant capital investment for compliance.
- Competition from Natural Gas Liquids (NGLs): Increasing availability and attractiveness of NGLs as alternative feedstocks for steam crackers can pose a competitive threat.
- Supply Chain Disruptions: Geopolitical instability, logistical challenges, and unexpected outages can disrupt supply chains and impact availability.
- Capital Intensity: High initial investment required for setting up and maintaining naphtha production and processing facilities.
Emerging Opportunities in Naphtha Industry
Emerging opportunities in the naphtha industry lie in the development of sustainable naphtha alternatives, such as bio-naphtha derived from renewable sources, which could cater to the growing demand for eco-friendly products. The expansion of specialty naphtha grades tailored for niche applications in advanced materials, pharmaceuticals, and high-performance fuels presents untapped markets. Furthermore, the increasing focus on circular economy principles could drive opportunities in naphtha recycling from plastic waste.
Growth Accelerators in the Naphtha Industry Industry
Catalysts driving long-term growth in the naphtha industry include significant investments in new petrochemical complexes, particularly in regions with high demand growth. Strategic partnerships and joint ventures between oil and gas companies and chemical manufacturers are crucial for securing feedstock, sharing technological expertise, and expanding market reach. Market expansion strategies focusing on developing downstream value chains and catering to specialized end-user requirements will also accelerate growth.
Key Players Shaping the Naphtha Industry Market
- China National Petroleum Corporation (CNPC)
- SASOL
- MGTPetroil com
- Formosa Petrochemical Corporation
- Exxon Mobil Corporation
- Chevron Phillips Chemical Company LLC
- Reliance Industries Limited
- PetroChina Company Limited
- AMOC (Alexandria Mineral Oils Co)
- SABIC
- Petroleos Mexicanos
- Saudi Arabian Oil Co (Saudi Aramco)
- LG Chem
- Royal Dutch Shell PLC
- BP PLC
- China Petroleum & Chemical Corporation (SINOPEC)
Notable Milestones in Naphtha Industry Sector
- October 2022: LG Chem shuts down its naphtha crackers in South Korea for maintenance for seven weeks. This maintenance period is expected to affect the supply of petrochemicals in the region.
- November 2021: Exxon Mobil announced an investment in a multi-billion-dollar chemical complex in Guangdong province in southern China. This investment will enhance the company's production capacity by 1.6 million tonnes/year.
In-Depth Naphtha Industry Market Outlook
The future of the naphtha industry is characterized by sustained demand from the petrochemical sector, driven by global economic expansion and an increasing need for consumer goods. Growth accelerators will be fueled by technological advancements in refining and cracking processes, leading to higher yields and improved product quality. Strategic investments in new petrochemical capacities, particularly in Asia, will be pivotal. Furthermore, the burgeoning interest in sustainable solutions may spur the development and adoption of bio-naphtha and advanced recycling technologies, creating new market segments. Companies that can navigate the complexities of price volatility, evolving environmental regulations, and competitive feedstock landscapes will be well-positioned for long-term success. The industry outlook is cautiously optimistic, with a strong emphasis on innovation, efficiency, and adaptability to capitalize on emerging opportunities and mitigate prevailing challenges.
Naphtha Industry Segmentation
-
1. Type
- 1.1. Light Naphtha
- 1.2. Heavy Naptha
-
2. End-user Industry
- 2.1. Petrochemical
- 2.2. Agriculture
- 2.3. Paints and Coatings
- 2.4. Aerospace
- 2.5. Other End-user Industries
Naphtha Industry Segmentation By Geography
-
1. Asia Pacific
- 1.1. China
- 1.2. India
- 1.3. Japan
- 1.4. South Korea
- 1.5. Rest of Asia Pacific
-
2. North America
- 2.1. United States
- 2.2. Canada
- 2.3. Mexico
-
3. Europe
- 3.1. Germany
- 3.2. United Kingdom
- 3.3. Italy
- 3.4. France
- 3.5. Rest of Europe
-
4. South America
- 4.1. Brazil
- 4.2. Argentina
- 4.3. Rest of South America
-
5. Middle East and Africa
- 5.1. Saudi Arabia
- 5.2. South Africa
- 5.3. Rest of Middle East and Africa
Naphtha Industry Regional Market Share
Geographic Coverage of Naphtha Industry
Naphtha Industry REPORT HIGHLIGHTS
| Aspects | Details |
|---|---|
| Study Period | 2020-2034 |
| Base Year | 2025 |
| Estimated Year | 2026 |
| Forecast Period | 2026-2034 |
| Historical Period | 2020-2025 |
| Growth Rate | CAGR of > 4.00% from 2020-2034 |
| Segmentation |
|
Table of Contents
- 1. Introduction
- 1.1. Research Scope
- 1.2. Market Segmentation
- 1.3. Research Objective
- 1.4. Definitions and Assumptions
- 2. Executive Summary
- 2.1. Market Snapshot
- 3. Market Dynamics
- 3.1. Market Drivers
- 3.2. Market Restrains
- 3.3. Market Trends
- 3.4. Market Opportunities
- 4. Market Factor Analysis
- 4.1. Porters Five Forces
- 4.1.1. Bargaining Power of Suppliers
- 4.1.2. Bargaining Power of Buyers
- 4.1.3. Threat of New Entrants
- 4.1.4. Threat of Substitutes
- 4.1.5. Competitive Rivalry
- 4.2. PESTEL analysis
- 4.3. BCG Analysis
- 4.3.1. Stars (High Growth, High Market Share)
- 4.3.2. Cash Cows (Low Growth, High Market Share)
- 4.3.3. Question Mark (High Growth, Low Market Share)
- 4.3.4. Dogs (Low Growth, Low Market Share)
- 4.4. Ansoff Matrix Analysis
- 4.5. Supply Chain Analysis
- 4.6. Regulatory Landscape
- 4.7. Current Market Potential and Opportunity Assessment (TAM–SAM–SOM Framework)
- 4.8. IMR Analyst Note
- 4.1. Porters Five Forces
- 5. Market Analysis, Insights and Forecast 2021-2033
- 5.1. Market Analysis, Insights and Forecast - by Type
- 5.1.1. Light Naphtha
- 5.1.2. Heavy Naptha
- 5.2. Market Analysis, Insights and Forecast - by End-user Industry
- 5.2.1. Petrochemical
- 5.2.2. Agriculture
- 5.2.3. Paints and Coatings
- 5.2.4. Aerospace
- 5.2.5. Other End-user Industries
- 5.3. Market Analysis, Insights and Forecast - by Region
- 5.3.1. Asia Pacific
- 5.3.2. North America
- 5.3.3. Europe
- 5.3.4. South America
- 5.3.5. Middle East and Africa
- 5.1. Market Analysis, Insights and Forecast - by Type
- 6. Global Naphtha Industry Analysis, Insights and Forecast, 2021-2033
- 6.1. Market Analysis, Insights and Forecast - by Type
- 6.1.1. Light Naphtha
- 6.1.2. Heavy Naptha
- 6.2. Market Analysis, Insights and Forecast - by End-user Industry
- 6.2.1. Petrochemical
- 6.2.2. Agriculture
- 6.2.3. Paints and Coatings
- 6.2.4. Aerospace
- 6.2.5. Other End-user Industries
- 6.1. Market Analysis, Insights and Forecast - by Type
- 7. Asia Pacific Naphtha Industry Analysis, Insights and Forecast, 2020-2032
- 7.1. Market Analysis, Insights and Forecast - by Type
- 7.1.1. Light Naphtha
- 7.1.2. Heavy Naptha
- 7.2. Market Analysis, Insights and Forecast - by End-user Industry
- 7.2.1. Petrochemical
- 7.2.2. Agriculture
- 7.2.3. Paints and Coatings
- 7.2.4. Aerospace
- 7.2.5. Other End-user Industries
- 7.1. Market Analysis, Insights and Forecast - by Type
- 8. North America Naphtha Industry Analysis, Insights and Forecast, 2020-2032
- 8.1. Market Analysis, Insights and Forecast - by Type
- 8.1.1. Light Naphtha
- 8.1.2. Heavy Naptha
- 8.2. Market Analysis, Insights and Forecast - by End-user Industry
- 8.2.1. Petrochemical
- 8.2.2. Agriculture
- 8.2.3. Paints and Coatings
- 8.2.4. Aerospace
- 8.2.5. Other End-user Industries
- 8.1. Market Analysis, Insights and Forecast - by Type
- 9. Europe Naphtha Industry Analysis, Insights and Forecast, 2020-2032
- 9.1. Market Analysis, Insights and Forecast - by Type
- 9.1.1. Light Naphtha
- 9.1.2. Heavy Naptha
- 9.2. Market Analysis, Insights and Forecast - by End-user Industry
- 9.2.1. Petrochemical
- 9.2.2. Agriculture
- 9.2.3. Paints and Coatings
- 9.2.4. Aerospace
- 9.2.5. Other End-user Industries
- 9.1. Market Analysis, Insights and Forecast - by Type
- 10. South America Naphtha Industry Analysis, Insights and Forecast, 2020-2032
- 10.1. Market Analysis, Insights and Forecast - by Type
- 10.1.1. Light Naphtha
- 10.1.2. Heavy Naptha
- 10.2. Market Analysis, Insights and Forecast - by End-user Industry
- 10.2.1. Petrochemical
- 10.2.2. Agriculture
- 10.2.3. Paints and Coatings
- 10.2.4. Aerospace
- 10.2.5. Other End-user Industries
- 10.1. Market Analysis, Insights and Forecast - by Type
- 11. Middle East and Africa Naphtha Industry Analysis, Insights and Forecast, 2020-2032
- 11.1. Market Analysis, Insights and Forecast - by Type
- 11.1.1. Light Naphtha
- 11.1.2. Heavy Naptha
- 11.2. Market Analysis, Insights and Forecast - by End-user Industry
- 11.2.1. Petrochemical
- 11.2.2. Agriculture
- 11.2.3. Paints and Coatings
- 11.2.4. Aerospace
- 11.2.5. Other End-user Industries
- 11.1. Market Analysis, Insights and Forecast - by Type
- 12. Competitive Analysis
- 12.1. Company Profiles
- 12.1.1 China National Petroleum Corporation (CNPC)
- 12.1.1.1. Company Overview
- 12.1.1.2. Products
- 12.1.1.3. Company Financials
- 12.1.1.4. SWOT Analysis
- 12.1.2 SASOL
- 12.1.2.1. Company Overview
- 12.1.2.2. Products
- 12.1.2.3. Company Financials
- 12.1.2.4. SWOT Analysis
- 12.1.3 MGTPetroil com
- 12.1.3.1. Company Overview
- 12.1.3.2. Products
- 12.1.3.3. Company Financials
- 12.1.3.4. SWOT Analysis
- 12.1.4 Formosa Petrochemical Corporation
- 12.1.4.1. Company Overview
- 12.1.4.2. Products
- 12.1.4.3. Company Financials
- 12.1.4.4. SWOT Analysis
- 12.1.5 Exxon Mobil Corporation
- 12.1.5.1. Company Overview
- 12.1.5.2. Products
- 12.1.5.3. Company Financials
- 12.1.5.4. SWOT Analysis
- 12.1.6 Chevron Phillips Chemical Company LLC
- 12.1.6.1. Company Overview
- 12.1.6.2. Products
- 12.1.6.3. Company Financials
- 12.1.6.4. SWOT Analysis
- 12.1.7 Reliance Industries Limited
- 12.1.7.1. Company Overview
- 12.1.7.2. Products
- 12.1.7.3. Company Financials
- 12.1.7.4. SWOT Analysis
- 12.1.8 PetroChina Company Limited
- 12.1.8.1. Company Overview
- 12.1.8.2. Products
- 12.1.8.3. Company Financials
- 12.1.8.4. SWOT Analysis
- 12.1.9 AMOC (Alexandria Mineral Oils Co )
- 12.1.9.1. Company Overview
- 12.1.9.2. Products
- 12.1.9.3. Company Financials
- 12.1.9.4. SWOT Analysis
- 12.1.10 SABIC
- 12.1.10.1. Company Overview
- 12.1.10.2. Products
- 12.1.10.3. Company Financials
- 12.1.10.4. SWOT Analysis
- 12.1.11 Petroleos Mexicanos
- 12.1.11.1. Company Overview
- 12.1.11.2. Products
- 12.1.11.3. Company Financials
- 12.1.11.4. SWOT Analysis
- 12.1.12 Saudi Arabian Oil Co (Saudi Aramco)*List Not Exhaustive
- 12.1.12.1. Company Overview
- 12.1.12.2. Products
- 12.1.12.3. Company Financials
- 12.1.12.4. SWOT Analysis
- 12.1.13 LG Chem
- 12.1.13.1. Company Overview
- 12.1.13.2. Products
- 12.1.13.3. Company Financials
- 12.1.13.4. SWOT Analysis
- 12.1.14 Royal Dutch Shell PLC
- 12.1.14.1. Company Overview
- 12.1.14.2. Products
- 12.1.14.3. Company Financials
- 12.1.14.4. SWOT Analysis
- 12.1.15 BP PLC
- 12.1.15.1. Company Overview
- 12.1.15.2. Products
- 12.1.15.3. Company Financials
- 12.1.15.4. SWOT Analysis
- 12.1.16 China Petroleum & Chemical Corporation (SINOPEC)
- 12.1.16.1. Company Overview
- 12.1.16.2. Products
- 12.1.16.3. Company Financials
- 12.1.16.4. SWOT Analysis
- 12.1.1 China National Petroleum Corporation (CNPC)
- 12.2. Market Entropy
- 12.2.1 Company's Key Areas Served
- 12.2.2 Recent Developments
- 12.3. Company Market Share Analysis 2025
- 12.3.1 Top 5 Companies Market Share Analysis
- 12.3.2 Top 3 Companies Market Share Analysis
- 12.4. List of Potential Customers
- 13. Research Methodology
List of Figures
- Figure 1: Global Naphtha Industry Revenue Breakdown (Million, %) by Region 2025 & 2033
- Figure 2: Asia Pacific Naphtha Industry Revenue (Million), by Type 2025 & 2033
- Figure 3: Asia Pacific Naphtha Industry Revenue Share (%), by Type 2025 & 2033
- Figure 4: Asia Pacific Naphtha Industry Revenue (Million), by End-user Industry 2025 & 2033
- Figure 5: Asia Pacific Naphtha Industry Revenue Share (%), by End-user Industry 2025 & 2033
- Figure 6: Asia Pacific Naphtha Industry Revenue (Million), by Country 2025 & 2033
- Figure 7: Asia Pacific Naphtha Industry Revenue Share (%), by Country 2025 & 2033
- Figure 8: North America Naphtha Industry Revenue (Million), by Type 2025 & 2033
- Figure 9: North America Naphtha Industry Revenue Share (%), by Type 2025 & 2033
- Figure 10: North America Naphtha Industry Revenue (Million), by End-user Industry 2025 & 2033
- Figure 11: North America Naphtha Industry Revenue Share (%), by End-user Industry 2025 & 2033
- Figure 12: North America Naphtha Industry Revenue (Million), by Country 2025 & 2033
- Figure 13: North America Naphtha Industry Revenue Share (%), by Country 2025 & 2033
- Figure 14: Europe Naphtha Industry Revenue (Million), by Type 2025 & 2033
- Figure 15: Europe Naphtha Industry Revenue Share (%), by Type 2025 & 2033
- Figure 16: Europe Naphtha Industry Revenue (Million), by End-user Industry 2025 & 2033
- Figure 17: Europe Naphtha Industry Revenue Share (%), by End-user Industry 2025 & 2033
- Figure 18: Europe Naphtha Industry Revenue (Million), by Country 2025 & 2033
- Figure 19: Europe Naphtha Industry Revenue Share (%), by Country 2025 & 2033
- Figure 20: South America Naphtha Industry Revenue (Million), by Type 2025 & 2033
- Figure 21: South America Naphtha Industry Revenue Share (%), by Type 2025 & 2033
- Figure 22: South America Naphtha Industry Revenue (Million), by End-user Industry 2025 & 2033
- Figure 23: South America Naphtha Industry Revenue Share (%), by End-user Industry 2025 & 2033
- Figure 24: South America Naphtha Industry Revenue (Million), by Country 2025 & 2033
- Figure 25: South America Naphtha Industry Revenue Share (%), by Country 2025 & 2033
- Figure 26: Middle East and Africa Naphtha Industry Revenue (Million), by Type 2025 & 2033
- Figure 27: Middle East and Africa Naphtha Industry Revenue Share (%), by Type 2025 & 2033
- Figure 28: Middle East and Africa Naphtha Industry Revenue (Million), by End-user Industry 2025 & 2033
- Figure 29: Middle East and Africa Naphtha Industry Revenue Share (%), by End-user Industry 2025 & 2033
- Figure 30: Middle East and Africa Naphtha Industry Revenue (Million), by Country 2025 & 2033
- Figure 31: Middle East and Africa Naphtha Industry Revenue Share (%), by Country 2025 & 2033
List of Tables
- Table 1: Global Naphtha Industry Revenue Million Forecast, by Type 2020 & 2033
- Table 2: Global Naphtha Industry Revenue Million Forecast, by End-user Industry 2020 & 2033
- Table 3: Global Naphtha Industry Revenue Million Forecast, by Region 2020 & 2033
- Table 4: Global Naphtha Industry Revenue Million Forecast, by Type 2020 & 2033
- Table 5: Global Naphtha Industry Revenue Million Forecast, by End-user Industry 2020 & 2033
- Table 6: Global Naphtha Industry Revenue Million Forecast, by Country 2020 & 2033
- Table 7: China Naphtha Industry Revenue (Million) Forecast, by Application 2020 & 2033
- Table 8: India Naphtha Industry Revenue (Million) Forecast, by Application 2020 & 2033
- Table 9: Japan Naphtha Industry Revenue (Million) Forecast, by Application 2020 & 2033
- Table 10: South Korea Naphtha Industry Revenue (Million) Forecast, by Application 2020 & 2033
- Table 11: Rest of Asia Pacific Naphtha Industry Revenue (Million) Forecast, by Application 2020 & 2033
- Table 12: Global Naphtha Industry Revenue Million Forecast, by Type 2020 & 2033
- Table 13: Global Naphtha Industry Revenue Million Forecast, by End-user Industry 2020 & 2033
- Table 14: Global Naphtha Industry Revenue Million Forecast, by Country 2020 & 2033
- Table 15: United States Naphtha Industry Revenue (Million) Forecast, by Application 2020 & 2033
- Table 16: Canada Naphtha Industry Revenue (Million) Forecast, by Application 2020 & 2033
- Table 17: Mexico Naphtha Industry Revenue (Million) Forecast, by Application 2020 & 2033
- Table 18: Global Naphtha Industry Revenue Million Forecast, by Type 2020 & 2033
- Table 19: Global Naphtha Industry Revenue Million Forecast, by End-user Industry 2020 & 2033
- Table 20: Global Naphtha Industry Revenue Million Forecast, by Country 2020 & 2033
- Table 21: Germany Naphtha Industry Revenue (Million) Forecast, by Application 2020 & 2033
- Table 22: United Kingdom Naphtha Industry Revenue (Million) Forecast, by Application 2020 & 2033
- Table 23: Italy Naphtha Industry Revenue (Million) Forecast, by Application 2020 & 2033
- Table 24: France Naphtha Industry Revenue (Million) Forecast, by Application 2020 & 2033
- Table 25: Rest of Europe Naphtha Industry Revenue (Million) Forecast, by Application 2020 & 2033
- Table 26: Global Naphtha Industry Revenue Million Forecast, by Type 2020 & 2033
- Table 27: Global Naphtha Industry Revenue Million Forecast, by End-user Industry 2020 & 2033
- Table 28: Global Naphtha Industry Revenue Million Forecast, by Country 2020 & 2033
- Table 29: Brazil Naphtha Industry Revenue (Million) Forecast, by Application 2020 & 2033
- Table 30: Argentina Naphtha Industry Revenue (Million) Forecast, by Application 2020 & 2033
- Table 31: Rest of South America Naphtha Industry Revenue (Million) Forecast, by Application 2020 & 2033
- Table 32: Global Naphtha Industry Revenue Million Forecast, by Type 2020 & 2033
- Table 33: Global Naphtha Industry Revenue Million Forecast, by End-user Industry 2020 & 2033
- Table 34: Global Naphtha Industry Revenue Million Forecast, by Country 2020 & 2033
- Table 35: Saudi Arabia Naphtha Industry Revenue (Million) Forecast, by Application 2020 & 2033
- Table 36: South Africa Naphtha Industry Revenue (Million) Forecast, by Application 2020 & 2033
- Table 37: Rest of Middle East and Africa Naphtha Industry Revenue (Million) Forecast, by Application 2020 & 2033
Frequently Asked Questions
1. What is the projected Compound Annual Growth Rate (CAGR) of the Naphtha Industry?
The projected CAGR is approximately > 4.00%.
2. Which companies are prominent players in the Naphtha Industry?
Key companies in the market include China National Petroleum Corporation (CNPC), SASOL, MGTPetroil com, Formosa Petrochemical Corporation, Exxon Mobil Corporation, Chevron Phillips Chemical Company LLC, Reliance Industries Limited, PetroChina Company Limited, AMOC (Alexandria Mineral Oils Co ), SABIC, Petroleos Mexicanos, Saudi Arabian Oil Co (Saudi Aramco)*List Not Exhaustive, LG Chem, Royal Dutch Shell PLC, BP PLC, China Petroleum & Chemical Corporation (SINOPEC).
3. What are the main segments of the Naphtha Industry?
The market segments include Type, End-user Industry.
4. Can you provide details about the market size?
The market size is estimated to be USD XX Million as of 2022.
5. What are some drivers contributing to market growth?
Increasing Demand for Petrochemicals in Asia Pacific; Rising Demand for Fertilizers in India.
6. What are the notable trends driving market growth?
Rising Demand from Petrochemical Industry.
7. Are there any restraints impacting market growth?
Natural Gas Liquid Demand in the United States.
8. Can you provide examples of recent developments in the market?
October 2022: LG Chem shuts down its naphtha crackers in South Korea for maintenance for seven weeks. It will affect the supply of petrochemicals in the region during maintenance.
9. What pricing options are available for accessing the report?
Pricing options include single-user, multi-user, and enterprise licenses priced at USD 4750, USD 5250, and USD 8750 respectively.
10. Is the market size provided in terms of value or volume?
The market size is provided in terms of value, measured in Million.
11. Are there any specific market keywords associated with the report?
Yes, the market keyword associated with the report is "Naphtha Industry," which aids in identifying and referencing the specific market segment covered.
12. How do I determine which pricing option suits my needs best?
The pricing options vary based on user requirements and access needs. Individual users may opt for single-user licenses, while businesses requiring broader access may choose multi-user or enterprise licenses for cost-effective access to the report.
13. Are there any additional resources or data provided in the Naphtha Industry report?
While the report offers comprehensive insights, it's advisable to review the specific contents or supplementary materials provided to ascertain if additional resources or data are available.
14. How can I stay updated on further developments or reports in the Naphtha Industry?
To stay informed about further developments, trends, and reports in the Naphtha Industry, consider subscribing to industry newsletters, following relevant companies and organizations, or regularly checking reputable industry news sources and publications.
Methodology
Step 1 - Identification of Relevant Samples Size from Population Database


Step 2 - Approaches for Defining Global Market Size (Value, Volume* & Price*)

Note*: In applicable scenarios
Step 3 - Data Sources
Primary Research
- Web Analytics
- Survey Reports
- Research Institute
- Latest Research Reports
- Opinion Leaders
Secondary Research
- Annual Reports
- White Paper
- Latest Press Release
- Industry Association
- Paid Database
- Investor Presentations

Step 4 - Data Triangulation
Involves using different sources of information in order to increase the validity of a study
These sources are likely to be stakeholders in a program - participants, other researchers, program staff, other community members, and so on.
Then we put all data in single framework & apply various statistical tools to find out the dynamic on the market.
During the analysis stage, feedback from the stakeholder groups would be compared to determine areas of agreement as well as areas of divergence