

Key Insights
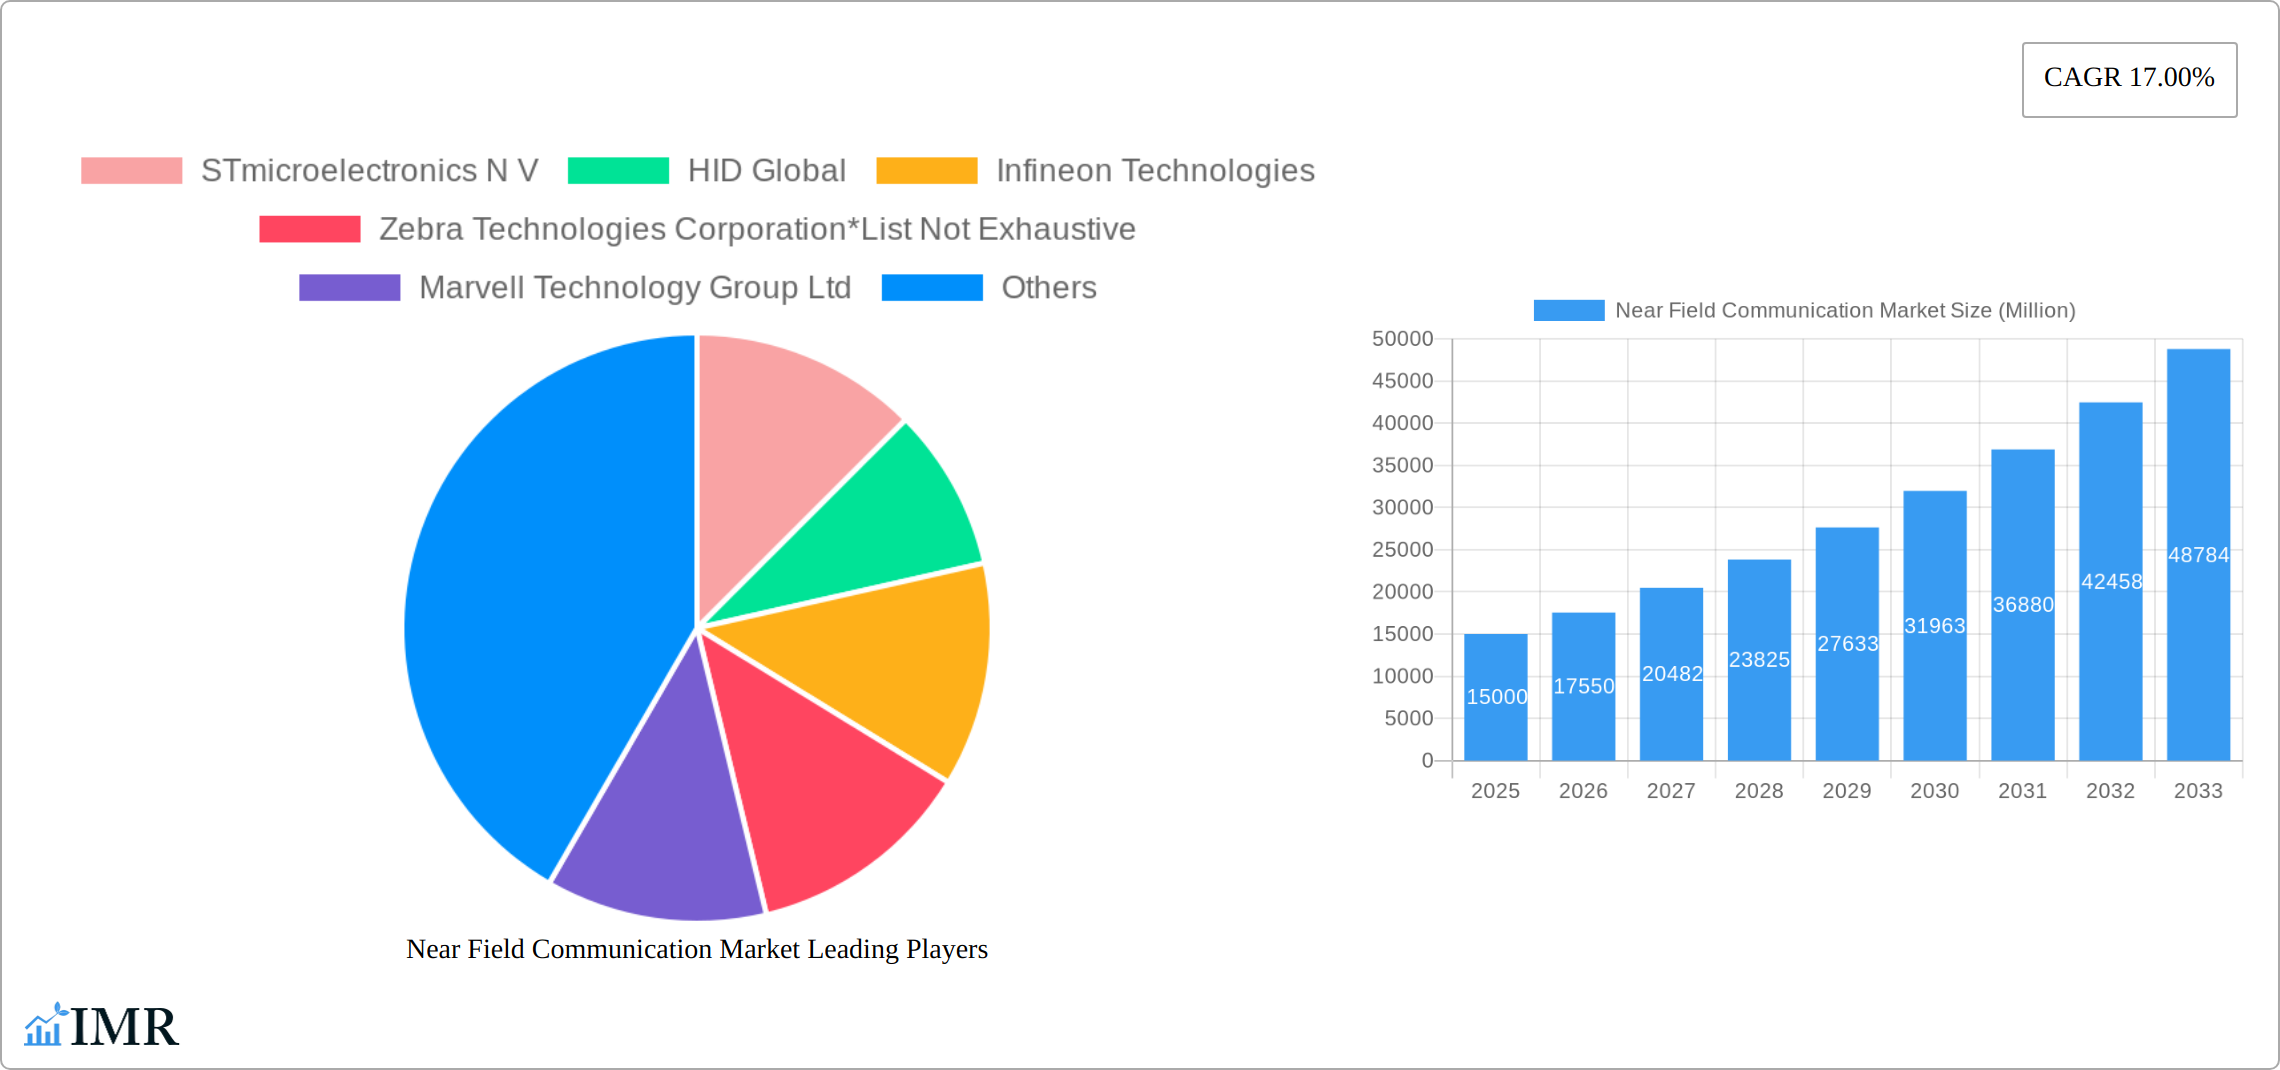
The Near Field Communication (NFC) market is experiencing robust growth, driven by the increasing adoption of contactless payment solutions, the proliferation of smartphones with integrated NFC chips, and the expanding applications in various sectors. The market's Compound Annual Growth Rate (CAGR) of 17% from 2019 to 2024 indicates a significant upward trajectory. This growth is fueled by several key factors. Firstly, the convenience and security offered by contactless payments are driving widespread adoption across retail, BFSI (Banking, Financial Services, and Insurance), and hospitality sectors. Secondly, the integration of NFC technology into an ever-growing range of consumer electronics, including smartphones, PCs, and wearables, is expanding the market's addressable audience. Furthermore, the increasing use of NFC in access control systems, healthcare devices (for patient identification and data transfer), and other specialized applications contributes to the market's overall expansion. While challenges such as security concerns and interoperability issues exist, technological advancements and the rising demand for seamless and secure data exchange are expected to mitigate these concerns. The market is segmented by end-device (smartphones dominating) and end-user vertical (BFSI and retail showing strong growth). Leading players like STMicroelectronics, NXP Semiconductors, and Infineon Technologies are actively shaping the market landscape through innovation and strategic partnerships.
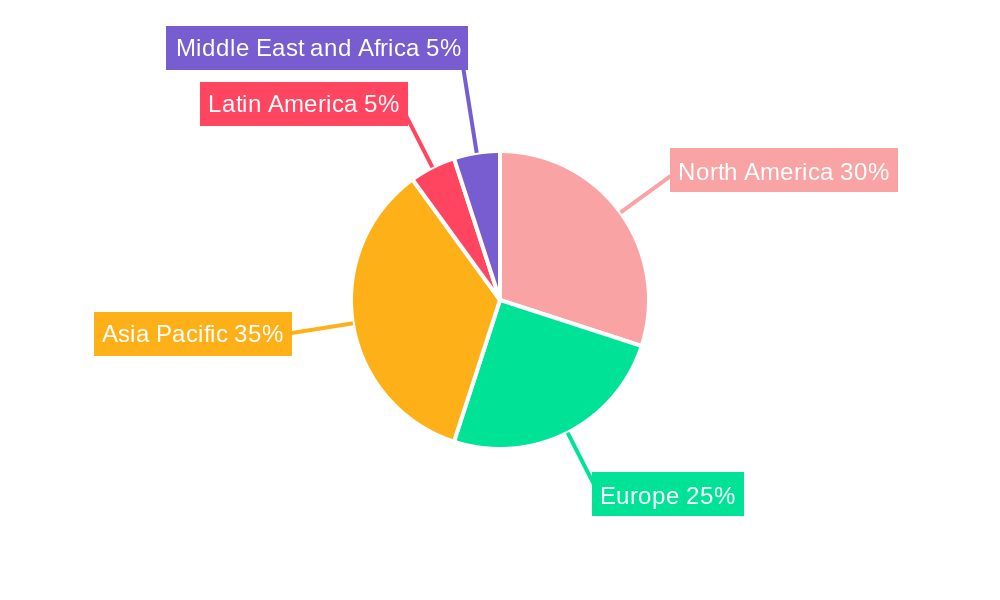
The forecast period from 2025 to 2033 anticipates continued growth, although the CAGR might moderate slightly as the market matures. The Asia-Pacific region is expected to be a key growth driver, owing to its rapidly expanding digital economy and increasing smartphone penetration. North America and Europe, while already mature markets, will see steady growth driven by upgrades in existing infrastructure and the adoption of advanced NFC applications. The competitive landscape remains dynamic, with both established players and new entrants vying for market share. Successful players will need to focus on developing innovative solutions, strengthening security features, and expanding into emerging markets to maintain a competitive edge. The continued integration of NFC into the Internet of Things (IoT) ecosystem promises further growth opportunities, further solidifying its position as a crucial technology for seamless connectivity and secure transactions.
This comprehensive report provides a detailed analysis of the Near Field Communication (NFC) market, encompassing its current dynamics, future growth trajectories, and key players. The study covers the period from 2019 to 2033, with 2025 serving as the base and estimated year. The report meticulously examines the parent market of wireless communication technologies and the child market of contactless payment systems, offering granular insights into various segments and regional markets. Projected market size is valued in Million units.
Near Field Communication Market Dynamics & Structure
This section delves into the intricate structure and dynamics of the NFC market, offering a comprehensive overview of its competitive landscape. We analyze market concentration, identifying the leading players and their respective market shares. The report quantifies the level of competition through metrics such as the Herfindahl-Hirschman Index (HHI) or similar concentration measures, if data is available, otherwise providing qualitative assessments. Technological innovation, a key driver, is examined through the lens of R&D investments and patent filings. Regulatory frameworks impacting NFC adoption are thoroughly analyzed across different geographies, considering factors like data privacy and security regulations. The influence of competitive product substitutes, such as Bluetooth Low Energy (BLE), is also assessed, along with the evolving demographics of end-users and their preferences. Finally, the report investigates M&A activities within the NFC ecosystem, analyzing deal volumes and their impact on market consolidation.
- Market Concentration: xx% of the market is controlled by the top 5 players in 2025 (estimated).
- Technological Innovation: Significant advancements are expected in areas such as power efficiency and data transfer speeds (xx% improvement projected by 2033).
- Regulatory Landscape: Variations in data privacy regulations across regions influence adoption rates and investment decisions.
- Competitive Substitutes: BLE presents a significant competitive challenge, particularly in low-bandwidth applications.
- M&A Activity: An estimated xx M&A deals occurred between 2019 and 2024. This trend is expected to continue, leading to further consolidation.
- Innovation Barriers: High initial investment costs for infrastructure and device integration can hinder widespread adoption.
Near Field Communication Market Growth Trends & Insights
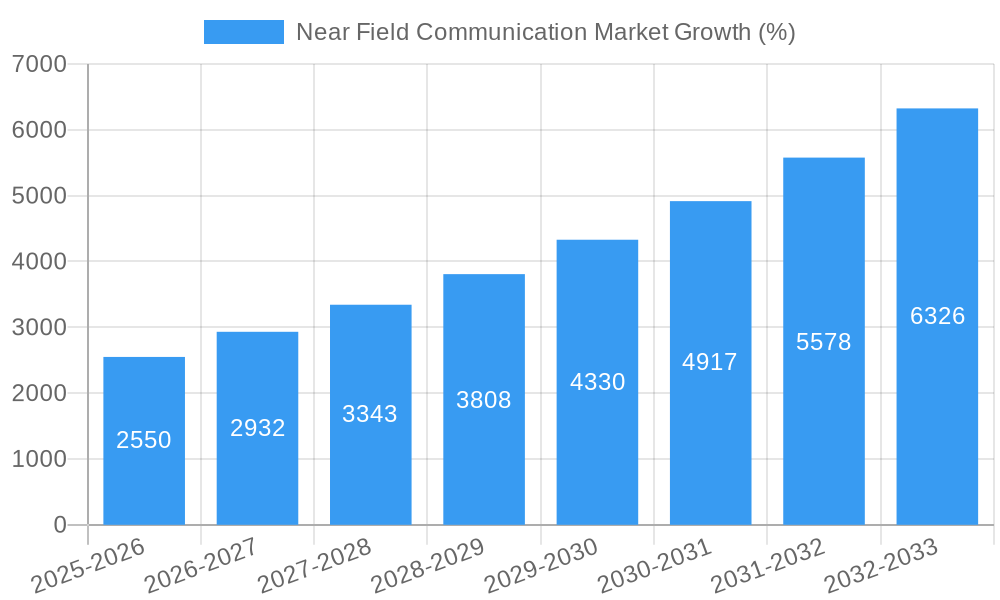
This section presents a detailed analysis of the NFC market's historical and projected growth. Using robust forecasting methodologies, we project a Compound Annual Growth Rate (CAGR) of xx% for the forecast period (2025-2033). Market size is projected to reach xx Million units by 2033, driven by factors such as increasing smartphone penetration, the expanding adoption of contactless payment systems, and the rise of IoT devices. Technological disruptions, such as the integration of NFC with other technologies (e.g., 5G), and shifting consumer behavior, particularly towards contactless interactions, are analyzed for their impact on market growth. The report also examines market penetration rates across different regions and segments, providing specific figures and illustrating the dynamic nature of the NFC market.
Dominant Regions, Countries, or Segments in Near Field Communication Market
This section pinpoints the leading regions, countries, and segments driving NFC market growth. North America and Europe are projected to maintain significant market shares due to early adoption and robust infrastructure, although Asia-Pacific is expected to demonstrate the fastest growth rate during the forecast period. Within the end-device segment, smartphones will maintain dominance due to widespread NFC integration. However, growth in medical equipment and other end devices presents significant opportunities. For end-user verticals, BFSI and retail sectors will continue to be key drivers. We analyze the specific drivers in each region and segment, exploring factors like economic policies, supportive regulatory environments, and consumer preferences. This section also provides detailed market share data and growth potential for each dominant segment.
- Leading Region: North America (projected market share of xx% in 2025).
- Fastest-Growing Region: Asia-Pacific (projected CAGR of xx% during 2025-2033).
- Dominant End-Device Segment: Smartphones (projected market share of xx% in 2025).
- High-Growth End-Device Segment: Medical Equipment (projected CAGR of xx% during 2025-2033).
- Leading End-user Vertical: BFSI (projected market share of xx% in 2025).
Near Field Communication Market Product Landscape
The NFC market encompasses a range of products, from simple NFC tags to sophisticated NFC controllers. Product innovations focus on enhancing security features, improving power efficiency, and expanding functionalities. Applications span contactless payments, access control, data exchange, and more. Key performance indicators (KPIs) include data transfer rates, power consumption, and security protocols. This section highlights the unique selling propositions (USPs) of various NFC products and underscores technological advancements, such as the integration of NFC with other technologies like Bluetooth and Wi-Fi.
Key Drivers, Barriers & Challenges in Near Field Communication Market
Key Drivers: Increasing smartphone penetration, growing adoption of contactless payment methods, the expanding IoT ecosystem, and supportive government regulations are major drivers of NFC market growth. These factors collectively fuel demand for NFC-enabled devices and services.
Challenges: High initial investment costs for infrastructure, interoperability issues between different NFC systems, security concerns related to data breaches, and the competition from alternative technologies (such as BLE) present significant challenges for widespread NFC adoption. The impact of these challenges is quantified through market share analysis and projections.
Emerging Opportunities in Near Field Communication Market
The NFC market presents several promising opportunities. The expansion of NFC into new applications, such as smart home devices, industrial automation, and healthcare, opens up vast untapped markets. Innovative applications leveraging NFC technology, combined with evolving consumer preferences toward contactless and seamless transactions, create opportunities for market expansion. This includes exploring the integration of NFC with emerging technologies like blockchain for secure transactions.
Growth Accelerators in the Near Field Communication Market Industry
Long-term growth in the NFC market will be fueled by continued technological breakthroughs, enhancing functionality and reducing costs. Strategic partnerships between technology companies and end-user industries will also significantly accelerate market growth, facilitating wider integration. Expansion strategies targeting untapped markets, particularly in developing economies, will play a crucial role.
Key Players Shaping the Near Field Communication Market Market
- STmicroelectronics N V
- HID Global
- Infineon Technologies
- Zebra Technologies Corporation
- Marvell Technology Group Ltd
- NXP Semiconductors
- Smartrac N V
- Toshiba Electronic Devices & Storage Corporation
- Texas Instruments Incorporated
- Shanghai Fudan Microelectronics Group Company Limited
Notable Milestones in Near Field Communication Market Sector
- 2020: Introduction of new NFC chips with enhanced security features by NXP Semiconductors.
- 2022: Launch of a new generation of NFC readers with improved power efficiency by STMicroelectronics N V.
- 2023: Strategic partnership between Infineon Technologies and a major payment processor to expand NFC payment solutions. (Specific details will be provided within the full report.)
In-Depth Near Field Communication Market Market Outlook
The future of the NFC market is bright, driven by ongoing technological advancements and growing demand for contactless solutions. Continued integration with other technologies like 5G and the Internet of Things (IoT) will further enhance the functionality and application of NFC. The market's potential for growth is significant, creating attractive strategic opportunities for businesses across various sectors. Further expansion into emerging markets and innovative applications will shape the future of the NFC landscape.
Near Field Communication Market Segmentation
-
1. End-Device
- 1.1. Smartphone
- 1.2. PCs and Other Consumer Electronics
- 1.3. Medical Equipment
- 1.4. Other End-Devices
-
2. End-user Vertical
- 2.1. BFSI
- 2.2. IT & Telecommunications
- 2.3. Retail
- 2.4. Healthcare
- 2.5. Hospitality and Transportation
- 2.6. Other End-users
Near Field Communication Market Segmentation By Geography
- 1. North America
- 2. Europe
- 3. Asia Pacific
- 4. Latin America
- 5. Middle East and Africa
Near Field Communication Market REPORT HIGHLIGHTS
| Aspects | Details |
|---|---|
| Study Period | 2019-2033 |
| Base Year | 2024 |
| Estimated Year | 2025 |
| Forecast Period | 2025-2033 |
| Historical Period | 2019-2024 |
| Growth Rate | CAGR of 17.00% from 2019-2033 |
| Segmentation |
|
Table of Contents
- 1. Introduction
- 1.1. Research Scope
- 1.2. Market Segmentation
- 1.3. Research Methodology
- 1.4. Definitions and Assumptions
- 2. Executive Summary
- 2.1. Introduction
- 3. Market Dynamics
- 3.1. Introduction
- 3.2. Market Drivers
- 3.2.1. ; Increasing acceptance of contactless payments and authentication
- 3.3. Market Restrains
- 3.3.1. Complexities Associated with the Technology
- 3.4. Market Trends
- 3.4.1. Healthcare Industry Offers Potential Growth
- 4. Market Factor Analysis
- 4.1. Porters Five Forces
- 4.2. Supply/Value Chain
- 4.3. PESTEL analysis
- 4.4. Market Entropy
- 4.5. Patent/Trademark Analysis
- 5. Global Near Field Communication Market Analysis, Insights and Forecast, 2019-2031
- 5.1. Market Analysis, Insights and Forecast - by End-Device
- 5.1.1. Smartphone
- 5.1.2. PCs and Other Consumer Electronics
- 5.1.3. Medical Equipment
- 5.1.4. Other End-Devices
- 5.2. Market Analysis, Insights and Forecast - by End-user Vertical
- 5.2.1. BFSI
- 5.2.2. IT & Telecommunications
- 5.2.3. Retail
- 5.2.4. Healthcare
- 5.2.5. Hospitality and Transportation
- 5.2.6. Other End-users
- 5.3. Market Analysis, Insights and Forecast - by Region
- 5.3.1. North America
- 5.3.2. Europe
- 5.3.3. Asia Pacific
- 5.3.4. Latin America
- 5.3.5. Middle East and Africa
- 5.1. Market Analysis, Insights and Forecast - by End-Device
- 6. North America Near Field Communication Market Analysis, Insights and Forecast, 2019-2031
- 6.1. Market Analysis, Insights and Forecast - by End-Device
- 6.1.1. Smartphone
- 6.1.2. PCs and Other Consumer Electronics
- 6.1.3. Medical Equipment
- 6.1.4. Other End-Devices
- 6.2. Market Analysis, Insights and Forecast - by End-user Vertical
- 6.2.1. BFSI
- 6.2.2. IT & Telecommunications
- 6.2.3. Retail
- 6.2.4. Healthcare
- 6.2.5. Hospitality and Transportation
- 6.2.6. Other End-users
- 6.1. Market Analysis, Insights and Forecast - by End-Device
- 7. Europe Near Field Communication Market Analysis, Insights and Forecast, 2019-2031
- 7.1. Market Analysis, Insights and Forecast - by End-Device
- 7.1.1. Smartphone
- 7.1.2. PCs and Other Consumer Electronics
- 7.1.3. Medical Equipment
- 7.1.4. Other End-Devices
- 7.2. Market Analysis, Insights and Forecast - by End-user Vertical
- 7.2.1. BFSI
- 7.2.2. IT & Telecommunications
- 7.2.3. Retail
- 7.2.4. Healthcare
- 7.2.5. Hospitality and Transportation
- 7.2.6. Other End-users
- 7.1. Market Analysis, Insights and Forecast - by End-Device
- 8. Asia Pacific Near Field Communication Market Analysis, Insights and Forecast, 2019-2031
- 8.1. Market Analysis, Insights and Forecast - by End-Device
- 8.1.1. Smartphone
- 8.1.2. PCs and Other Consumer Electronics
- 8.1.3. Medical Equipment
- 8.1.4. Other End-Devices
- 8.2. Market Analysis, Insights and Forecast - by End-user Vertical
- 8.2.1. BFSI
- 8.2.2. IT & Telecommunications
- 8.2.3. Retail
- 8.2.4. Healthcare
- 8.2.5. Hospitality and Transportation
- 8.2.6. Other End-users
- 8.1. Market Analysis, Insights and Forecast - by End-Device
- 9. Latin America Near Field Communication Market Analysis, Insights and Forecast, 2019-2031
- 9.1. Market Analysis, Insights and Forecast - by End-Device
- 9.1.1. Smartphone
- 9.1.2. PCs and Other Consumer Electronics
- 9.1.3. Medical Equipment
- 9.1.4. Other End-Devices
- 9.2. Market Analysis, Insights and Forecast - by End-user Vertical
- 9.2.1. BFSI
- 9.2.2. IT & Telecommunications
- 9.2.3. Retail
- 9.2.4. Healthcare
- 9.2.5. Hospitality and Transportation
- 9.2.6. Other End-users
- 9.1. Market Analysis, Insights and Forecast - by End-Device
- 10. Middle East and Africa Near Field Communication Market Analysis, Insights and Forecast, 2019-2031
- 10.1. Market Analysis, Insights and Forecast - by End-Device
- 10.1.1. Smartphone
- 10.1.2. PCs and Other Consumer Electronics
- 10.1.3. Medical Equipment
- 10.1.4. Other End-Devices
- 10.2. Market Analysis, Insights and Forecast - by End-user Vertical
- 10.2.1. BFSI
- 10.2.2. IT & Telecommunications
- 10.2.3. Retail
- 10.2.4. Healthcare
- 10.2.5. Hospitality and Transportation
- 10.2.6. Other End-users
- 10.1. Market Analysis, Insights and Forecast - by End-Device
- 11. North America Near Field Communication Market Analysis, Insights and Forecast, 2019-2031
- 11.1. Market Analysis, Insights and Forecast - By Country/Sub-region
- 11.1.1.
- 12. Europe Near Field Communication Market Analysis, Insights and Forecast, 2019-2031
- 12.1. Market Analysis, Insights and Forecast - By Country/Sub-region
- 12.1.1.
- 13. Asia Pacific Near Field Communication Market Analysis, Insights and Forecast, 2019-2031
- 13.1. Market Analysis, Insights and Forecast - By Country/Sub-region
- 13.1.1.
- 14. Latin America Near Field Communication Market Analysis, Insights and Forecast, 2019-2031
- 14.1. Market Analysis, Insights and Forecast - By Country/Sub-region
- 14.1.1.
- 15. Middle East and Africa Near Field Communication Market Analysis, Insights and Forecast, 2019-2031
- 15.1. Market Analysis, Insights and Forecast - By Country/Sub-region
- 15.1.1.
- 16. Competitive Analysis
- 16.1. Global Market Share Analysis 2024
- 16.2. Company Profiles
- 16.2.1 STmicroelectronics N V
- 16.2.1.1. Overview
- 16.2.1.2. Products
- 16.2.1.3. SWOT Analysis
- 16.2.1.4. Recent Developments
- 16.2.1.5. Financials (Based on Availability)
- 16.2.2 HID Global
- 16.2.2.1. Overview
- 16.2.2.2. Products
- 16.2.2.3. SWOT Analysis
- 16.2.2.4. Recent Developments
- 16.2.2.5. Financials (Based on Availability)
- 16.2.3 Infineon Technologies
- 16.2.3.1. Overview
- 16.2.3.2. Products
- 16.2.3.3. SWOT Analysis
- 16.2.3.4. Recent Developments
- 16.2.3.5. Financials (Based on Availability)
- 16.2.4 Zebra Technologies Corporation*List Not Exhaustive
- 16.2.4.1. Overview
- 16.2.4.2. Products
- 16.2.4.3. SWOT Analysis
- 16.2.4.4. Recent Developments
- 16.2.4.5. Financials (Based on Availability)
- 16.2.5 Marvell Technology Group Ltd
- 16.2.5.1. Overview
- 16.2.5.2. Products
- 16.2.5.3. SWOT Analysis
- 16.2.5.4. Recent Developments
- 16.2.5.5. Financials (Based on Availability)
- 16.2.6 NXP Semiconductors
- 16.2.6.1. Overview
- 16.2.6.2. Products
- 16.2.6.3. SWOT Analysis
- 16.2.6.4. Recent Developments
- 16.2.6.5. Financials (Based on Availability)
- 16.2.7 Smartrac N V
- 16.2.7.1. Overview
- 16.2.7.2. Products
- 16.2.7.3. SWOT Analysis
- 16.2.7.4. Recent Developments
- 16.2.7.5. Financials (Based on Availability)
- 16.2.8 Toshiba Electronic Devices & Storage Corporation
- 16.2.8.1. Overview
- 16.2.8.2. Products
- 16.2.8.3. SWOT Analysis
- 16.2.8.4. Recent Developments
- 16.2.8.5. Financials (Based on Availability)
- 16.2.9 Texas Instruments Incorporated
- 16.2.9.1. Overview
- 16.2.9.2. Products
- 16.2.9.3. SWOT Analysis
- 16.2.9.4. Recent Developments
- 16.2.9.5. Financials (Based on Availability)
- 16.2.10 Shanghai Fudan Microelectronics Group Company Limited
- 16.2.10.1. Overview
- 16.2.10.2. Products
- 16.2.10.3. SWOT Analysis
- 16.2.10.4. Recent Developments
- 16.2.10.5. Financials (Based on Availability)
- 16.2.1 STmicroelectronics N V
List of Figures
- Figure 1: Global Near Field Communication Market Revenue Breakdown (Million, %) by Region 2024 & 2032
- Figure 2: North America Near Field Communication Market Revenue (Million), by Country 2024 & 2032
- Figure 3: North America Near Field Communication Market Revenue Share (%), by Country 2024 & 2032
- Figure 4: Europe Near Field Communication Market Revenue (Million), by Country 2024 & 2032
- Figure 5: Europe Near Field Communication Market Revenue Share (%), by Country 2024 & 2032
- Figure 6: Asia Pacific Near Field Communication Market Revenue (Million), by Country 2024 & 2032
- Figure 7: Asia Pacific Near Field Communication Market Revenue Share (%), by Country 2024 & 2032
- Figure 8: Latin America Near Field Communication Market Revenue (Million), by Country 2024 & 2032
- Figure 9: Latin America Near Field Communication Market Revenue Share (%), by Country 2024 & 2032
- Figure 10: Middle East and Africa Near Field Communication Market Revenue (Million), by Country 2024 & 2032
- Figure 11: Middle East and Africa Near Field Communication Market Revenue Share (%), by Country 2024 & 2032
- Figure 12: North America Near Field Communication Market Revenue (Million), by End-Device 2024 & 2032
- Figure 13: North America Near Field Communication Market Revenue Share (%), by End-Device 2024 & 2032
- Figure 14: North America Near Field Communication Market Revenue (Million), by End-user Vertical 2024 & 2032
- Figure 15: North America Near Field Communication Market Revenue Share (%), by End-user Vertical 2024 & 2032
- Figure 16: North America Near Field Communication Market Revenue (Million), by Country 2024 & 2032
- Figure 17: North America Near Field Communication Market Revenue Share (%), by Country 2024 & 2032
- Figure 18: Europe Near Field Communication Market Revenue (Million), by End-Device 2024 & 2032
- Figure 19: Europe Near Field Communication Market Revenue Share (%), by End-Device 2024 & 2032
- Figure 20: Europe Near Field Communication Market Revenue (Million), by End-user Vertical 2024 & 2032
- Figure 21: Europe Near Field Communication Market Revenue Share (%), by End-user Vertical 2024 & 2032
- Figure 22: Europe Near Field Communication Market Revenue (Million), by Country 2024 & 2032
- Figure 23: Europe Near Field Communication Market Revenue Share (%), by Country 2024 & 2032
- Figure 24: Asia Pacific Near Field Communication Market Revenue (Million), by End-Device 2024 & 2032
- Figure 25: Asia Pacific Near Field Communication Market Revenue Share (%), by End-Device 2024 & 2032
- Figure 26: Asia Pacific Near Field Communication Market Revenue (Million), by End-user Vertical 2024 & 2032
- Figure 27: Asia Pacific Near Field Communication Market Revenue Share (%), by End-user Vertical 2024 & 2032
- Figure 28: Asia Pacific Near Field Communication Market Revenue (Million), by Country 2024 & 2032
- Figure 29: Asia Pacific Near Field Communication Market Revenue Share (%), by Country 2024 & 2032
- Figure 30: Latin America Near Field Communication Market Revenue (Million), by End-Device 2024 & 2032
- Figure 31: Latin America Near Field Communication Market Revenue Share (%), by End-Device 2024 & 2032
- Figure 32: Latin America Near Field Communication Market Revenue (Million), by End-user Vertical 2024 & 2032
- Figure 33: Latin America Near Field Communication Market Revenue Share (%), by End-user Vertical 2024 & 2032
- Figure 34: Latin America Near Field Communication Market Revenue (Million), by Country 2024 & 2032
- Figure 35: Latin America Near Field Communication Market Revenue Share (%), by Country 2024 & 2032
- Figure 36: Middle East and Africa Near Field Communication Market Revenue (Million), by End-Device 2024 & 2032
- Figure 37: Middle East and Africa Near Field Communication Market Revenue Share (%), by End-Device 2024 & 2032
- Figure 38: Middle East and Africa Near Field Communication Market Revenue (Million), by End-user Vertical 2024 & 2032
- Figure 39: Middle East and Africa Near Field Communication Market Revenue Share (%), by End-user Vertical 2024 & 2032
- Figure 40: Middle East and Africa Near Field Communication Market Revenue (Million), by Country 2024 & 2032
- Figure 41: Middle East and Africa Near Field Communication Market Revenue Share (%), by Country 2024 & 2032
List of Tables
- Table 1: Global Near Field Communication Market Revenue Million Forecast, by Region 2019 & 2032
- Table 2: Global Near Field Communication Market Revenue Million Forecast, by End-Device 2019 & 2032
- Table 3: Global Near Field Communication Market Revenue Million Forecast, by End-user Vertical 2019 & 2032
- Table 4: Global Near Field Communication Market Revenue Million Forecast, by Region 2019 & 2032
- Table 5: Global Near Field Communication Market Revenue Million Forecast, by Country 2019 & 2032
- Table 6: Near Field Communication Market Revenue (Million) Forecast, by Application 2019 & 2032
- Table 7: Global Near Field Communication Market Revenue Million Forecast, by Country 2019 & 2032
- Table 8: Near Field Communication Market Revenue (Million) Forecast, by Application 2019 & 2032
- Table 9: Global Near Field Communication Market Revenue Million Forecast, by Country 2019 & 2032
- Table 10: Near Field Communication Market Revenue (Million) Forecast, by Application 2019 & 2032
- Table 11: Global Near Field Communication Market Revenue Million Forecast, by Country 2019 & 2032
- Table 12: Near Field Communication Market Revenue (Million) Forecast, by Application 2019 & 2032
- Table 13: Global Near Field Communication Market Revenue Million Forecast, by Country 2019 & 2032
- Table 14: Near Field Communication Market Revenue (Million) Forecast, by Application 2019 & 2032
- Table 15: Global Near Field Communication Market Revenue Million Forecast, by End-Device 2019 & 2032
- Table 16: Global Near Field Communication Market Revenue Million Forecast, by End-user Vertical 2019 & 2032
- Table 17: Global Near Field Communication Market Revenue Million Forecast, by Country 2019 & 2032
- Table 18: Global Near Field Communication Market Revenue Million Forecast, by End-Device 2019 & 2032
- Table 19: Global Near Field Communication Market Revenue Million Forecast, by End-user Vertical 2019 & 2032
- Table 20: Global Near Field Communication Market Revenue Million Forecast, by Country 2019 & 2032
- Table 21: Global Near Field Communication Market Revenue Million Forecast, by End-Device 2019 & 2032
- Table 22: Global Near Field Communication Market Revenue Million Forecast, by End-user Vertical 2019 & 2032
- Table 23: Global Near Field Communication Market Revenue Million Forecast, by Country 2019 & 2032
- Table 24: Global Near Field Communication Market Revenue Million Forecast, by End-Device 2019 & 2032
- Table 25: Global Near Field Communication Market Revenue Million Forecast, by End-user Vertical 2019 & 2032
- Table 26: Global Near Field Communication Market Revenue Million Forecast, by Country 2019 & 2032
- Table 27: Global Near Field Communication Market Revenue Million Forecast, by End-Device 2019 & 2032
- Table 28: Global Near Field Communication Market Revenue Million Forecast, by End-user Vertical 2019 & 2032
- Table 29: Global Near Field Communication Market Revenue Million Forecast, by Country 2019 & 2032
Frequently Asked Questions
1. What is the projected Compound Annual Growth Rate (CAGR) of the Near Field Communication Market?
The projected CAGR is approximately 17.00%.
2. Which companies are prominent players in the Near Field Communication Market?
Key companies in the market include STmicroelectronics N V, HID Global, Infineon Technologies, Zebra Technologies Corporation*List Not Exhaustive, Marvell Technology Group Ltd, NXP Semiconductors, Smartrac N V, Toshiba Electronic Devices & Storage Corporation, Texas Instruments Incorporated, Shanghai Fudan Microelectronics Group Company Limited.
3. What are the main segments of the Near Field Communication Market?
The market segments include End-Device, End-user Vertical.
4. Can you provide details about the market size?
The market size is estimated to be USD XX Million as of 2022.
5. What are some drivers contributing to market growth?
; Increasing acceptance of contactless payments and authentication.
6. What are the notable trends driving market growth?
Healthcare Industry Offers Potential Growth.
7. Are there any restraints impacting market growth?
Complexities Associated with the Technology.
8. Can you provide examples of recent developments in the market?
N/A
9. What pricing options are available for accessing the report?
Pricing options include single-user, multi-user, and enterprise licenses priced at USD 4750, USD 5250, and USD 8750 respectively.
10. Is the market size provided in terms of value or volume?
The market size is provided in terms of value, measured in Million.
11. Are there any specific market keywords associated with the report?
Yes, the market keyword associated with the report is "Near Field Communication Market," which aids in identifying and referencing the specific market segment covered.
12. How do I determine which pricing option suits my needs best?
The pricing options vary based on user requirements and access needs. Individual users may opt for single-user licenses, while businesses requiring broader access may choose multi-user or enterprise licenses for cost-effective access to the report.
13. Are there any additional resources or data provided in the Near Field Communication Market report?
While the report offers comprehensive insights, it's advisable to review the specific contents or supplementary materials provided to ascertain if additional resources or data are available.
14. How can I stay updated on further developments or reports in the Near Field Communication Market?
To stay informed about further developments, trends, and reports in the Near Field Communication Market, consider subscribing to industry newsletters, following relevant companies and organizations, or regularly checking reputable industry news sources and publications.
Methodology
Step 1 - Identification of Relevant Samples Size from Population Database


Step 2 - Approaches for Defining Global Market Size (Value, Volume* & Price*)

Note*: In applicable scenarios
Step 3 - Data Sources
Primary Research
- Web Analytics
- Survey Reports
- Research Institute
- Latest Research Reports
- Opinion Leaders
Secondary Research
- Annual Reports
- White Paper
- Latest Press Release
- Industry Association
- Paid Database
- Investor Presentations

Step 4 - Data Triangulation
Involves using different sources of information in order to increase the validity of a study
These sources are likely to be stakeholders in a program - participants, other researchers, program staff, other community members, and so on.
Then we put all data in single framework & apply various statistical tools to find out the dynamic on the market.
During the analysis stage, feedback from the stakeholder groups would be compared to determine areas of agreement as well as areas of divergence
