

Key Insights
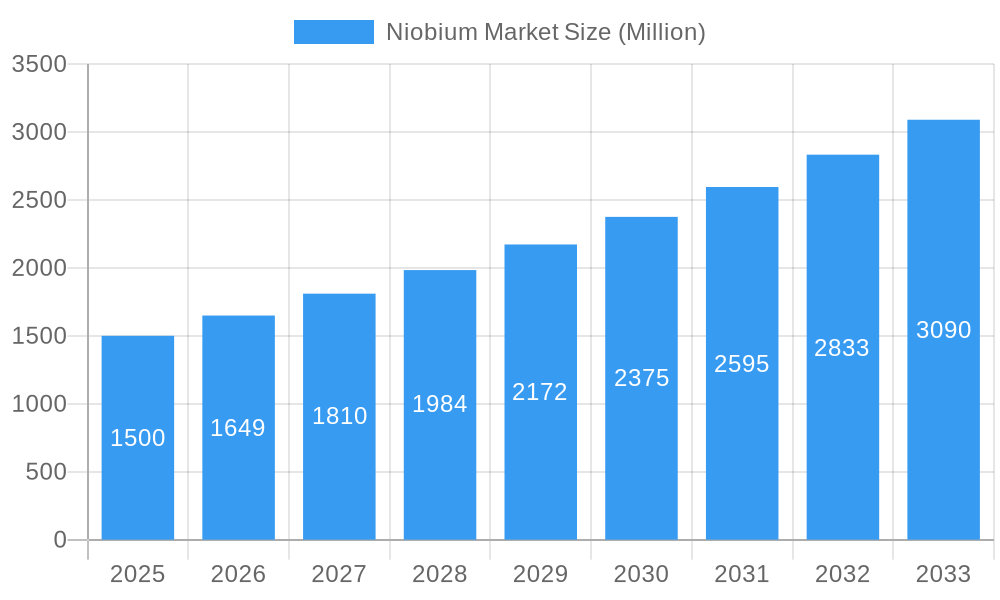
The global niobium market is poised for substantial expansion, forecasted to reach $1409 million by 2033, driven by a Compound Annual Growth Rate (CAGR) of 3.9% from a base year of 2025. Key growth catalysts include increasing demand in high-strength low-alloy (HSLA) steels for construction and automotive sectors, alongside critical applications in aerospace and defense for lightweight, high-performance components. The burgeoning renewable energy sector, particularly for superconducting magnets and batteries, is also a significant driver of niobium utilization. Niobium's exceptional properties, such as a high melting point, corrosion resistance, and excellent formability, position it as a vital material for these advanced applications. Innovations in niobium extraction and processing are enhancing efficiency and reducing costs, further supporting market growth. Despite potential supply chain complexities and price volatility, the market outlook remains robust, anticipating sustained growth.
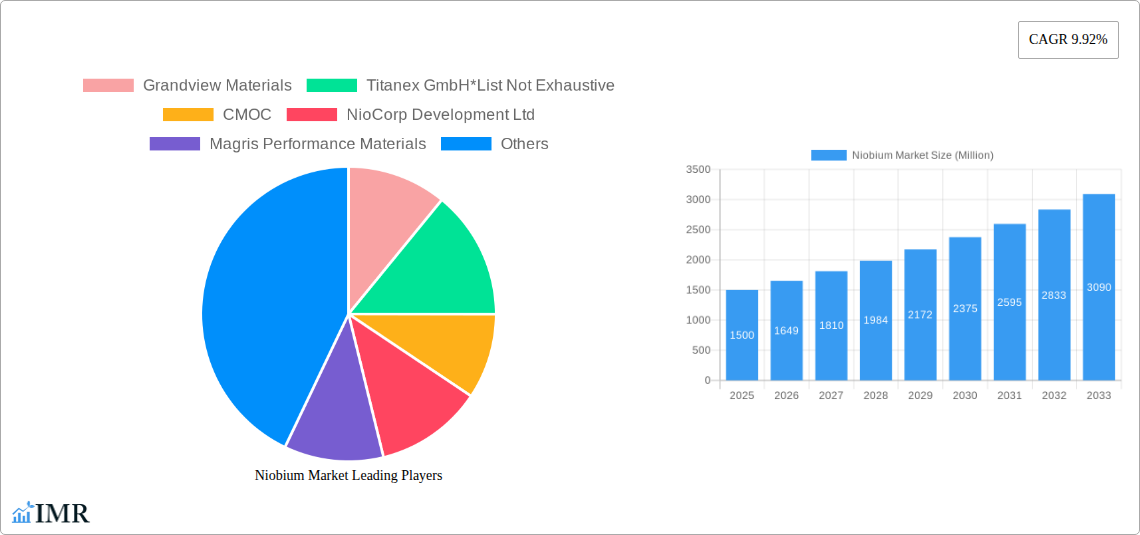
Niobium Market Market Size (In Billion)
Geographically, the Asia-Pacific region, led by China's strong manufacturing and construction base, dominates the niobium market. North America and Europe are also key markets, benefiting from established industries and technological advancements. Emerging economies in South America, the Middle East, and Africa present considerable growth potential fueled by accelerating infrastructure development and industrialization. Market segmentation highlights ferroniobium as the leading product type, followed by niobium oxide and niobium metal. While steel production currently represents the largest application segment, the expanding superalloy, superconducting magnet, and battery sectors are projected to significantly influence future growth, driving innovation and diversification.
Niobium Market Company Market Share
Niobium Market: A Comprehensive Market Report (2019-2033)
This comprehensive report provides an in-depth analysis of the Niobium market, encompassing market dynamics, growth trends, regional dominance, product landscape, key players, and future outlook. The report covers the historical period (2019-2024), base year (2025), and forecast period (2025-2033), offering valuable insights for industry professionals, investors, and strategic decision-makers. The market is segmented by occurrence (Carbonatites and Associates, Columbite-Tantalite), type (Ferroniobium, Niobium Oxide, Niobium Metal, Vacuum-Grade Niobium Alloys), application (Steel, Super Alloys, Superconducting Magnets and Capacitors, Batteries, Other Applications), and end-user industry (Construction, Automotive and Shipbuilding, Aerospace and Defense, Oil and Gas, Other End-user Industries). The report’s value is presented in Million units.
Niobium Market Dynamics & Structure
The Niobium market is characterized by moderate concentration, with key players like CBMM holding significant market share. Technological innovation, particularly in battery technology and high-strength alloys, is a primary growth driver. Stringent environmental regulations influence production methods and necessitate sustainable practices. Competitive substitutes, such as other high-strength materials, pose a challenge. The market exhibits diverse end-user demographics across various industries, each with unique demand patterns. M&A activity, as exemplified by Kymera International's acquisition of Telex Metals in January 2022, signals consolidation and expansion strategies within the sector.
- Market Concentration: Moderately concentrated, with CBMM holding a significant share (xx%).
- Technological Innovation: Focus on improving alloy properties and exploring new applications in batteries and superconductors.
- Regulatory Framework: Increasing emphasis on sustainability and environmental compliance impacts production processes.
- Competitive Substitutes: High-strength steel alternatives and other materials limit market growth.
- End-User Demographics: Diverse applications across construction, automotive, aerospace, and energy sectors.
- M&A Trends: Strategic acquisitions are driving consolidation and expansion into new market segments. Estimated xx M&A deals in the last five years.
Niobium Market Growth Trends & Insights
The Niobium market is experiencing robust growth, driven by increasing demand from key sectors. The market size is estimated at xx Million units in 2025 and is projected to reach xx Million units by 2033, exhibiting a CAGR of xx% during the forecast period. Adoption rates are increasing across various applications, particularly in the automotive and aerospace sectors due to the material's unique properties. Technological disruptions, including advancements in battery technology and lightweight materials, further fuel market expansion. Consumer behavior shifts towards sustainable and high-performance products are creating new market opportunities. Market penetration in emerging economies is also contributing to overall growth.
Dominant Regions, Countries, or Segments in Niobium Market
Brazil, owing to CBMM's dominance and substantial reserves, emerges as a leading region. The Ferroniobium segment holds the largest market share due to its extensive use in steel production. Within applications, steel manufacturing accounts for the largest share, followed by superalloys and burgeoning demand from the battery sector. Key growth drivers include:
- Brazil: Abundant niobium reserves and the presence of major producers.
- Ferroniobium: Dominant type due to extensive use in steel.
- Steel Application: Largest application segment driven by construction and automotive industries.
- Economic Policies: Government incentives for sustainable material usage influence market growth.
- Infrastructure Development: Expansion in construction and transportation sectors boost demand.
Niobium Market Product Landscape
The Niobium product landscape features a range of materials, including ferroniobium, niobium oxide, niobium metal, and vacuum-grade niobium alloys, each catering to specific applications and performance requirements. Recent innovations focus on enhancing material properties, like improved strength-to-weight ratios and corrosion resistance. Unique selling propositions include high strength, lightweight properties, and superior performance in extreme environments. Technological advancements continue to drive the development of more efficient and cost-effective production methods.
Key Drivers, Barriers & Challenges in Niobium Market
Key Drivers:
- Growing demand from the automotive and aerospace sectors for lightweight and high-strength materials.
- Increasing adoption of niobium in battery applications.
- Advancements in niobium-based alloy technologies.
Challenges:
- Price volatility due to supply chain constraints.
- Competition from alternative materials.
- Environmental regulations impacting production processes.
- Estimated supply chain disruptions impacting xx% of production in 2024.
Emerging Opportunities in Niobium Market
- Expanding applications in renewable energy technologies, particularly in wind turbines and solar panels.
- Growing demand from the electronics industry for high-performance capacitors.
- Penetration into new markets such as 3D printing and medical implants.
Growth Accelerators in the Niobium Market Industry
Technological breakthroughs in alloy development and improved production efficiency are significantly accelerating market growth. Strategic partnerships between niobium producers and end-users, as seen in CBMM's collaboration with Horwin Brasil, unlock new applications and markets. Market expansion into emerging economies with robust infrastructure development further fuels growth.
Key Players Shaping the Niobium Market Market
- Grandview Materials
- Titanex GmbH
- CMOC
- NioCorp Development Ltd
- Magris Performance Materials
- Changsha South Tantalum Niobium Co Ltd
- Admat Inc
- Australian Strategic Materials Ltd
- CBMM
Notable Milestones in Niobium Market Sector
- December 2022: CBMM announced an USD 80 million investment to expand niobium oxide capacity to 3,000 tons by 2024, aiming for 40,000 tons by 2030.
- March 2022: CBMM partnered with Horwin Brasil, investing 70 million reais to promote niobium in electric vehicle batteries, targeting 50,000 tons of niobium product sales by 2030.
- January 2022: Kymera International acquired Telex Metals, expanding its presence in tantalum and niobium materials.
In-Depth Niobium Market Market Outlook
The Niobium market is poised for substantial growth, driven by ongoing technological advancements, strategic partnerships, and expanding applications across diverse sectors. The focus on sustainable materials and increasing demand for high-performance alloys will create significant opportunities for market players. Strategic investments in research and development, coupled with aggressive market expansion strategies, will further propel market growth in the coming years.
Niobium Market Segmentation
-
1. Occurrence
- 1.1. Carbonatites and Associates
- 1.2. Columbite-Tantalite
-
2. Type
- 2.1. Ferroniobium
- 2.2. Niobium Oxide
- 2.3. Niobium Metal
- 2.4. Vacuum-Grade Niobium Alloys
-
3. Application
- 3.1. Steel
- 3.2. Super Alloys
- 3.3. Superconducting Magnets and Capacitors
- 3.4. Batteries
- 3.5. Other Applications
-
4. End-user Industry
- 4.1. Construction
- 4.2. Automotive and Shipbuilding
- 4.3. Aerospace and Defense
- 4.4. Oil and Gas
- 4.5. Other End-user Industries
Niobium Market Segmentation By Geography
-
1. Asia Pacific
- 1.1. China
- 1.2. India
- 1.3. Japan
- 1.4. South Korea
- 1.5. Rest of Asia Pacific
-
2. North America
- 2.1. United States
- 2.2. Canada
- 2.3. Mexico
-
3. Europe
- 3.1. Germany
- 3.2. United Kingdom
- 3.3. Russia
- 3.4. Italy
- 3.5. Rest of Europe
-
4. South America
- 4.1. Brazil
- 4.2. Argentina
- 4.3. Rest of South America
-
5. Middle East and Africa
- 5.1. Saudi Arabia
- 5.2. South Africa
- 5.3. Rest of Middle East and Africa
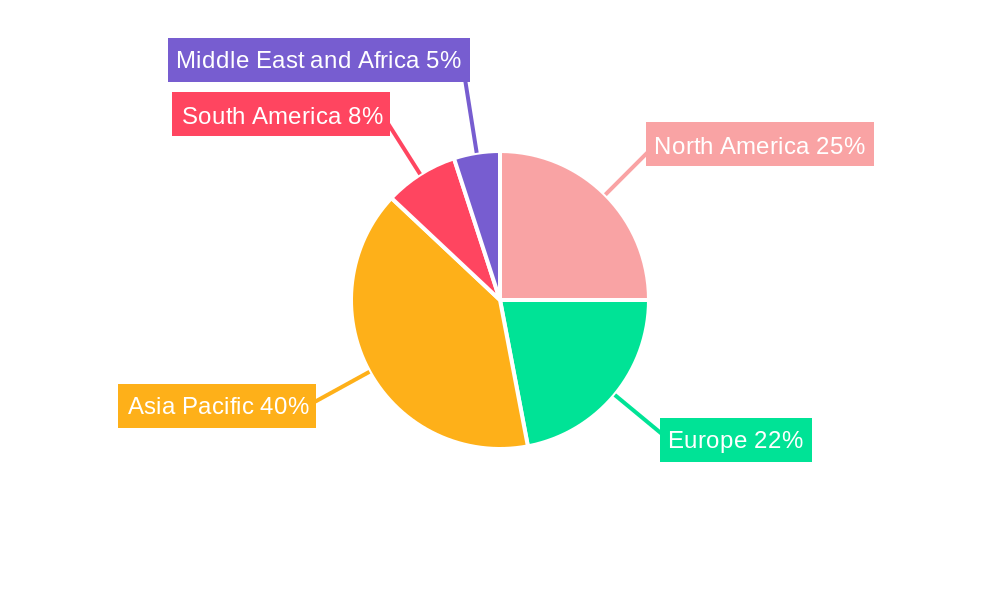
Niobium Market Regional Market Share
Geographic Coverage of Niobium Market
Niobium Market REPORT HIGHLIGHTS
| Aspects | Details |
|---|---|
| Study Period | 2020-2034 |
| Base Year | 2025 |
| Estimated Year | 2026 |
| Forecast Period | 2026-2034 |
| Historical Period | 2020-2025 |
| Growth Rate | CAGR of 3.9% from 2020-2034 |
| Segmentation |
|
Table of Contents
- 1. Introduction
- 1.1. Research Scope
- 1.2. Market Segmentation
- 1.3. Research Objective
- 1.4. Definitions and Assumptions
- 2. Executive Summary
- 2.1. Market Snapshot
- 3. Market Dynamics
- 3.1. Market Drivers
- 3.2. Market Restrains
- 3.3. Market Trends
- 3.4. Market Opportunities
- 4. Market Factor Analysis
- 4.1. Porters Five Forces
- 4.1.1. Bargaining Power of Suppliers
- 4.1.2. Bargaining Power of Buyers
- 4.1.3. Threat of New Entrants
- 4.1.4. Threat of Substitutes
- 4.1.5. Competitive Rivalry
- 4.2. PESTEL analysis
- 4.3. BCG Analysis
- 4.3.1. Stars (High Growth, High Market Share)
- 4.3.2. Cash Cows (Low Growth, High Market Share)
- 4.3.3. Question Mark (High Growth, Low Market Share)
- 4.3.4. Dogs (Low Growth, Low Market Share)
- 4.4. Ansoff Matrix Analysis
- 4.5. Supply Chain Analysis
- 4.6. Regulatory Landscape
- 4.7. Current Market Potential and Opportunity Assessment (TAM–SAM–SOM Framework)
- 4.8. IMR Analyst Note
- 4.1. Porters Five Forces
- 5. Market Analysis, Insights and Forecast 2021-2033
- 5.1. Market Analysis, Insights and Forecast - by Occurrence
- 5.1.1. Carbonatites and Associates
- 5.1.2. Columbite-Tantalite
- 5.2. Market Analysis, Insights and Forecast - by Type
- 5.2.1. Ferroniobium
- 5.2.2. Niobium Oxide
- 5.2.3. Niobium Metal
- 5.2.4. Vacuum-Grade Niobium Alloys
- 5.3. Market Analysis, Insights and Forecast - by Application
- 5.3.1. Steel
- 5.3.2. Super Alloys
- 5.3.3. Superconducting Magnets and Capacitors
- 5.3.4. Batteries
- 5.3.5. Other Applications
- 5.4. Market Analysis, Insights and Forecast - by End-user Industry
- 5.4.1. Construction
- 5.4.2. Automotive and Shipbuilding
- 5.4.3. Aerospace and Defense
- 5.4.4. Oil and Gas
- 5.4.5. Other End-user Industries
- 5.5. Market Analysis, Insights and Forecast - by Region
- 5.5.1. Asia Pacific
- 5.5.2. North America
- 5.5.3. Europe
- 5.5.4. South America
- 5.5.5. Middle East and Africa
- 5.1. Market Analysis, Insights and Forecast - by Occurrence
- 6. Global Niobium Market Analysis, Insights and Forecast, 2021-2033
- 6.1. Market Analysis, Insights and Forecast - by Occurrence
- 6.1.1. Carbonatites and Associates
- 6.1.2. Columbite-Tantalite
- 6.2. Market Analysis, Insights and Forecast - by Type
- 6.2.1. Ferroniobium
- 6.2.2. Niobium Oxide
- 6.2.3. Niobium Metal
- 6.2.4. Vacuum-Grade Niobium Alloys
- 6.3. Market Analysis, Insights and Forecast - by Application
- 6.3.1. Steel
- 6.3.2. Super Alloys
- 6.3.3. Superconducting Magnets and Capacitors
- 6.3.4. Batteries
- 6.3.5. Other Applications
- 6.4. Market Analysis, Insights and Forecast - by End-user Industry
- 6.4.1. Construction
- 6.4.2. Automotive and Shipbuilding
- 6.4.3. Aerospace and Defense
- 6.4.4. Oil and Gas
- 6.4.5. Other End-user Industries
- 6.1. Market Analysis, Insights and Forecast - by Occurrence
- 7. Asia Pacific Niobium Market Analysis, Insights and Forecast, 2020-2032
- 7.1. Market Analysis, Insights and Forecast - by Occurrence
- 7.1.1. Carbonatites and Associates
- 7.1.2. Columbite-Tantalite
- 7.2. Market Analysis, Insights and Forecast - by Type
- 7.2.1. Ferroniobium
- 7.2.2. Niobium Oxide
- 7.2.3. Niobium Metal
- 7.2.4. Vacuum-Grade Niobium Alloys
- 7.3. Market Analysis, Insights and Forecast - by Application
- 7.3.1. Steel
- 7.3.2. Super Alloys
- 7.3.3. Superconducting Magnets and Capacitors
- 7.3.4. Batteries
- 7.3.5. Other Applications
- 7.4. Market Analysis, Insights and Forecast - by End-user Industry
- 7.4.1. Construction
- 7.4.2. Automotive and Shipbuilding
- 7.4.3. Aerospace and Defense
- 7.4.4. Oil and Gas
- 7.4.5. Other End-user Industries
- 7.1. Market Analysis, Insights and Forecast - by Occurrence
- 8. North America Niobium Market Analysis, Insights and Forecast, 2020-2032
- 8.1. Market Analysis, Insights and Forecast - by Occurrence
- 8.1.1. Carbonatites and Associates
- 8.1.2. Columbite-Tantalite
- 8.2. Market Analysis, Insights and Forecast - by Type
- 8.2.1. Ferroniobium
- 8.2.2. Niobium Oxide
- 8.2.3. Niobium Metal
- 8.2.4. Vacuum-Grade Niobium Alloys
- 8.3. Market Analysis, Insights and Forecast - by Application
- 8.3.1. Steel
- 8.3.2. Super Alloys
- 8.3.3. Superconducting Magnets and Capacitors
- 8.3.4. Batteries
- 8.3.5. Other Applications
- 8.4. Market Analysis, Insights and Forecast - by End-user Industry
- 8.4.1. Construction
- 8.4.2. Automotive and Shipbuilding
- 8.4.3. Aerospace and Defense
- 8.4.4. Oil and Gas
- 8.4.5. Other End-user Industries
- 8.1. Market Analysis, Insights and Forecast - by Occurrence
- 9. Europe Niobium Market Analysis, Insights and Forecast, 2020-2032
- 9.1. Market Analysis, Insights and Forecast - by Occurrence
- 9.1.1. Carbonatites and Associates
- 9.1.2. Columbite-Tantalite
- 9.2. Market Analysis, Insights and Forecast - by Type
- 9.2.1. Ferroniobium
- 9.2.2. Niobium Oxide
- 9.2.3. Niobium Metal
- 9.2.4. Vacuum-Grade Niobium Alloys
- 9.3. Market Analysis, Insights and Forecast - by Application
- 9.3.1. Steel
- 9.3.2. Super Alloys
- 9.3.3. Superconducting Magnets and Capacitors
- 9.3.4. Batteries
- 9.3.5. Other Applications
- 9.4. Market Analysis, Insights and Forecast - by End-user Industry
- 9.4.1. Construction
- 9.4.2. Automotive and Shipbuilding
- 9.4.3. Aerospace and Defense
- 9.4.4. Oil and Gas
- 9.4.5. Other End-user Industries
- 9.1. Market Analysis, Insights and Forecast - by Occurrence
- 10. South America Niobium Market Analysis, Insights and Forecast, 2020-2032
- 10.1. Market Analysis, Insights and Forecast - by Occurrence
- 10.1.1. Carbonatites and Associates
- 10.1.2. Columbite-Tantalite
- 10.2. Market Analysis, Insights and Forecast - by Type
- 10.2.1. Ferroniobium
- 10.2.2. Niobium Oxide
- 10.2.3. Niobium Metal
- 10.2.4. Vacuum-Grade Niobium Alloys
- 10.3. Market Analysis, Insights and Forecast - by Application
- 10.3.1. Steel
- 10.3.2. Super Alloys
- 10.3.3. Superconducting Magnets and Capacitors
- 10.3.4. Batteries
- 10.3.5. Other Applications
- 10.4. Market Analysis, Insights and Forecast - by End-user Industry
- 10.4.1. Construction
- 10.4.2. Automotive and Shipbuilding
- 10.4.3. Aerospace and Defense
- 10.4.4. Oil and Gas
- 10.4.5. Other End-user Industries
- 10.1. Market Analysis, Insights and Forecast - by Occurrence
- 11. Middle East and Africa Niobium Market Analysis, Insights and Forecast, 2020-2032
- 11.1. Market Analysis, Insights and Forecast - by Occurrence
- 11.1.1. Carbonatites and Associates
- 11.1.2. Columbite-Tantalite
- 11.2. Market Analysis, Insights and Forecast - by Type
- 11.2.1. Ferroniobium
- 11.2.2. Niobium Oxide
- 11.2.3. Niobium Metal
- 11.2.4. Vacuum-Grade Niobium Alloys
- 11.3. Market Analysis, Insights and Forecast - by Application
- 11.3.1. Steel
- 11.3.2. Super Alloys
- 11.3.3. Superconducting Magnets and Capacitors
- 11.3.4. Batteries
- 11.3.5. Other Applications
- 11.4. Market Analysis, Insights and Forecast - by End-user Industry
- 11.4.1. Construction
- 11.4.2. Automotive and Shipbuilding
- 11.4.3. Aerospace and Defense
- 11.4.4. Oil and Gas
- 11.4.5. Other End-user Industries
- 11.1. Market Analysis, Insights and Forecast - by Occurrence
- 12. Competitive Analysis
- 12.1. Company Profiles
- 12.1.1 Grandview Materials
- 12.1.1.1. Company Overview
- 12.1.1.2. Products
- 12.1.1.3. Company Financials
- 12.1.1.4. SWOT Analysis
- 12.1.2 Titanex GmbH*List Not Exhaustive
- 12.1.2.1. Company Overview
- 12.1.2.2. Products
- 12.1.2.3. Company Financials
- 12.1.2.4. SWOT Analysis
- 12.1.3 CMOC
- 12.1.3.1. Company Overview
- 12.1.3.2. Products
- 12.1.3.3. Company Financials
- 12.1.3.4. SWOT Analysis
- 12.1.4 NioCorp Development Ltd
- 12.1.4.1. Company Overview
- 12.1.4.2. Products
- 12.1.4.3. Company Financials
- 12.1.4.4. SWOT Analysis
- 12.1.5 Magris Performance Materials
- 12.1.5.1. Company Overview
- 12.1.5.2. Products
- 12.1.5.3. Company Financials
- 12.1.5.4. SWOT Analysis
- 12.1.6 Changsha South Tantalum Niobium Co Ltd
- 12.1.6.1. Company Overview
- 12.1.6.2. Products
- 12.1.6.3. Company Financials
- 12.1.6.4. SWOT Analysis
- 12.1.7 Admat Inc
- 12.1.7.1. Company Overview
- 12.1.7.2. Products
- 12.1.7.3. Company Financials
- 12.1.7.4. SWOT Analysis
- 12.1.8 Australian Strategic Materials Ltd
- 12.1.8.1. Company Overview
- 12.1.8.2. Products
- 12.1.8.3. Company Financials
- 12.1.8.4. SWOT Analysis
- 12.1.9 CBMM
- 12.1.9.1. Company Overview
- 12.1.9.2. Products
- 12.1.9.3. Company Financials
- 12.1.9.4. SWOT Analysis
- 12.1.1 Grandview Materials
- 12.2. Market Entropy
- 12.2.1 Company's Key Areas Served
- 12.2.2 Recent Developments
- 12.3. Company Market Share Analysis 2025
- 12.3.1 Top 5 Companies Market Share Analysis
- 12.3.2 Top 3 Companies Market Share Analysis
- 12.4. List of Potential Customers
- 13. Research Methodology
List of Figures
- Figure 1: Global Niobium Market Revenue Breakdown (million, %) by Region 2025 & 2033
- Figure 2: Global Niobium Market Volume Breakdown (kilotons, %) by Region 2025 & 2033
- Figure 3: Asia Pacific Niobium Market Revenue (million), by Occurrence 2025 & 2033
- Figure 4: Asia Pacific Niobium Market Volume (kilotons), by Occurrence 2025 & 2033
- Figure 5: Asia Pacific Niobium Market Revenue Share (%), by Occurrence 2025 & 2033
- Figure 6: Asia Pacific Niobium Market Volume Share (%), by Occurrence 2025 & 2033
- Figure 7: Asia Pacific Niobium Market Revenue (million), by Type 2025 & 2033
- Figure 8: Asia Pacific Niobium Market Volume (kilotons), by Type 2025 & 2033
- Figure 9: Asia Pacific Niobium Market Revenue Share (%), by Type 2025 & 2033
- Figure 10: Asia Pacific Niobium Market Volume Share (%), by Type 2025 & 2033
- Figure 11: Asia Pacific Niobium Market Revenue (million), by Application 2025 & 2033
- Figure 12: Asia Pacific Niobium Market Volume (kilotons), by Application 2025 & 2033
- Figure 13: Asia Pacific Niobium Market Revenue Share (%), by Application 2025 & 2033
- Figure 14: Asia Pacific Niobium Market Volume Share (%), by Application 2025 & 2033
- Figure 15: Asia Pacific Niobium Market Revenue (million), by End-user Industry 2025 & 2033
- Figure 16: Asia Pacific Niobium Market Volume (kilotons), by End-user Industry 2025 & 2033
- Figure 17: Asia Pacific Niobium Market Revenue Share (%), by End-user Industry 2025 & 2033
- Figure 18: Asia Pacific Niobium Market Volume Share (%), by End-user Industry 2025 & 2033
- Figure 19: Asia Pacific Niobium Market Revenue (million), by Country 2025 & 2033
- Figure 20: Asia Pacific Niobium Market Volume (kilotons), by Country 2025 & 2033
- Figure 21: Asia Pacific Niobium Market Revenue Share (%), by Country 2025 & 2033
- Figure 22: Asia Pacific Niobium Market Volume Share (%), by Country 2025 & 2033
- Figure 23: North America Niobium Market Revenue (million), by Occurrence 2025 & 2033
- Figure 24: North America Niobium Market Volume (kilotons), by Occurrence 2025 & 2033
- Figure 25: North America Niobium Market Revenue Share (%), by Occurrence 2025 & 2033
- Figure 26: North America Niobium Market Volume Share (%), by Occurrence 2025 & 2033
- Figure 27: North America Niobium Market Revenue (million), by Type 2025 & 2033
- Figure 28: North America Niobium Market Volume (kilotons), by Type 2025 & 2033
- Figure 29: North America Niobium Market Revenue Share (%), by Type 2025 & 2033
- Figure 30: North America Niobium Market Volume Share (%), by Type 2025 & 2033
- Figure 31: North America Niobium Market Revenue (million), by Application 2025 & 2033
- Figure 32: North America Niobium Market Volume (kilotons), by Application 2025 & 2033
- Figure 33: North America Niobium Market Revenue Share (%), by Application 2025 & 2033
- Figure 34: North America Niobium Market Volume Share (%), by Application 2025 & 2033
- Figure 35: North America Niobium Market Revenue (million), by End-user Industry 2025 & 2033
- Figure 36: North America Niobium Market Volume (kilotons), by End-user Industry 2025 & 2033
- Figure 37: North America Niobium Market Revenue Share (%), by End-user Industry 2025 & 2033
- Figure 38: North America Niobium Market Volume Share (%), by End-user Industry 2025 & 2033
- Figure 39: North America Niobium Market Revenue (million), by Country 2025 & 2033
- Figure 40: North America Niobium Market Volume (kilotons), by Country 2025 & 2033
- Figure 41: North America Niobium Market Revenue Share (%), by Country 2025 & 2033
- Figure 42: North America Niobium Market Volume Share (%), by Country 2025 & 2033
- Figure 43: Europe Niobium Market Revenue (million), by Occurrence 2025 & 2033
- Figure 44: Europe Niobium Market Volume (kilotons), by Occurrence 2025 & 2033
- Figure 45: Europe Niobium Market Revenue Share (%), by Occurrence 2025 & 2033
- Figure 46: Europe Niobium Market Volume Share (%), by Occurrence 2025 & 2033
- Figure 47: Europe Niobium Market Revenue (million), by Type 2025 & 2033
- Figure 48: Europe Niobium Market Volume (kilotons), by Type 2025 & 2033
- Figure 49: Europe Niobium Market Revenue Share (%), by Type 2025 & 2033
- Figure 50: Europe Niobium Market Volume Share (%), by Type 2025 & 2033
- Figure 51: Europe Niobium Market Revenue (million), by Application 2025 & 2033
- Figure 52: Europe Niobium Market Volume (kilotons), by Application 2025 & 2033
- Figure 53: Europe Niobium Market Revenue Share (%), by Application 2025 & 2033
- Figure 54: Europe Niobium Market Volume Share (%), by Application 2025 & 2033
- Figure 55: Europe Niobium Market Revenue (million), by End-user Industry 2025 & 2033
- Figure 56: Europe Niobium Market Volume (kilotons), by End-user Industry 2025 & 2033
- Figure 57: Europe Niobium Market Revenue Share (%), by End-user Industry 2025 & 2033
- Figure 58: Europe Niobium Market Volume Share (%), by End-user Industry 2025 & 2033
- Figure 59: Europe Niobium Market Revenue (million), by Country 2025 & 2033
- Figure 60: Europe Niobium Market Volume (kilotons), by Country 2025 & 2033
- Figure 61: Europe Niobium Market Revenue Share (%), by Country 2025 & 2033
- Figure 62: Europe Niobium Market Volume Share (%), by Country 2025 & 2033
- Figure 63: South America Niobium Market Revenue (million), by Occurrence 2025 & 2033
- Figure 64: South America Niobium Market Volume (kilotons), by Occurrence 2025 & 2033
- Figure 65: South America Niobium Market Revenue Share (%), by Occurrence 2025 & 2033
- Figure 66: South America Niobium Market Volume Share (%), by Occurrence 2025 & 2033
- Figure 67: South America Niobium Market Revenue (million), by Type 2025 & 2033
- Figure 68: South America Niobium Market Volume (kilotons), by Type 2025 & 2033
- Figure 69: South America Niobium Market Revenue Share (%), by Type 2025 & 2033
- Figure 70: South America Niobium Market Volume Share (%), by Type 2025 & 2033
- Figure 71: South America Niobium Market Revenue (million), by Application 2025 & 2033
- Figure 72: South America Niobium Market Volume (kilotons), by Application 2025 & 2033
- Figure 73: South America Niobium Market Revenue Share (%), by Application 2025 & 2033
- Figure 74: South America Niobium Market Volume Share (%), by Application 2025 & 2033
- Figure 75: South America Niobium Market Revenue (million), by End-user Industry 2025 & 2033
- Figure 76: South America Niobium Market Volume (kilotons), by End-user Industry 2025 & 2033
- Figure 77: South America Niobium Market Revenue Share (%), by End-user Industry 2025 & 2033
- Figure 78: South America Niobium Market Volume Share (%), by End-user Industry 2025 & 2033
- Figure 79: South America Niobium Market Revenue (million), by Country 2025 & 2033
- Figure 80: South America Niobium Market Volume (kilotons), by Country 2025 & 2033
- Figure 81: South America Niobium Market Revenue Share (%), by Country 2025 & 2033
- Figure 82: South America Niobium Market Volume Share (%), by Country 2025 & 2033
- Figure 83: Middle East and Africa Niobium Market Revenue (million), by Occurrence 2025 & 2033
- Figure 84: Middle East and Africa Niobium Market Volume (kilotons), by Occurrence 2025 & 2033
- Figure 85: Middle East and Africa Niobium Market Revenue Share (%), by Occurrence 2025 & 2033
- Figure 86: Middle East and Africa Niobium Market Volume Share (%), by Occurrence 2025 & 2033
- Figure 87: Middle East and Africa Niobium Market Revenue (million), by Type 2025 & 2033
- Figure 88: Middle East and Africa Niobium Market Volume (kilotons), by Type 2025 & 2033
- Figure 89: Middle East and Africa Niobium Market Revenue Share (%), by Type 2025 & 2033
- Figure 90: Middle East and Africa Niobium Market Volume Share (%), by Type 2025 & 2033
- Figure 91: Middle East and Africa Niobium Market Revenue (million), by Application 2025 & 2033
- Figure 92: Middle East and Africa Niobium Market Volume (kilotons), by Application 2025 & 2033
- Figure 93: Middle East and Africa Niobium Market Revenue Share (%), by Application 2025 & 2033
- Figure 94: Middle East and Africa Niobium Market Volume Share (%), by Application 2025 & 2033
- Figure 95: Middle East and Africa Niobium Market Revenue (million), by End-user Industry 2025 & 2033
- Figure 96: Middle East and Africa Niobium Market Volume (kilotons), by End-user Industry 2025 & 2033
- Figure 97: Middle East and Africa Niobium Market Revenue Share (%), by End-user Industry 2025 & 2033
- Figure 98: Middle East and Africa Niobium Market Volume Share (%), by End-user Industry 2025 & 2033
- Figure 99: Middle East and Africa Niobium Market Revenue (million), by Country 2025 & 2033
- Figure 100: Middle East and Africa Niobium Market Volume (kilotons), by Country 2025 & 2033
- Figure 101: Middle East and Africa Niobium Market Revenue Share (%), by Country 2025 & 2033
- Figure 102: Middle East and Africa Niobium Market Volume Share (%), by Country 2025 & 2033
List of Tables
- Table 1: Global Niobium Market Revenue million Forecast, by Occurrence 2020 & 2033
- Table 2: Global Niobium Market Volume kilotons Forecast, by Occurrence 2020 & 2033
- Table 3: Global Niobium Market Revenue million Forecast, by Type 2020 & 2033
- Table 4: Global Niobium Market Volume kilotons Forecast, by Type 2020 & 2033
- Table 5: Global Niobium Market Revenue million Forecast, by Application 2020 & 2033
- Table 6: Global Niobium Market Volume kilotons Forecast, by Application 2020 & 2033
- Table 7: Global Niobium Market Revenue million Forecast, by End-user Industry 2020 & 2033
- Table 8: Global Niobium Market Volume kilotons Forecast, by End-user Industry 2020 & 2033
- Table 9: Global Niobium Market Revenue million Forecast, by Region 2020 & 2033
- Table 10: Global Niobium Market Volume kilotons Forecast, by Region 2020 & 2033
- Table 11: Global Niobium Market Revenue million Forecast, by Occurrence 2020 & 2033
- Table 12: Global Niobium Market Volume kilotons Forecast, by Occurrence 2020 & 2033
- Table 13: Global Niobium Market Revenue million Forecast, by Type 2020 & 2033
- Table 14: Global Niobium Market Volume kilotons Forecast, by Type 2020 & 2033
- Table 15: Global Niobium Market Revenue million Forecast, by Application 2020 & 2033
- Table 16: Global Niobium Market Volume kilotons Forecast, by Application 2020 & 2033
- Table 17: Global Niobium Market Revenue million Forecast, by End-user Industry 2020 & 2033
- Table 18: Global Niobium Market Volume kilotons Forecast, by End-user Industry 2020 & 2033
- Table 19: Global Niobium Market Revenue million Forecast, by Country 2020 & 2033
- Table 20: Global Niobium Market Volume kilotons Forecast, by Country 2020 & 2033
- Table 21: China Niobium Market Revenue (million) Forecast, by Application 2020 & 2033
- Table 22: China Niobium Market Volume (kilotons) Forecast, by Application 2020 & 2033
- Table 23: India Niobium Market Revenue (million) Forecast, by Application 2020 & 2033
- Table 24: India Niobium Market Volume (kilotons) Forecast, by Application 2020 & 2033
- Table 25: Japan Niobium Market Revenue (million) Forecast, by Application 2020 & 2033
- Table 26: Japan Niobium Market Volume (kilotons) Forecast, by Application 2020 & 2033
- Table 27: South Korea Niobium Market Revenue (million) Forecast, by Application 2020 & 2033
- Table 28: South Korea Niobium Market Volume (kilotons) Forecast, by Application 2020 & 2033
- Table 29: Rest of Asia Pacific Niobium Market Revenue (million) Forecast, by Application 2020 & 2033
- Table 30: Rest of Asia Pacific Niobium Market Volume (kilotons) Forecast, by Application 2020 & 2033
- Table 31: Global Niobium Market Revenue million Forecast, by Occurrence 2020 & 2033
- Table 32: Global Niobium Market Volume kilotons Forecast, by Occurrence 2020 & 2033
- Table 33: Global Niobium Market Revenue million Forecast, by Type 2020 & 2033
- Table 34: Global Niobium Market Volume kilotons Forecast, by Type 2020 & 2033
- Table 35: Global Niobium Market Revenue million Forecast, by Application 2020 & 2033
- Table 36: Global Niobium Market Volume kilotons Forecast, by Application 2020 & 2033
- Table 37: Global Niobium Market Revenue million Forecast, by End-user Industry 2020 & 2033
- Table 38: Global Niobium Market Volume kilotons Forecast, by End-user Industry 2020 & 2033
- Table 39: Global Niobium Market Revenue million Forecast, by Country 2020 & 2033
- Table 40: Global Niobium Market Volume kilotons Forecast, by Country 2020 & 2033
- Table 41: United States Niobium Market Revenue (million) Forecast, by Application 2020 & 2033
- Table 42: United States Niobium Market Volume (kilotons) Forecast, by Application 2020 & 2033
- Table 43: Canada Niobium Market Revenue (million) Forecast, by Application 2020 & 2033
- Table 44: Canada Niobium Market Volume (kilotons) Forecast, by Application 2020 & 2033
- Table 45: Mexico Niobium Market Revenue (million) Forecast, by Application 2020 & 2033
- Table 46: Mexico Niobium Market Volume (kilotons) Forecast, by Application 2020 & 2033
- Table 47: Global Niobium Market Revenue million Forecast, by Occurrence 2020 & 2033
- Table 48: Global Niobium Market Volume kilotons Forecast, by Occurrence 2020 & 2033
- Table 49: Global Niobium Market Revenue million Forecast, by Type 2020 & 2033
- Table 50: Global Niobium Market Volume kilotons Forecast, by Type 2020 & 2033
- Table 51: Global Niobium Market Revenue million Forecast, by Application 2020 & 2033
- Table 52: Global Niobium Market Volume kilotons Forecast, by Application 2020 & 2033
- Table 53: Global Niobium Market Revenue million Forecast, by End-user Industry 2020 & 2033
- Table 54: Global Niobium Market Volume kilotons Forecast, by End-user Industry 2020 & 2033
- Table 55: Global Niobium Market Revenue million Forecast, by Country 2020 & 2033
- Table 56: Global Niobium Market Volume kilotons Forecast, by Country 2020 & 2033
- Table 57: Germany Niobium Market Revenue (million) Forecast, by Application 2020 & 2033
- Table 58: Germany Niobium Market Volume (kilotons) Forecast, by Application 2020 & 2033
- Table 59: United Kingdom Niobium Market Revenue (million) Forecast, by Application 2020 & 2033
- Table 60: United Kingdom Niobium Market Volume (kilotons) Forecast, by Application 2020 & 2033
- Table 61: Russia Niobium Market Revenue (million) Forecast, by Application 2020 & 2033
- Table 62: Russia Niobium Market Volume (kilotons) Forecast, by Application 2020 & 2033
- Table 63: Italy Niobium Market Revenue (million) Forecast, by Application 2020 & 2033
- Table 64: Italy Niobium Market Volume (kilotons) Forecast, by Application 2020 & 2033
- Table 65: Rest of Europe Niobium Market Revenue (million) Forecast, by Application 2020 & 2033
- Table 66: Rest of Europe Niobium Market Volume (kilotons) Forecast, by Application 2020 & 2033
- Table 67: Global Niobium Market Revenue million Forecast, by Occurrence 2020 & 2033
- Table 68: Global Niobium Market Volume kilotons Forecast, by Occurrence 2020 & 2033
- Table 69: Global Niobium Market Revenue million Forecast, by Type 2020 & 2033
- Table 70: Global Niobium Market Volume kilotons Forecast, by Type 2020 & 2033
- Table 71: Global Niobium Market Revenue million Forecast, by Application 2020 & 2033
- Table 72: Global Niobium Market Volume kilotons Forecast, by Application 2020 & 2033
- Table 73: Global Niobium Market Revenue million Forecast, by End-user Industry 2020 & 2033
- Table 74: Global Niobium Market Volume kilotons Forecast, by End-user Industry 2020 & 2033
- Table 75: Global Niobium Market Revenue million Forecast, by Country 2020 & 2033
- Table 76: Global Niobium Market Volume kilotons Forecast, by Country 2020 & 2033
- Table 77: Brazil Niobium Market Revenue (million) Forecast, by Application 2020 & 2033
- Table 78: Brazil Niobium Market Volume (kilotons) Forecast, by Application 2020 & 2033
- Table 79: Argentina Niobium Market Revenue (million) Forecast, by Application 2020 & 2033
- Table 80: Argentina Niobium Market Volume (kilotons) Forecast, by Application 2020 & 2033
- Table 81: Rest of South America Niobium Market Revenue (million) Forecast, by Application 2020 & 2033
- Table 82: Rest of South America Niobium Market Volume (kilotons) Forecast, by Application 2020 & 2033
- Table 83: Global Niobium Market Revenue million Forecast, by Occurrence 2020 & 2033
- Table 84: Global Niobium Market Volume kilotons Forecast, by Occurrence 2020 & 2033
- Table 85: Global Niobium Market Revenue million Forecast, by Type 2020 & 2033
- Table 86: Global Niobium Market Volume kilotons Forecast, by Type 2020 & 2033
- Table 87: Global Niobium Market Revenue million Forecast, by Application 2020 & 2033
- Table 88: Global Niobium Market Volume kilotons Forecast, by Application 2020 & 2033
- Table 89: Global Niobium Market Revenue million Forecast, by End-user Industry 2020 & 2033
- Table 90: Global Niobium Market Volume kilotons Forecast, by End-user Industry 2020 & 2033
- Table 91: Global Niobium Market Revenue million Forecast, by Country 2020 & 2033
- Table 92: Global Niobium Market Volume kilotons Forecast, by Country 2020 & 2033
- Table 93: Saudi Arabia Niobium Market Revenue (million) Forecast, by Application 2020 & 2033
- Table 94: Saudi Arabia Niobium Market Volume (kilotons) Forecast, by Application 2020 & 2033
- Table 95: South Africa Niobium Market Revenue (million) Forecast, by Application 2020 & 2033
- Table 96: South Africa Niobium Market Volume (kilotons) Forecast, by Application 2020 & 2033
- Table 97: Rest of Middle East and Africa Niobium Market Revenue (million) Forecast, by Application 2020 & 2033
- Table 98: Rest of Middle East and Africa Niobium Market Volume (kilotons) Forecast, by Application 2020 & 2033
Frequently Asked Questions
1. What is the projected Compound Annual Growth Rate (CAGR) of the Niobium Market?
The projected CAGR is approximately 3.9%.
2. Which companies are prominent players in the Niobium Market?
Key companies in the market include Grandview Materials, Titanex GmbH*List Not Exhaustive, CMOC, NioCorp Development Ltd, Magris Performance Materials, Changsha South Tantalum Niobium Co Ltd, Admat Inc, Australian Strategic Materials Ltd, CBMM.
3. What are the main segments of the Niobium Market?
The market segments include Occurrence, Type, Application, End-user Industry.
4. Can you provide details about the market size?
The market size is estimated to be USD 1409 million as of 2022.
5. What are some drivers contributing to market growth?
Accelerating Usage in Structural Steel; Growing Demand for Lighter-Weight and More Fuel-Efficient Vehicles.
6. What are the notable trends driving market growth?
Construction Sector to Dominate the Market.
7. Are there any restraints impacting market growth?
Limited Supply Sources; Concerns About Health Issues on Acute Exposure.
8. Can you provide examples of recent developments in the market?
December 2022: CBMM announced a significant investment of USD 80 million to expand its niobium oxide capacity from 500 tons to 3,000 tons by 2024. Collaborating with Echion Technologies, CBMM plans to establish a niobium oxide facility at its Araxá plant in Minas Gerais, Brazil, aligning with its goal of achieving a niobium oxide capacity of 40,000 tons by 2030.
9. What pricing options are available for accessing the report?
Pricing options include single-user, multi-user, and enterprise licenses priced at USD 4750, USD 5250, and USD 8750 respectively.
10. Is the market size provided in terms of value or volume?
The market size is provided in terms of value, measured in million and volume, measured in kilotons.
11. Are there any specific market keywords associated with the report?
Yes, the market keyword associated with the report is "Niobium Market," which aids in identifying and referencing the specific market segment covered.
12. How do I determine which pricing option suits my needs best?
The pricing options vary based on user requirements and access needs. Individual users may opt for single-user licenses, while businesses requiring broader access may choose multi-user or enterprise licenses for cost-effective access to the report.
13. Are there any additional resources or data provided in the Niobium Market report?
While the report offers comprehensive insights, it's advisable to review the specific contents or supplementary materials provided to ascertain if additional resources or data are available.
14. How can I stay updated on further developments or reports in the Niobium Market?
To stay informed about further developments, trends, and reports in the Niobium Market, consider subscribing to industry newsletters, following relevant companies and organizations, or regularly checking reputable industry news sources and publications.
Methodology
Step 1 - Identification of Relevant Samples Size from Population Database


Step 2 - Approaches for Defining Global Market Size (Value, Volume* & Price*)

Note*: In applicable scenarios
Step 3 - Data Sources
Primary Research
- Web Analytics
- Survey Reports
- Research Institute
- Latest Research Reports
- Opinion Leaders
Secondary Research
- Annual Reports
- White Paper
- Latest Press Release
- Industry Association
- Paid Database
- Investor Presentations

Step 4 - Data Triangulation
Involves using different sources of information in order to increase the validity of a study
These sources are likely to be stakeholders in a program - participants, other researchers, program staff, other community members, and so on.
Then we put all data in single framework & apply various statistical tools to find out the dynamic on the market.
During the analysis stage, feedback from the stakeholder groups would be compared to determine areas of agreement as well as areas of divergence