

Key Insights
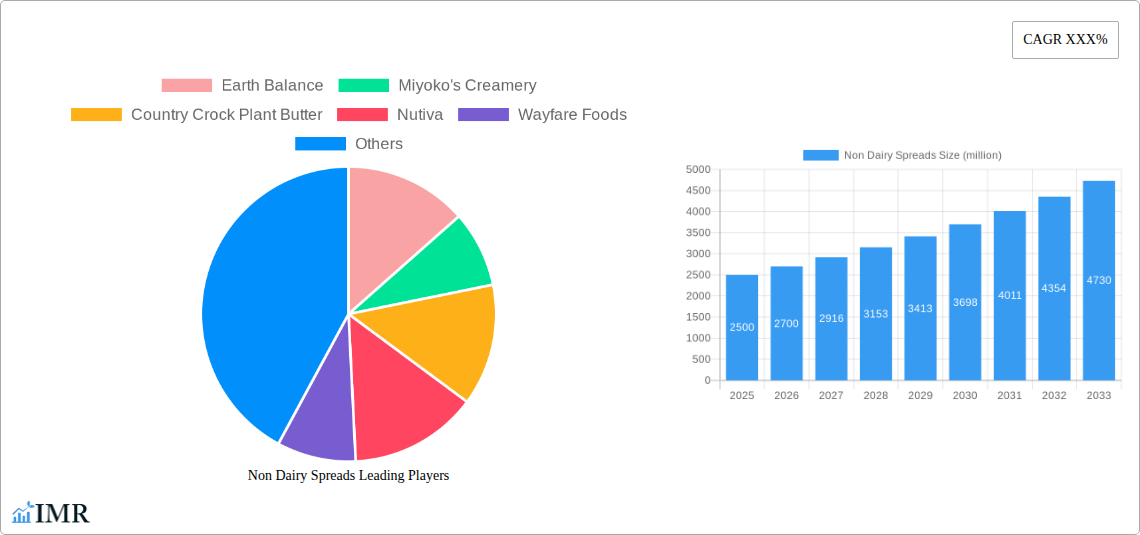
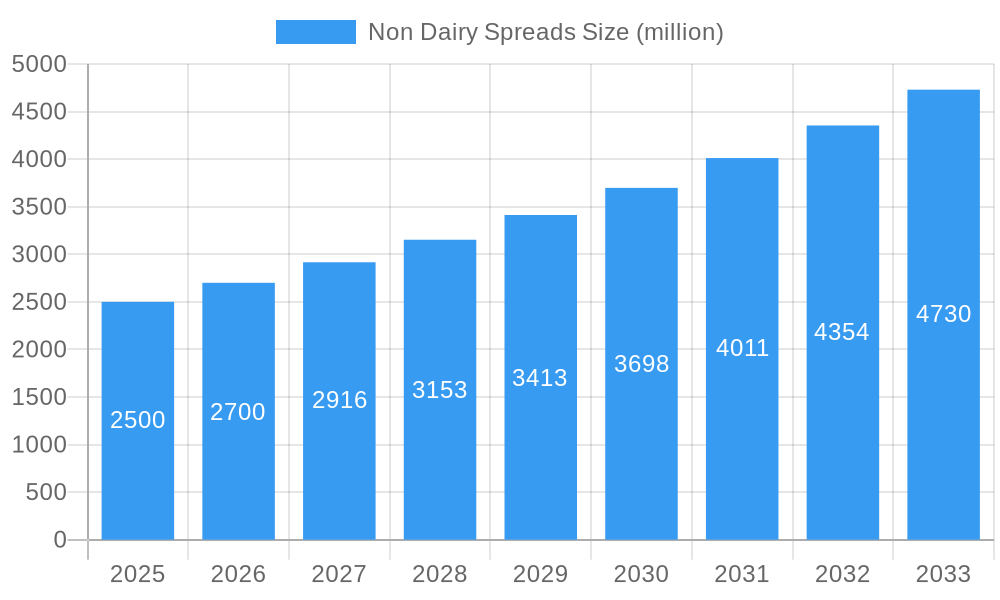
The non-dairy spread market is experiencing robust growth, driven by increasing consumer demand for plant-based alternatives to traditional dairy products. This surge is fueled by several key factors: rising health consciousness, the growing popularity of vegan and vegetarian diets, concerns about lactose intolerance and dairy allergies, and a heightened awareness of the environmental impact of dairy farming. The market is segmented by product type (e.g., margarine, butter alternatives, cream cheese alternatives), distribution channels (retail, foodservice), and geography. Major players like Earth Balance, Miyoko's Creamery, and Country Crock Plant Butter are actively innovating to cater to evolving consumer preferences, introducing products with improved taste, texture, and nutritional profiles. This includes incorporating functional ingredients like omega-3 fatty acids and probiotics. The competitive landscape is dynamic, with established brands facing competition from smaller, specialized players focusing on niche markets and organic or sustainably sourced ingredients. While pricing remains a factor, the premiumization of the market is evident as consumers prioritize quality and health benefits. We estimate the market size in 2025 to be approximately $2.5 billion, projecting a Compound Annual Growth Rate (CAGR) of 8% from 2025 to 2033, driven primarily by continued expansion in North America and Europe.
Non Dairy Spreads Market Size (In Billion)
The future of the non-dairy spread market hinges on several key trends: the increasing adoption of flexitarian diets (part-time vegetarianism), the development of more sustainable and ethically sourced ingredients, and a focus on reducing environmental impact throughout the supply chain. Regulatory changes and labeling requirements will also play a significant role. Opportunities exist for brands to leverage technological advancements to enhance product quality and expand distribution channels, while addressing concerns regarding the sustainability and cost-effectiveness of production methods. Furthermore, increased research and development focused on replicating the taste and texture of dairy products with plant-based alternatives are crucial for continued market penetration and growth. Challenges include maintaining cost competitiveness while upholding product quality and addressing consumer perceptions regarding taste and texture differences compared to traditional dairy spreads.
Non Dairy Spreads Company Market Share
Non Dairy Spreads Market Report: 2019-2033
This comprehensive report provides an in-depth analysis of the non-dairy spreads market, encompassing market dynamics, growth trends, regional performance, product landscape, and key players. The study period covers 2019-2033, with a base year of 2025 and a forecast period of 2025-2033. The report leverages extensive primary and secondary research to deliver actionable insights for industry professionals, investors, and stakeholders. This report focuses on the parent market of plant-based foods and the child market of non-dairy spreads.
Non Dairy Spreads Market Dynamics & Structure
This section analyzes the competitive landscape, technological advancements, regulatory influences, and market trends within the non-dairy spreads industry. We examine market concentration, identifying key players and their market share, and analyzing mergers and acquisitions (M&A) activity. The report quantifies the impact of technological innovation on product development and market expansion. Furthermore, it explores the influence of regulatory frameworks and the presence of competitive substitutes on market growth. End-user demographics and their evolving preferences are also considered, providing a holistic understanding of the market's structure.
- Market Concentration: The market is characterized by a mix of large established players and smaller niche brands. The top 5 players account for approximately xx% of the market (2025).
- Technological Innovation: Key innovations include advancements in taste and texture mimicking dairy spreads, sustainable sourcing of ingredients, and extended shelf-life technologies. The barriers to innovation include high R&D costs and the need for specialized manufacturing processes.
- Regulatory Framework: Government regulations regarding labeling, ingredient sourcing, and health claims significantly impact the market. Changes in regulations, especially those related to plant-based labeling, are expected to influence market dynamics.
- Competitive Substitutes: Traditional dairy spreads remain the primary competitor, while other plant-based spreads (e.g., nut butters) also compete for market share.
- M&A Activity: An average of xx M&A deals were recorded annually during the historical period (2019-2024), indicating a moderate level of consolidation.
Non Dairy Spreads Growth Trends & Insights
This section details the evolution of the non-dairy spreads market, examining growth rates, market penetration, and the influence of technological disruptions. Consumer behavior shifts, including increased health consciousness and adoption of plant-based diets, are key drivers analyzed in detail, revealing changing preferences and their market impact. Specific metrics, such as CAGR and market penetration rates, offer a quantitative understanding of market evolution. The report delves into the influence of technological advancements, such as improved manufacturing processes and innovative product formulations, on market expansion.
(This section would contain 600 words of analysis based on the provided data source (XXX), including detailed CAGR and market penetration figures.) The predicted market size for 2025 is xx million units and is expected to reach xx million units by 2033.
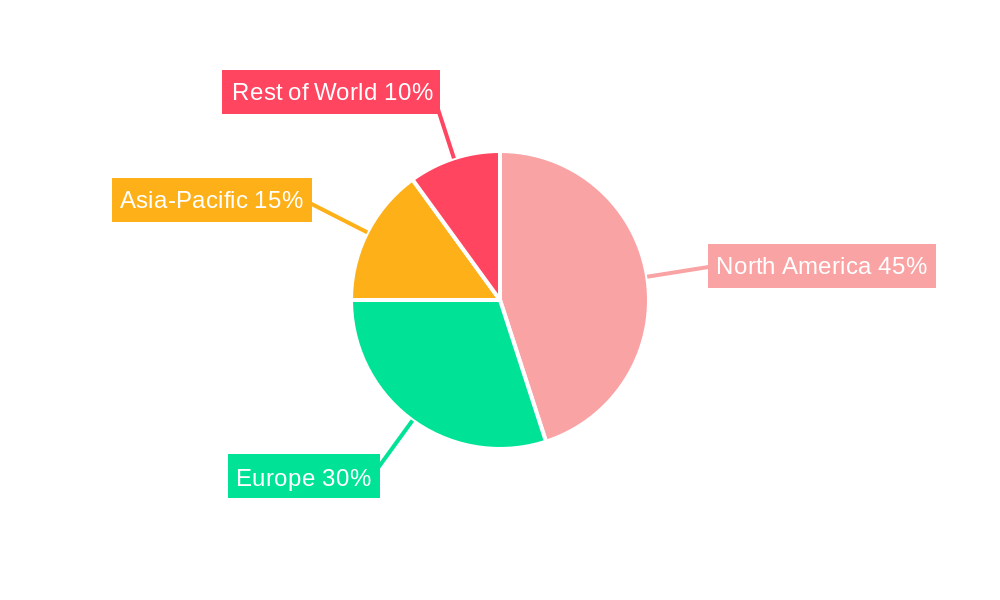
Dominant Regions, Countries, or Segments in Non Dairy Spreads
This section identifies the leading regions and segments driving market growth, analyzing their respective market shares and growth potentials. Key factors contributing to regional dominance are explored in detail, considering economic policies, infrastructure development, consumer preferences, and regulatory environments. The analysis will include specific market size data by region and segmentation to illustrate these trends.
(This section would contain 600 words of analysis detailing leading regions, countries and segments including market share and growth projections, supported by bullet points highlighting key regional drivers.) For example, North America is expected to be a leading region due to xx.
Non Dairy Spreads Product Landscape
This section offers a concise overview of product innovations, applications, and performance metrics within the non-dairy spreads market. It highlights unique selling propositions (USPs), including improvements in taste, texture, and nutritional value. Technological advancements driving product development are also discussed, alongside examples of innovative products and their market impact.
(This section will contain 100-150 words providing an overview of the product landscape, including details on innovative products and their market performance.)
Key Drivers, Barriers & Challenges in Non Dairy Spreads
This section outlines the key factors driving market growth, encompassing technological advancements, economic conditions, and favorable government policies. Conversely, it will also analyze key barriers and challenges that hinder market expansion. These challenges include supply chain disruptions, regulatory hurdles, and competitive pressures. The report quantifies the impact of these challenges on market growth using specific examples.
- Key Drivers: Increased consumer demand for plant-based alternatives, technological advancements leading to improved product quality, and rising awareness of the health benefits of non-dairy spreads.
- Key Challenges: Fluctuations in raw material prices, stringent regulatory requirements, and intense competition from established and emerging players. These challenges could lead to a xx% reduction in projected market growth by 2033.
(Each section on drivers and challenges will contain approximately 150 words.)
Emerging Opportunities in Non Dairy Spreads
This section highlights emerging trends and opportunities within the non-dairy spreads market. It focuses on untapped market segments, innovative applications, and evolving consumer preferences. The report identifies areas where future growth is expected, providing insights into potential market expansion strategies.
(This section will contain approximately 150 words.)
Growth Accelerators in the Non Dairy Spreads Industry
This section discusses factors that will drive long-term growth in the non-dairy spreads industry, including technological breakthroughs, strategic partnerships, and market expansion strategies. The emphasis will be on sustained and impactful market growth drivers.
(This section will contain approximately 150 words.)
Key Players Shaping the Non Dairy Spreads Market
- Earth Balance
- Miyoko's Creamery
- Country Crock Plant Butter
- Nutiva
- Wayfare Foods
- Melt Organic
- Follow Your Heart
- NuttZo
- Forager Project
- Pure Blends
- Artisana Organics
Notable Milestones in Non Dairy Spreads Sector
(This section will contain a bulleted list of notable milestones with dates and a brief description of their impact.) For example: * 2022-Q3: Launch of a new vegan butter product with improved taste and texture by Miyoko's Creamery.
In-Depth Non Dairy Spreads Market Outlook
This section summarizes the key growth accelerators and provides an overview of the future market potential and strategic opportunities within the non-dairy spreads industry. It emphasizes the long-term outlook and potential for significant market expansion.
(This section will contain approximately 150 words summarizing the overall market outlook and key future trends.)
Non Dairy Spreads Segmentation
-
1. Application
- 1.1. Supermarket
- 1.2. Specialty Store
- 1.3. Online Sales
- 1.4. Other
-
2. Type
- 2.1. Vegan Butter
- 2.2. Nut and Seed Butter
- 2.3. Coconut Oil Spread
- 2.4. Plant Cream Cheese
- 2.5. Other
Non Dairy Spreads Segmentation By Geography
-
1. North America
- 1.1. United States
- 1.2. Canada
- 1.3. Mexico
-
2. South America
- 2.1. Brazil
- 2.2. Argentina
- 2.3. Rest of South America
-
3. Europe
- 3.1. United Kingdom
- 3.2. Germany
- 3.3. France
- 3.4. Italy
- 3.5. Spain
- 3.6. Russia
- 3.7. Benelux
- 3.8. Nordics
- 3.9. Rest of Europe
-
4. Middle East & Africa
- 4.1. Turkey
- 4.2. Israel
- 4.3. GCC
- 4.4. North Africa
- 4.5. South Africa
- 4.6. Rest of Middle East & Africa
-
5. Asia Pacific
- 5.1. China
- 5.2. India
- 5.3. Japan
- 5.4. South Korea
- 5.5. ASEAN
- 5.6. Oceania
- 5.7. Rest of Asia Pacific
Non Dairy Spreads Regional Market Share
Geographic Coverage of Non Dairy Spreads
Non Dairy Spreads REPORT HIGHLIGHTS
| Aspects | Details |
|---|---|
| Study Period | 2020-2034 |
| Base Year | 2025 |
| Estimated Year | 2026 |
| Forecast Period | 2026-2034 |
| Historical Period | 2020-2025 |
| Growth Rate | CAGR of XXX% from 2020-2034 |
| Segmentation |
|
Table of Contents
- 1. Introduction
- 1.1. Research Scope
- 1.2. Market Segmentation
- 1.3. Research Objective
- 1.4. Definitions and Assumptions
- 2. Executive Summary
- 2.1. Market Snapshot
- 3. Market Dynamics
- 3.1. Market Drivers
- 3.2. Market Restrains
- 3.3. Market Trends
- 3.4. Market Opportunities
- 4. Market Factor Analysis
- 4.1. Porters Five Forces
- 4.1.1. Bargaining Power of Suppliers
- 4.1.2. Bargaining Power of Buyers
- 4.1.3. Threat of New Entrants
- 4.1.4. Threat of Substitutes
- 4.1.5. Competitive Rivalry
- 4.2. PESTEL analysis
- 4.3. BCG Analysis
- 4.3.1. Stars (High Growth, High Market Share)
- 4.3.2. Cash Cows (Low Growth, High Market Share)
- 4.3.3. Question Mark (High Growth, Low Market Share)
- 4.3.4. Dogs (Low Growth, Low Market Share)
- 4.4. Ansoff Matrix Analysis
- 4.5. Supply Chain Analysis
- 4.6. Regulatory Landscape
- 4.7. Current Market Potential and Opportunity Assessment (TAM–SAM–SOM Framework)
- 4.8. IMR Analyst Note
- 4.1. Porters Five Forces
- 5. Market Analysis, Insights and Forecast 2021-2033
- 5.1. Market Analysis, Insights and Forecast - by Application
- 5.1.1. Supermarket
- 5.1.2. Specialty Store
- 5.1.3. Online Sales
- 5.1.4. Other
- 5.2. Market Analysis, Insights and Forecast - by Type
- 5.2.1. Vegan Butter
- 5.2.2. Nut and Seed Butter
- 5.2.3. Coconut Oil Spread
- 5.2.4. Plant Cream Cheese
- 5.2.5. Other
- 5.3. Market Analysis, Insights and Forecast - by Region
- 5.3.1. North America
- 5.3.2. South America
- 5.3.3. Europe
- 5.3.4. Middle East & Africa
- 5.3.5. Asia Pacific
- 5.1. Market Analysis, Insights and Forecast - by Application
- 6. Global Non Dairy Spreads Analysis, Insights and Forecast, 2021-2033
- 6.1. Market Analysis, Insights and Forecast - by Application
- 6.1.1. Supermarket
- 6.1.2. Specialty Store
- 6.1.3. Online Sales
- 6.1.4. Other
- 6.2. Market Analysis, Insights and Forecast - by Type
- 6.2.1. Vegan Butter
- 6.2.2. Nut and Seed Butter
- 6.2.3. Coconut Oil Spread
- 6.2.4. Plant Cream Cheese
- 6.2.5. Other
- 6.1. Market Analysis, Insights and Forecast - by Application
- 7. North America Non Dairy Spreads Analysis, Insights and Forecast, 2020-2032
- 7.1. Market Analysis, Insights and Forecast - by Application
- 7.1.1. Supermarket
- 7.1.2. Specialty Store
- 7.1.3. Online Sales
- 7.1.4. Other
- 7.2. Market Analysis, Insights and Forecast - by Type
- 7.2.1. Vegan Butter
- 7.2.2. Nut and Seed Butter
- 7.2.3. Coconut Oil Spread
- 7.2.4. Plant Cream Cheese
- 7.2.5. Other
- 7.1. Market Analysis, Insights and Forecast - by Application
- 8. South America Non Dairy Spreads Analysis, Insights and Forecast, 2020-2032
- 8.1. Market Analysis, Insights and Forecast - by Application
- 8.1.1. Supermarket
- 8.1.2. Specialty Store
- 8.1.3. Online Sales
- 8.1.4. Other
- 8.2. Market Analysis, Insights and Forecast - by Type
- 8.2.1. Vegan Butter
- 8.2.2. Nut and Seed Butter
- 8.2.3. Coconut Oil Spread
- 8.2.4. Plant Cream Cheese
- 8.2.5. Other
- 8.1. Market Analysis, Insights and Forecast - by Application
- 9. Europe Non Dairy Spreads Analysis, Insights and Forecast, 2020-2032
- 9.1. Market Analysis, Insights and Forecast - by Application
- 9.1.1. Supermarket
- 9.1.2. Specialty Store
- 9.1.3. Online Sales
- 9.1.4. Other
- 9.2. Market Analysis, Insights and Forecast - by Type
- 9.2.1. Vegan Butter
- 9.2.2. Nut and Seed Butter
- 9.2.3. Coconut Oil Spread
- 9.2.4. Plant Cream Cheese
- 9.2.5. Other
- 9.1. Market Analysis, Insights and Forecast - by Application
- 10. Middle East & Africa Non Dairy Spreads Analysis, Insights and Forecast, 2020-2032
- 10.1. Market Analysis, Insights and Forecast - by Application
- 10.1.1. Supermarket
- 10.1.2. Specialty Store
- 10.1.3. Online Sales
- 10.1.4. Other
- 10.2. Market Analysis, Insights and Forecast - by Type
- 10.2.1. Vegan Butter
- 10.2.2. Nut and Seed Butter
- 10.2.3. Coconut Oil Spread
- 10.2.4. Plant Cream Cheese
- 10.2.5. Other
- 10.1. Market Analysis, Insights and Forecast - by Application
- 11. Asia Pacific Non Dairy Spreads Analysis, Insights and Forecast, 2020-2032
- 11.1. Market Analysis, Insights and Forecast - by Application
- 11.1.1. Supermarket
- 11.1.2. Specialty Store
- 11.1.3. Online Sales
- 11.1.4. Other
- 11.2. Market Analysis, Insights and Forecast - by Type
- 11.2.1. Vegan Butter
- 11.2.2. Nut and Seed Butter
- 11.2.3. Coconut Oil Spread
- 11.2.4. Plant Cream Cheese
- 11.2.5. Other
- 11.1. Market Analysis, Insights and Forecast - by Application
- 12. Competitive Analysis
- 12.1. Company Profiles
- 12.1.1 Earth Balance
- 12.1.1.1. Company Overview
- 12.1.1.2. Products
- 12.1.1.3. Company Financials
- 12.1.1.4. SWOT Analysis
- 12.1.2 Miyoko's Creamery
- 12.1.2.1. Company Overview
- 12.1.2.2. Products
- 12.1.2.3. Company Financials
- 12.1.2.4. SWOT Analysis
- 12.1.3 Country Crock Plant Butter
- 12.1.3.1. Company Overview
- 12.1.3.2. Products
- 12.1.3.3. Company Financials
- 12.1.3.4. SWOT Analysis
- 12.1.4 Nutiva
- 12.1.4.1. Company Overview
- 12.1.4.2. Products
- 12.1.4.3. Company Financials
- 12.1.4.4. SWOT Analysis
- 12.1.5 Wayfare Foods
- 12.1.5.1. Company Overview
- 12.1.5.2. Products
- 12.1.5.3. Company Financials
- 12.1.5.4. SWOT Analysis
- 12.1.6 Melt Organic
- 12.1.6.1. Company Overview
- 12.1.6.2. Products
- 12.1.6.3. Company Financials
- 12.1.6.4. SWOT Analysis
- 12.1.7 Follow Your Heart
- 12.1.7.1. Company Overview
- 12.1.7.2. Products
- 12.1.7.3. Company Financials
- 12.1.7.4. SWOT Analysis
- 12.1.8 NuttZo
- 12.1.8.1. Company Overview
- 12.1.8.2. Products
- 12.1.8.3. Company Financials
- 12.1.8.4. SWOT Analysis
- 12.1.9 Forager Project
- 12.1.9.1. Company Overview
- 12.1.9.2. Products
- 12.1.9.3. Company Financials
- 12.1.9.4. SWOT Analysis
- 12.1.10 Pure Blends
- 12.1.10.1. Company Overview
- 12.1.10.2. Products
- 12.1.10.3. Company Financials
- 12.1.10.4. SWOT Analysis
- 12.1.11 Artisana Organics
- 12.1.11.1. Company Overview
- 12.1.11.2. Products
- 12.1.11.3. Company Financials
- 12.1.11.4. SWOT Analysis
- 12.1.1 Earth Balance
- 12.2. Market Entropy
- 12.2.1 Company's Key Areas Served
- 12.2.2 Recent Developments
- 12.3. Company Market Share Analysis 2025
- 12.3.1 Top 5 Companies Market Share Analysis
- 12.3.2 Top 3 Companies Market Share Analysis
- 12.4. List of Potential Customers
- 13. Research Methodology
List of Figures
- Figure 1: Global Non Dairy Spreads Revenue Breakdown (million, %) by Region 2025 & 2033
- Figure 2: Global Non Dairy Spreads Volume Breakdown (K, %) by Region 2025 & 2033
- Figure 3: North America Non Dairy Spreads Revenue (million), by Application 2025 & 2033
- Figure 4: North America Non Dairy Spreads Volume (K), by Application 2025 & 2033
- Figure 5: North America Non Dairy Spreads Revenue Share (%), by Application 2025 & 2033
- Figure 6: North America Non Dairy Spreads Volume Share (%), by Application 2025 & 2033
- Figure 7: North America Non Dairy Spreads Revenue (million), by Type 2025 & 2033
- Figure 8: North America Non Dairy Spreads Volume (K), by Type 2025 & 2033
- Figure 9: North America Non Dairy Spreads Revenue Share (%), by Type 2025 & 2033
- Figure 10: North America Non Dairy Spreads Volume Share (%), by Type 2025 & 2033
- Figure 11: North America Non Dairy Spreads Revenue (million), by Country 2025 & 2033
- Figure 12: North America Non Dairy Spreads Volume (K), by Country 2025 & 2033
- Figure 13: North America Non Dairy Spreads Revenue Share (%), by Country 2025 & 2033
- Figure 14: North America Non Dairy Spreads Volume Share (%), by Country 2025 & 2033
- Figure 15: South America Non Dairy Spreads Revenue (million), by Application 2025 & 2033
- Figure 16: South America Non Dairy Spreads Volume (K), by Application 2025 & 2033
- Figure 17: South America Non Dairy Spreads Revenue Share (%), by Application 2025 & 2033
- Figure 18: South America Non Dairy Spreads Volume Share (%), by Application 2025 & 2033
- Figure 19: South America Non Dairy Spreads Revenue (million), by Type 2025 & 2033
- Figure 20: South America Non Dairy Spreads Volume (K), by Type 2025 & 2033
- Figure 21: South America Non Dairy Spreads Revenue Share (%), by Type 2025 & 2033
- Figure 22: South America Non Dairy Spreads Volume Share (%), by Type 2025 & 2033
- Figure 23: South America Non Dairy Spreads Revenue (million), by Country 2025 & 2033
- Figure 24: South America Non Dairy Spreads Volume (K), by Country 2025 & 2033
- Figure 25: South America Non Dairy Spreads Revenue Share (%), by Country 2025 & 2033
- Figure 26: South America Non Dairy Spreads Volume Share (%), by Country 2025 & 2033
- Figure 27: Europe Non Dairy Spreads Revenue (million), by Application 2025 & 2033
- Figure 28: Europe Non Dairy Spreads Volume (K), by Application 2025 & 2033
- Figure 29: Europe Non Dairy Spreads Revenue Share (%), by Application 2025 & 2033
- Figure 30: Europe Non Dairy Spreads Volume Share (%), by Application 2025 & 2033
- Figure 31: Europe Non Dairy Spreads Revenue (million), by Type 2025 & 2033
- Figure 32: Europe Non Dairy Spreads Volume (K), by Type 2025 & 2033
- Figure 33: Europe Non Dairy Spreads Revenue Share (%), by Type 2025 & 2033
- Figure 34: Europe Non Dairy Spreads Volume Share (%), by Type 2025 & 2033
- Figure 35: Europe Non Dairy Spreads Revenue (million), by Country 2025 & 2033
- Figure 36: Europe Non Dairy Spreads Volume (K), by Country 2025 & 2033
- Figure 37: Europe Non Dairy Spreads Revenue Share (%), by Country 2025 & 2033
- Figure 38: Europe Non Dairy Spreads Volume Share (%), by Country 2025 & 2033
- Figure 39: Middle East & Africa Non Dairy Spreads Revenue (million), by Application 2025 & 2033
- Figure 40: Middle East & Africa Non Dairy Spreads Volume (K), by Application 2025 & 2033
- Figure 41: Middle East & Africa Non Dairy Spreads Revenue Share (%), by Application 2025 & 2033
- Figure 42: Middle East & Africa Non Dairy Spreads Volume Share (%), by Application 2025 & 2033
- Figure 43: Middle East & Africa Non Dairy Spreads Revenue (million), by Type 2025 & 2033
- Figure 44: Middle East & Africa Non Dairy Spreads Volume (K), by Type 2025 & 2033
- Figure 45: Middle East & Africa Non Dairy Spreads Revenue Share (%), by Type 2025 & 2033
- Figure 46: Middle East & Africa Non Dairy Spreads Volume Share (%), by Type 2025 & 2033
- Figure 47: Middle East & Africa Non Dairy Spreads Revenue (million), by Country 2025 & 2033
- Figure 48: Middle East & Africa Non Dairy Spreads Volume (K), by Country 2025 & 2033
- Figure 49: Middle East & Africa Non Dairy Spreads Revenue Share (%), by Country 2025 & 2033
- Figure 50: Middle East & Africa Non Dairy Spreads Volume Share (%), by Country 2025 & 2033
- Figure 51: Asia Pacific Non Dairy Spreads Revenue (million), by Application 2025 & 2033
- Figure 52: Asia Pacific Non Dairy Spreads Volume (K), by Application 2025 & 2033
- Figure 53: Asia Pacific Non Dairy Spreads Revenue Share (%), by Application 2025 & 2033
- Figure 54: Asia Pacific Non Dairy Spreads Volume Share (%), by Application 2025 & 2033
- Figure 55: Asia Pacific Non Dairy Spreads Revenue (million), by Type 2025 & 2033
- Figure 56: Asia Pacific Non Dairy Spreads Volume (K), by Type 2025 & 2033
- Figure 57: Asia Pacific Non Dairy Spreads Revenue Share (%), by Type 2025 & 2033
- Figure 58: Asia Pacific Non Dairy Spreads Volume Share (%), by Type 2025 & 2033
- Figure 59: Asia Pacific Non Dairy Spreads Revenue (million), by Country 2025 & 2033
- Figure 60: Asia Pacific Non Dairy Spreads Volume (K), by Country 2025 & 2033
- Figure 61: Asia Pacific Non Dairy Spreads Revenue Share (%), by Country 2025 & 2033
- Figure 62: Asia Pacific Non Dairy Spreads Volume Share (%), by Country 2025 & 2033
List of Tables
- Table 1: Global Non Dairy Spreads Revenue million Forecast, by Application 2020 & 2033
- Table 2: Global Non Dairy Spreads Volume K Forecast, by Application 2020 & 2033
- Table 3: Global Non Dairy Spreads Revenue million Forecast, by Type 2020 & 2033
- Table 4: Global Non Dairy Spreads Volume K Forecast, by Type 2020 & 2033
- Table 5: Global Non Dairy Spreads Revenue million Forecast, by Region 2020 & 2033
- Table 6: Global Non Dairy Spreads Volume K Forecast, by Region 2020 & 2033
- Table 7: Global Non Dairy Spreads Revenue million Forecast, by Application 2020 & 2033
- Table 8: Global Non Dairy Spreads Volume K Forecast, by Application 2020 & 2033
- Table 9: Global Non Dairy Spreads Revenue million Forecast, by Type 2020 & 2033
- Table 10: Global Non Dairy Spreads Volume K Forecast, by Type 2020 & 2033
- Table 11: Global Non Dairy Spreads Revenue million Forecast, by Country 2020 & 2033
- Table 12: Global Non Dairy Spreads Volume K Forecast, by Country 2020 & 2033
- Table 13: United States Non Dairy Spreads Revenue (million) Forecast, by Application 2020 & 2033
- Table 14: United States Non Dairy Spreads Volume (K) Forecast, by Application 2020 & 2033
- Table 15: Canada Non Dairy Spreads Revenue (million) Forecast, by Application 2020 & 2033
- Table 16: Canada Non Dairy Spreads Volume (K) Forecast, by Application 2020 & 2033
- Table 17: Mexico Non Dairy Spreads Revenue (million) Forecast, by Application 2020 & 2033
- Table 18: Mexico Non Dairy Spreads Volume (K) Forecast, by Application 2020 & 2033
- Table 19: Global Non Dairy Spreads Revenue million Forecast, by Application 2020 & 2033
- Table 20: Global Non Dairy Spreads Volume K Forecast, by Application 2020 & 2033
- Table 21: Global Non Dairy Spreads Revenue million Forecast, by Type 2020 & 2033
- Table 22: Global Non Dairy Spreads Volume K Forecast, by Type 2020 & 2033
- Table 23: Global Non Dairy Spreads Revenue million Forecast, by Country 2020 & 2033
- Table 24: Global Non Dairy Spreads Volume K Forecast, by Country 2020 & 2033
- Table 25: Brazil Non Dairy Spreads Revenue (million) Forecast, by Application 2020 & 2033
- Table 26: Brazil Non Dairy Spreads Volume (K) Forecast, by Application 2020 & 2033
- Table 27: Argentina Non Dairy Spreads Revenue (million) Forecast, by Application 2020 & 2033
- Table 28: Argentina Non Dairy Spreads Volume (K) Forecast, by Application 2020 & 2033
- Table 29: Rest of South America Non Dairy Spreads Revenue (million) Forecast, by Application 2020 & 2033
- Table 30: Rest of South America Non Dairy Spreads Volume (K) Forecast, by Application 2020 & 2033
- Table 31: Global Non Dairy Spreads Revenue million Forecast, by Application 2020 & 2033
- Table 32: Global Non Dairy Spreads Volume K Forecast, by Application 2020 & 2033
- Table 33: Global Non Dairy Spreads Revenue million Forecast, by Type 2020 & 2033
- Table 34: Global Non Dairy Spreads Volume K Forecast, by Type 2020 & 2033
- Table 35: Global Non Dairy Spreads Revenue million Forecast, by Country 2020 & 2033
- Table 36: Global Non Dairy Spreads Volume K Forecast, by Country 2020 & 2033
- Table 37: United Kingdom Non Dairy Spreads Revenue (million) Forecast, by Application 2020 & 2033
- Table 38: United Kingdom Non Dairy Spreads Volume (K) Forecast, by Application 2020 & 2033
- Table 39: Germany Non Dairy Spreads Revenue (million) Forecast, by Application 2020 & 2033
- Table 40: Germany Non Dairy Spreads Volume (K) Forecast, by Application 2020 & 2033
- Table 41: France Non Dairy Spreads Revenue (million) Forecast, by Application 2020 & 2033
- Table 42: France Non Dairy Spreads Volume (K) Forecast, by Application 2020 & 2033
- Table 43: Italy Non Dairy Spreads Revenue (million) Forecast, by Application 2020 & 2033
- Table 44: Italy Non Dairy Spreads Volume (K) Forecast, by Application 2020 & 2033
- Table 45: Spain Non Dairy Spreads Revenue (million) Forecast, by Application 2020 & 2033
- Table 46: Spain Non Dairy Spreads Volume (K) Forecast, by Application 2020 & 2033
- Table 47: Russia Non Dairy Spreads Revenue (million) Forecast, by Application 2020 & 2033
- Table 48: Russia Non Dairy Spreads Volume (K) Forecast, by Application 2020 & 2033
- Table 49: Benelux Non Dairy Spreads Revenue (million) Forecast, by Application 2020 & 2033
- Table 50: Benelux Non Dairy Spreads Volume (K) Forecast, by Application 2020 & 2033
- Table 51: Nordics Non Dairy Spreads Revenue (million) Forecast, by Application 2020 & 2033
- Table 52: Nordics Non Dairy Spreads Volume (K) Forecast, by Application 2020 & 2033
- Table 53: Rest of Europe Non Dairy Spreads Revenue (million) Forecast, by Application 2020 & 2033
- Table 54: Rest of Europe Non Dairy Spreads Volume (K) Forecast, by Application 2020 & 2033
- Table 55: Global Non Dairy Spreads Revenue million Forecast, by Application 2020 & 2033
- Table 56: Global Non Dairy Spreads Volume K Forecast, by Application 2020 & 2033
- Table 57: Global Non Dairy Spreads Revenue million Forecast, by Type 2020 & 2033
- Table 58: Global Non Dairy Spreads Volume K Forecast, by Type 2020 & 2033
- Table 59: Global Non Dairy Spreads Revenue million Forecast, by Country 2020 & 2033
- Table 60: Global Non Dairy Spreads Volume K Forecast, by Country 2020 & 2033
- Table 61: Turkey Non Dairy Spreads Revenue (million) Forecast, by Application 2020 & 2033
- Table 62: Turkey Non Dairy Spreads Volume (K) Forecast, by Application 2020 & 2033
- Table 63: Israel Non Dairy Spreads Revenue (million) Forecast, by Application 2020 & 2033
- Table 64: Israel Non Dairy Spreads Volume (K) Forecast, by Application 2020 & 2033
- Table 65: GCC Non Dairy Spreads Revenue (million) Forecast, by Application 2020 & 2033
- Table 66: GCC Non Dairy Spreads Volume (K) Forecast, by Application 2020 & 2033
- Table 67: North Africa Non Dairy Spreads Revenue (million) Forecast, by Application 2020 & 2033
- Table 68: North Africa Non Dairy Spreads Volume (K) Forecast, by Application 2020 & 2033
- Table 69: South Africa Non Dairy Spreads Revenue (million) Forecast, by Application 2020 & 2033
- Table 70: South Africa Non Dairy Spreads Volume (K) Forecast, by Application 2020 & 2033
- Table 71: Rest of Middle East & Africa Non Dairy Spreads Revenue (million) Forecast, by Application 2020 & 2033
- Table 72: Rest of Middle East & Africa Non Dairy Spreads Volume (K) Forecast, by Application 2020 & 2033
- Table 73: Global Non Dairy Spreads Revenue million Forecast, by Application 2020 & 2033
- Table 74: Global Non Dairy Spreads Volume K Forecast, by Application 2020 & 2033
- Table 75: Global Non Dairy Spreads Revenue million Forecast, by Type 2020 & 2033
- Table 76: Global Non Dairy Spreads Volume K Forecast, by Type 2020 & 2033
- Table 77: Global Non Dairy Spreads Revenue million Forecast, by Country 2020 & 2033
- Table 78: Global Non Dairy Spreads Volume K Forecast, by Country 2020 & 2033
- Table 79: China Non Dairy Spreads Revenue (million) Forecast, by Application 2020 & 2033
- Table 80: China Non Dairy Spreads Volume (K) Forecast, by Application 2020 & 2033
- Table 81: India Non Dairy Spreads Revenue (million) Forecast, by Application 2020 & 2033
- Table 82: India Non Dairy Spreads Volume (K) Forecast, by Application 2020 & 2033
- Table 83: Japan Non Dairy Spreads Revenue (million) Forecast, by Application 2020 & 2033
- Table 84: Japan Non Dairy Spreads Volume (K) Forecast, by Application 2020 & 2033
- Table 85: South Korea Non Dairy Spreads Revenue (million) Forecast, by Application 2020 & 2033
- Table 86: South Korea Non Dairy Spreads Volume (K) Forecast, by Application 2020 & 2033
- Table 87: ASEAN Non Dairy Spreads Revenue (million) Forecast, by Application 2020 & 2033
- Table 88: ASEAN Non Dairy Spreads Volume (K) Forecast, by Application 2020 & 2033
- Table 89: Oceania Non Dairy Spreads Revenue (million) Forecast, by Application 2020 & 2033
- Table 90: Oceania Non Dairy Spreads Volume (K) Forecast, by Application 2020 & 2033
- Table 91: Rest of Asia Pacific Non Dairy Spreads Revenue (million) Forecast, by Application 2020 & 2033
- Table 92: Rest of Asia Pacific Non Dairy Spreads Volume (K) Forecast, by Application 2020 & 2033
Frequently Asked Questions
1. What is the projected Compound Annual Growth Rate (CAGR) of the Non Dairy Spreads?
The projected CAGR is approximately XXX%.
2. Which companies are prominent players in the Non Dairy Spreads?
Key companies in the market include Earth Balance, Miyoko's Creamery, Country Crock Plant Butter, Nutiva, Wayfare Foods, Melt Organic, Follow Your Heart, NuttZo, Forager Project, Pure Blends, Artisana Organics.
3. What are the main segments of the Non Dairy Spreads?
The market segments include Application, Type.
4. Can you provide details about the market size?
The market size is estimated to be USD XXX million as of 2022.
5. What are some drivers contributing to market growth?
N/A
6. What are the notable trends driving market growth?
N/A
7. Are there any restraints impacting market growth?
N/A
8. Can you provide examples of recent developments in the market?
N/A
9. What pricing options are available for accessing the report?
Pricing options include single-user, multi-user, and enterprise licenses priced at USD 3950.00, USD 5925.00, and USD 7900.00 respectively.
10. Is the market size provided in terms of value or volume?
The market size is provided in terms of value, measured in million and volume, measured in K.
11. Are there any specific market keywords associated with the report?
Yes, the market keyword associated with the report is "Non Dairy Spreads," which aids in identifying and referencing the specific market segment covered.
12. How do I determine which pricing option suits my needs best?
The pricing options vary based on user requirements and access needs. Individual users may opt for single-user licenses, while businesses requiring broader access may choose multi-user or enterprise licenses for cost-effective access to the report.
13. Are there any additional resources or data provided in the Non Dairy Spreads report?
While the report offers comprehensive insights, it's advisable to review the specific contents or supplementary materials provided to ascertain if additional resources or data are available.
14. How can I stay updated on further developments or reports in the Non Dairy Spreads?
To stay informed about further developments, trends, and reports in the Non Dairy Spreads, consider subscribing to industry newsletters, following relevant companies and organizations, or regularly checking reputable industry news sources and publications.
Methodology
Step 1 - Identification of Relevant Samples Size from Population Database


Step 2 - Approaches for Defining Global Market Size (Value, Volume* & Price*)

Note*: In applicable scenarios
Step 3 - Data Sources
Primary Research
- Web Analytics
- Survey Reports
- Research Institute
- Latest Research Reports
- Opinion Leaders
Secondary Research
- Annual Reports
- White Paper
- Latest Press Release
- Industry Association
- Paid Database
- Investor Presentations

Step 4 - Data Triangulation
Involves using different sources of information in order to increase the validity of a study
These sources are likely to be stakeholders in a program - participants, other researchers, program staff, other community members, and so on.
Then we put all data in single framework & apply various statistical tools to find out the dynamic on the market.
During the analysis stage, feedback from the stakeholder groups would be compared to determine areas of agreement as well as areas of divergence