

Key Insights
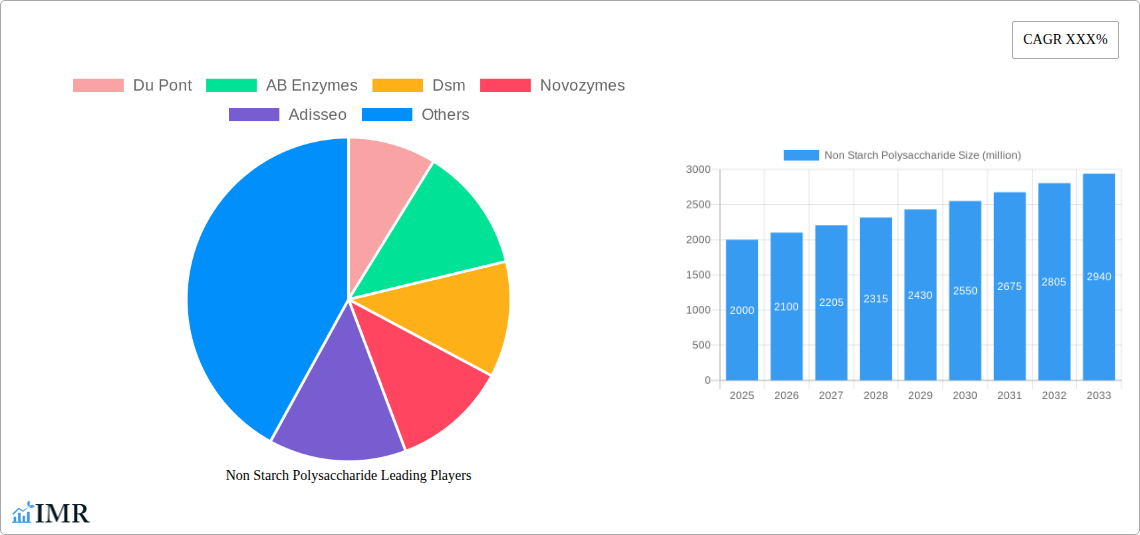
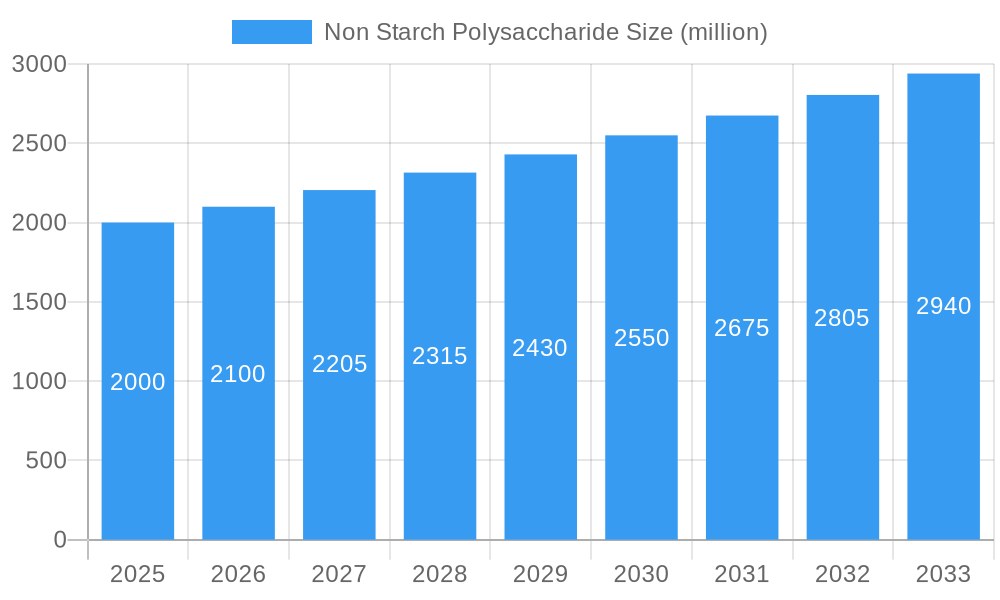
The global non-starch polysaccharide (NSP) market is experiencing robust growth, driven by increasing demand across diverse sectors. The market's expansion is fueled by the rising adoption of NSPs in food and feed applications due to their beneficial health properties, including improved gut health and enhanced nutrient absorption. The growing awareness of the importance of dietary fiber and the increasing prevalence of digestive health issues are significant factors driving this demand. Furthermore, the expanding animal feed industry, particularly in developing economies with burgeoning livestock populations, is creating substantial opportunities for NSP producers. Technological advancements in NSP extraction and processing are also contributing to market growth by improving efficiency and reducing costs. While precise market sizing data is unavailable, a reasonable estimation based on comparable markets and industry reports suggests the global NSP market size in 2025 may be around $2 billion, exhibiting a compound annual growth rate (CAGR) of approximately 5-7% for the forecast period of 2025-2033.
Non Starch Polysaccharide Market Size (In Billion)
Major players like DuPont, DSM, Novozymes, and BASF are actively investing in research and development to enhance NSP production and introduce innovative applications. However, the market also faces certain challenges. Fluctuations in raw material prices, stringent regulatory requirements for food and feed additives, and the potential for substitute ingredients can create market volatility. Segment-wise, the animal feed segment is expected to remain the largest contributor to market revenue, followed by the food and beverage sector. Geographic expansion is also a key aspect, with the Asia-Pacific region demonstrating promising growth potential given its expanding food and feed industries. Despite the challenges, the overall outlook for the NSP market remains positive, with consistent growth projected throughout the forecast period driven by health consciousness and industry innovation.
Non Starch Polysaccharide Company Market Share
Non Starch Polysaccharide (NSP) Market Report: 2019-2033
This comprehensive report provides a detailed analysis of the Non Starch Polysaccharide (NSP) market, encompassing market dynamics, growth trends, regional analysis, competitive landscape, and future outlook. The study period covers 2019-2033, with 2025 as the base year and forecast period from 2025-2033. This report is essential for industry professionals, investors, and researchers seeking to understand and capitalize on opportunities within this dynamic market. Parent markets include the food and feed additives industries, while key child markets are animal feed and food processing.
Non Starch Polysaccharide Market Dynamics & Structure
The Non Starch Polysaccharide (NSP) market is characterized by moderate concentration, with key players holding significant market share. The market size in 2025 is estimated at $XX billion. Technological innovation, particularly in enzymatic production methods, is a primary growth driver. Stringent regulatory frameworks regarding food safety and labeling influence product development and market access. Competitive substitutes include other dietary fibers, affecting market share dynamics. End-user demographics, especially the rising demand for functional foods and animal feed with improved nutritional profiles, shape market growth. M&A activity has been relatively low in recent years, with approximately XX deals recorded between 2019 and 2024, representing a total value of $XX billion.
- Market Concentration: Moderately concentrated, with top 5 players holding approximately 60% market share in 2025.
- Technological Innovation: Enzymatic production, fermentation technologies, and precision extraction methods are driving cost reduction and improved product quality.
- Regulatory Landscape: Stringent food safety regulations and labeling requirements impact market access and product formulation.
- Competitive Substitutes: Other dietary fibers, such as cellulose and inulin, pose competitive pressure.
- End-User Demographics: Growing health consciousness and demand for functional foods and enhanced animal feed are key growth drivers.
- M&A Activity: Low level of M&A activity in the recent past, indicating a relatively stable market structure.
Non Starch Polysaccharide Growth Trends & Insights
The Non Starch Polysaccharide market experienced steady growth during the historical period (2019-2024), with a CAGR of XX%. This growth is attributed to increasing consumer awareness of the health benefits of NSPs, coupled with their widespread applications in food and animal feed. The market is projected to witness robust expansion during the forecast period (2025-2033), driven by technological advancements and expanding applications. Market penetration in developing economies remains relatively low, presenting significant growth potential. Consumer preference towards natural and clean-label ingredients further fuels market demand. Technological disruptions, such as the development of novel extraction and processing techniques, contribute to improved product quality and cost-effectiveness.
- Market Size Evolution: From $XX billion in 2019 to an estimated $XX billion in 2025, with a projected value of $XX billion by 2033.
- Adoption Rates: Increasing adoption in food and animal feed applications, driven by growing health awareness and regulatory approvals.
- Technological Disruptions: Advancements in enzymatic production and extraction technologies leading to higher efficiency and lower costs.
- Consumer Behavior Shifts: Growing preference for natural, clean-label ingredients and functional foods driving market demand.
Dominant Regions, Countries, or Segments in Non Starch Polysaccharide
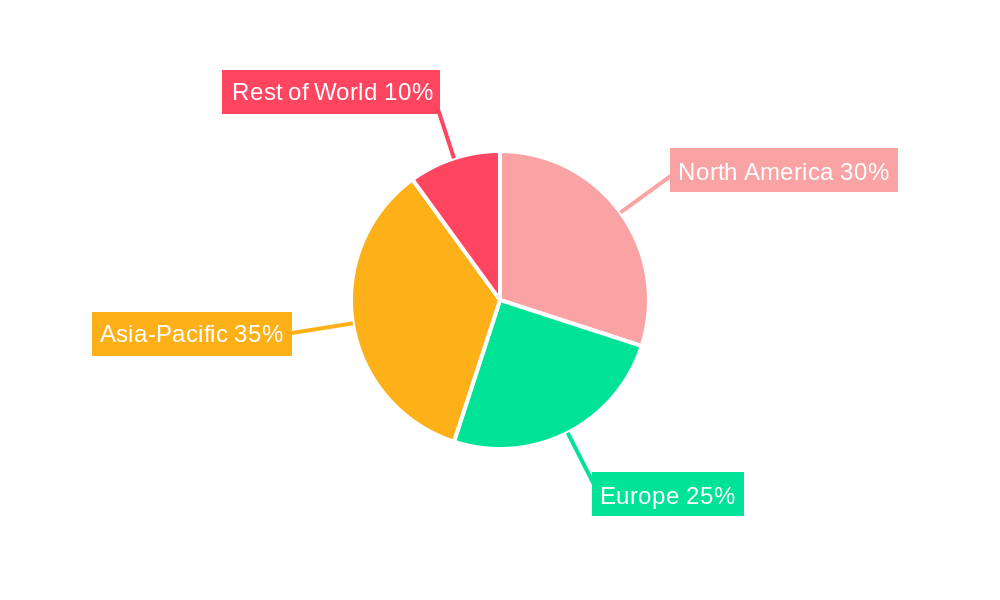
North America currently holds the largest market share for NSPs, driven by strong demand from the food and animal feed industries. Europe is a significant market, influenced by strict regulatory frameworks and consumer focus on health and nutrition. Asia-Pacific is expected to witness the fastest growth during the forecast period, fueled by rising disposable incomes and increasing awareness of the health benefits of NSPs.
- North America: High market share due to strong demand from food and animal feed industries, advanced infrastructure, and established regulatory frameworks.
- Europe: Significant market size driven by strict regulatory frameworks and consumer focus on healthy and functional foods.
- Asia-Pacific: Fastest-growing region, propelled by rising disposable incomes, increasing health awareness, and expanding food and animal feed sectors.
- Key Drivers: Government support for agriculture and food processing industries, expanding food and beverage industry, and favorable economic conditions in certain regions.
Non Starch Polysaccharide Product Landscape
The Non Starch Polysaccharide market encompasses a range of products derived from various sources, including cereals, legumes, and vegetables. These products are tailored for specific applications, offering diverse functionalities like improved texture, enhanced fiber content, and prebiotic properties. Technological advancements continue to drive the development of novel NSPs with improved functionalities and cost-effectiveness. Unique selling propositions include improved digestibility, enhanced bioavailability of nutrients, and contributions to gut health.
Key Drivers, Barriers & Challenges in Non Starch Polysaccharide
Key Drivers: Growing demand for functional foods, increasing awareness of health benefits, technological advancements, and supportive government policies for sustainable agriculture. For example, rising demand for natural and clean-label ingredients is a significant driver for NSP market growth.
Challenges & Restraints: Fluctuations in raw material prices, stringent regulatory compliance requirements, and competition from other dietary fibers can hinder market growth. Supply chain disruptions, especially during times of global crisis, can significantly impact market availability and price stability.
Emerging Opportunities in Non Starch Polysaccharide
Untapped markets in developing countries, particularly in the animal feed industry, offer significant growth potential. The development of novel NSP-based ingredients with tailored functionalities opens new avenues in various food and beverage applications. The growing interest in personalized nutrition and gut health positions NSPs as key ingredients in specialized dietary products.
Growth Accelerators in the Non Starch Polysaccharide Industry
Technological breakthroughs in enzymatic production and extraction, leading to cost reduction and improved product quality, are accelerating market growth. Strategic partnerships between NSP producers and food/feed manufacturers facilitate market penetration and product development. Expanding into new markets, particularly in developing countries, and focusing on specialized applications (e.g., dietary supplements, functional foods) further fuels growth.
Key Players Shaping the Non Starch Polysaccharide Market
- Du Pont
- AB Enzymes
- DSM
- Novozymes
- Adisseo
- Dyadic International
- Amano Enzyme Incorporated
- BASF
- Advanced Enzymes Technologies
- Alltech Inc
- Guolong Group
- Lanxing Adisseo
Notable Milestones in Non Starch Polysaccharide Sector
- 2020: Launch of a novel NSP-based ingredient with enhanced prebiotic properties by DSM.
- 2022: Acquisition of a smaller NSP producer by DuPont, expanding its product portfolio.
- 2023: Approval of a new NSP-based food additive by the FDA.
- 2024: Introduction of a sustainable and cost-effective NSP extraction method by a leading research institute.
In-Depth Non Starch Polysaccharide Market Outlook
The Non Starch Polysaccharide market is poised for continued growth, driven by technological innovation, expanding applications, and increasing consumer demand. Strategic partnerships, market expansion into emerging economies, and the development of novel NSP-based ingredients will shape future market dynamics. The market's potential lies in its ability to provide functional benefits in various food and feed applications, catering to the growing health and wellness conscious consumers.
Non Starch Polysaccharide Segmentation
-
1. Application
- 1.1. Food Additives
- 1.2. Chemical Materials
- 1.3. Other
-
2. Type
- 2.1. Cellulose
- 2.2. Other
Non Starch Polysaccharide Segmentation By Geography
-
1. North America
- 1.1. United States
- 1.2. Canada
- 1.3. Mexico
-
2. South America
- 2.1. Brazil
- 2.2. Argentina
- 2.3. Rest of South America
-
3. Europe
- 3.1. United Kingdom
- 3.2. Germany
- 3.3. France
- 3.4. Italy
- 3.5. Spain
- 3.6. Russia
- 3.7. Benelux
- 3.8. Nordics
- 3.9. Rest of Europe
-
4. Middle East & Africa
- 4.1. Turkey
- 4.2. Israel
- 4.3. GCC
- 4.4. North Africa
- 4.5. South Africa
- 4.6. Rest of Middle East & Africa
-
5. Asia Pacific
- 5.1. China
- 5.2. India
- 5.3. Japan
- 5.4. South Korea
- 5.5. ASEAN
- 5.6. Oceania
- 5.7. Rest of Asia Pacific
Non Starch Polysaccharide Regional Market Share
Geographic Coverage of Non Starch Polysaccharide
Non Starch Polysaccharide REPORT HIGHLIGHTS
| Aspects | Details |
|---|---|
| Study Period | 2020-2034 |
| Base Year | 2025 |
| Estimated Year | 2026 |
| Forecast Period | 2026-2034 |
| Historical Period | 2020-2025 |
| Growth Rate | CAGR of XXX% from 2020-2034 |
| Segmentation |
|
Table of Contents
- 1. Introduction
- 1.1. Research Scope
- 1.2. Market Segmentation
- 1.3. Research Objective
- 1.4. Definitions and Assumptions
- 2. Executive Summary
- 2.1. Market Snapshot
- 3. Market Dynamics
- 3.1. Market Drivers
- 3.2. Market Restrains
- 3.3. Market Trends
- 3.4. Market Opportunities
- 4. Market Factor Analysis
- 4.1. Porters Five Forces
- 4.1.1. Bargaining Power of Suppliers
- 4.1.2. Bargaining Power of Buyers
- 4.1.3. Threat of New Entrants
- 4.1.4. Threat of Substitutes
- 4.1.5. Competitive Rivalry
- 4.2. PESTEL analysis
- 4.3. BCG Analysis
- 4.3.1. Stars (High Growth, High Market Share)
- 4.3.2. Cash Cows (Low Growth, High Market Share)
- 4.3.3. Question Mark (High Growth, Low Market Share)
- 4.3.4. Dogs (Low Growth, Low Market Share)
- 4.4. Ansoff Matrix Analysis
- 4.5. Supply Chain Analysis
- 4.6. Regulatory Landscape
- 4.7. Current Market Potential and Opportunity Assessment (TAM–SAM–SOM Framework)
- 4.8. IMR Analyst Note
- 4.1. Porters Five Forces
- 5. Market Analysis, Insights and Forecast 2021-2033
- 5.1. Market Analysis, Insights and Forecast - by Application
- 5.1.1. Food Additives
- 5.1.2. Chemical Materials
- 5.1.3. Other
- 5.2. Market Analysis, Insights and Forecast - by Type
- 5.2.1. Cellulose
- 5.2.2. Other
- 5.3. Market Analysis, Insights and Forecast - by Region
- 5.3.1. North America
- 5.3.2. South America
- 5.3.3. Europe
- 5.3.4. Middle East & Africa
- 5.3.5. Asia Pacific
- 5.1. Market Analysis, Insights and Forecast - by Application
- 6. Global Non Starch Polysaccharide Analysis, Insights and Forecast, 2021-2033
- 6.1. Market Analysis, Insights and Forecast - by Application
- 6.1.1. Food Additives
- 6.1.2. Chemical Materials
- 6.1.3. Other
- 6.2. Market Analysis, Insights and Forecast - by Type
- 6.2.1. Cellulose
- 6.2.2. Other
- 6.1. Market Analysis, Insights and Forecast - by Application
- 7. North America Non Starch Polysaccharide Analysis, Insights and Forecast, 2020-2032
- 7.1. Market Analysis, Insights and Forecast - by Application
- 7.1.1. Food Additives
- 7.1.2. Chemical Materials
- 7.1.3. Other
- 7.2. Market Analysis, Insights and Forecast - by Type
- 7.2.1. Cellulose
- 7.2.2. Other
- 7.1. Market Analysis, Insights and Forecast - by Application
- 8. South America Non Starch Polysaccharide Analysis, Insights and Forecast, 2020-2032
- 8.1. Market Analysis, Insights and Forecast - by Application
- 8.1.1. Food Additives
- 8.1.2. Chemical Materials
- 8.1.3. Other
- 8.2. Market Analysis, Insights and Forecast - by Type
- 8.2.1. Cellulose
- 8.2.2. Other
- 8.1. Market Analysis, Insights and Forecast - by Application
- 9. Europe Non Starch Polysaccharide Analysis, Insights and Forecast, 2020-2032
- 9.1. Market Analysis, Insights and Forecast - by Application
- 9.1.1. Food Additives
- 9.1.2. Chemical Materials
- 9.1.3. Other
- 9.2. Market Analysis, Insights and Forecast - by Type
- 9.2.1. Cellulose
- 9.2.2. Other
- 9.1. Market Analysis, Insights and Forecast - by Application
- 10. Middle East & Africa Non Starch Polysaccharide Analysis, Insights and Forecast, 2020-2032
- 10.1. Market Analysis, Insights and Forecast - by Application
- 10.1.1. Food Additives
- 10.1.2. Chemical Materials
- 10.1.3. Other
- 10.2. Market Analysis, Insights and Forecast - by Type
- 10.2.1. Cellulose
- 10.2.2. Other
- 10.1. Market Analysis, Insights and Forecast - by Application
- 11. Asia Pacific Non Starch Polysaccharide Analysis, Insights and Forecast, 2020-2032
- 11.1. Market Analysis, Insights and Forecast - by Application
- 11.1.1. Food Additives
- 11.1.2. Chemical Materials
- 11.1.3. Other
- 11.2. Market Analysis, Insights and Forecast - by Type
- 11.2.1. Cellulose
- 11.2.2. Other
- 11.1. Market Analysis, Insights and Forecast - by Application
- 12. Competitive Analysis
- 12.1. Company Profiles
- 12.1.1 Du Pont
- 12.1.1.1. Company Overview
- 12.1.1.2. Products
- 12.1.1.3. Company Financials
- 12.1.1.4. SWOT Analysis
- 12.1.2 AB Enzymes
- 12.1.2.1. Company Overview
- 12.1.2.2. Products
- 12.1.2.3. Company Financials
- 12.1.2.4. SWOT Analysis
- 12.1.3 Dsm
- 12.1.3.1. Company Overview
- 12.1.3.2. Products
- 12.1.3.3. Company Financials
- 12.1.3.4. SWOT Analysis
- 12.1.4 Novozymes
- 12.1.4.1. Company Overview
- 12.1.4.2. Products
- 12.1.4.3. Company Financials
- 12.1.4.4. SWOT Analysis
- 12.1.5 Adisseo
- 12.1.5.1. Company Overview
- 12.1.5.2. Products
- 12.1.5.3. Company Financials
- 12.1.5.4. SWOT Analysis
- 12.1.6 Dyadic International
- 12.1.6.1. Company Overview
- 12.1.6.2. Products
- 12.1.6.3. Company Financials
- 12.1.6.4. SWOT Analysis
- 12.1.7 Amano Enzyme Incorporated
- 12.1.7.1. Company Overview
- 12.1.7.2. Products
- 12.1.7.3. Company Financials
- 12.1.7.4. SWOT Analysis
- 12.1.8 BASF
- 12.1.8.1. Company Overview
- 12.1.8.2. Products
- 12.1.8.3. Company Financials
- 12.1.8.4. SWOT Analysis
- 12.1.9 Advanced Enzymes Technologies
- 12.1.9.1. Company Overview
- 12.1.9.2. Products
- 12.1.9.3. Company Financials
- 12.1.9.4. SWOT Analysis
- 12.1.10 Alltech Inc
- 12.1.10.1. Company Overview
- 12.1.10.2. Products
- 12.1.10.3. Company Financials
- 12.1.10.4. SWOT Analysis
- 12.1.11 Guolong Group
- 12.1.11.1. Company Overview
- 12.1.11.2. Products
- 12.1.11.3. Company Financials
- 12.1.11.4. SWOT Analysis
- 12.1.12 Lanxing Adisseo
- 12.1.12.1. Company Overview
- 12.1.12.2. Products
- 12.1.12.3. Company Financials
- 12.1.12.4. SWOT Analysis
- 12.1.1 Du Pont
- 12.2. Market Entropy
- 12.2.1 Company's Key Areas Served
- 12.2.2 Recent Developments
- 12.3. Company Market Share Analysis 2025
- 12.3.1 Top 5 Companies Market Share Analysis
- 12.3.2 Top 3 Companies Market Share Analysis
- 12.4. List of Potential Customers
- 13. Research Methodology
List of Figures
- Figure 1: Global Non Starch Polysaccharide Revenue Breakdown (million, %) by Region 2025 & 2033
- Figure 2: Global Non Starch Polysaccharide Volume Breakdown (K, %) by Region 2025 & 2033
- Figure 3: North America Non Starch Polysaccharide Revenue (million), by Application 2025 & 2033
- Figure 4: North America Non Starch Polysaccharide Volume (K), by Application 2025 & 2033
- Figure 5: North America Non Starch Polysaccharide Revenue Share (%), by Application 2025 & 2033
- Figure 6: North America Non Starch Polysaccharide Volume Share (%), by Application 2025 & 2033
- Figure 7: North America Non Starch Polysaccharide Revenue (million), by Type 2025 & 2033
- Figure 8: North America Non Starch Polysaccharide Volume (K), by Type 2025 & 2033
- Figure 9: North America Non Starch Polysaccharide Revenue Share (%), by Type 2025 & 2033
- Figure 10: North America Non Starch Polysaccharide Volume Share (%), by Type 2025 & 2033
- Figure 11: North America Non Starch Polysaccharide Revenue (million), by Country 2025 & 2033
- Figure 12: North America Non Starch Polysaccharide Volume (K), by Country 2025 & 2033
- Figure 13: North America Non Starch Polysaccharide Revenue Share (%), by Country 2025 & 2033
- Figure 14: North America Non Starch Polysaccharide Volume Share (%), by Country 2025 & 2033
- Figure 15: South America Non Starch Polysaccharide Revenue (million), by Application 2025 & 2033
- Figure 16: South America Non Starch Polysaccharide Volume (K), by Application 2025 & 2033
- Figure 17: South America Non Starch Polysaccharide Revenue Share (%), by Application 2025 & 2033
- Figure 18: South America Non Starch Polysaccharide Volume Share (%), by Application 2025 & 2033
- Figure 19: South America Non Starch Polysaccharide Revenue (million), by Type 2025 & 2033
- Figure 20: South America Non Starch Polysaccharide Volume (K), by Type 2025 & 2033
- Figure 21: South America Non Starch Polysaccharide Revenue Share (%), by Type 2025 & 2033
- Figure 22: South America Non Starch Polysaccharide Volume Share (%), by Type 2025 & 2033
- Figure 23: South America Non Starch Polysaccharide Revenue (million), by Country 2025 & 2033
- Figure 24: South America Non Starch Polysaccharide Volume (K), by Country 2025 & 2033
- Figure 25: South America Non Starch Polysaccharide Revenue Share (%), by Country 2025 & 2033
- Figure 26: South America Non Starch Polysaccharide Volume Share (%), by Country 2025 & 2033
- Figure 27: Europe Non Starch Polysaccharide Revenue (million), by Application 2025 & 2033
- Figure 28: Europe Non Starch Polysaccharide Volume (K), by Application 2025 & 2033
- Figure 29: Europe Non Starch Polysaccharide Revenue Share (%), by Application 2025 & 2033
- Figure 30: Europe Non Starch Polysaccharide Volume Share (%), by Application 2025 & 2033
- Figure 31: Europe Non Starch Polysaccharide Revenue (million), by Type 2025 & 2033
- Figure 32: Europe Non Starch Polysaccharide Volume (K), by Type 2025 & 2033
- Figure 33: Europe Non Starch Polysaccharide Revenue Share (%), by Type 2025 & 2033
- Figure 34: Europe Non Starch Polysaccharide Volume Share (%), by Type 2025 & 2033
- Figure 35: Europe Non Starch Polysaccharide Revenue (million), by Country 2025 & 2033
- Figure 36: Europe Non Starch Polysaccharide Volume (K), by Country 2025 & 2033
- Figure 37: Europe Non Starch Polysaccharide Revenue Share (%), by Country 2025 & 2033
- Figure 38: Europe Non Starch Polysaccharide Volume Share (%), by Country 2025 & 2033
- Figure 39: Middle East & Africa Non Starch Polysaccharide Revenue (million), by Application 2025 & 2033
- Figure 40: Middle East & Africa Non Starch Polysaccharide Volume (K), by Application 2025 & 2033
- Figure 41: Middle East & Africa Non Starch Polysaccharide Revenue Share (%), by Application 2025 & 2033
- Figure 42: Middle East & Africa Non Starch Polysaccharide Volume Share (%), by Application 2025 & 2033
- Figure 43: Middle East & Africa Non Starch Polysaccharide Revenue (million), by Type 2025 & 2033
- Figure 44: Middle East & Africa Non Starch Polysaccharide Volume (K), by Type 2025 & 2033
- Figure 45: Middle East & Africa Non Starch Polysaccharide Revenue Share (%), by Type 2025 & 2033
- Figure 46: Middle East & Africa Non Starch Polysaccharide Volume Share (%), by Type 2025 & 2033
- Figure 47: Middle East & Africa Non Starch Polysaccharide Revenue (million), by Country 2025 & 2033
- Figure 48: Middle East & Africa Non Starch Polysaccharide Volume (K), by Country 2025 & 2033
- Figure 49: Middle East & Africa Non Starch Polysaccharide Revenue Share (%), by Country 2025 & 2033
- Figure 50: Middle East & Africa Non Starch Polysaccharide Volume Share (%), by Country 2025 & 2033
- Figure 51: Asia Pacific Non Starch Polysaccharide Revenue (million), by Application 2025 & 2033
- Figure 52: Asia Pacific Non Starch Polysaccharide Volume (K), by Application 2025 & 2033
- Figure 53: Asia Pacific Non Starch Polysaccharide Revenue Share (%), by Application 2025 & 2033
- Figure 54: Asia Pacific Non Starch Polysaccharide Volume Share (%), by Application 2025 & 2033
- Figure 55: Asia Pacific Non Starch Polysaccharide Revenue (million), by Type 2025 & 2033
- Figure 56: Asia Pacific Non Starch Polysaccharide Volume (K), by Type 2025 & 2033
- Figure 57: Asia Pacific Non Starch Polysaccharide Revenue Share (%), by Type 2025 & 2033
- Figure 58: Asia Pacific Non Starch Polysaccharide Volume Share (%), by Type 2025 & 2033
- Figure 59: Asia Pacific Non Starch Polysaccharide Revenue (million), by Country 2025 & 2033
- Figure 60: Asia Pacific Non Starch Polysaccharide Volume (K), by Country 2025 & 2033
- Figure 61: Asia Pacific Non Starch Polysaccharide Revenue Share (%), by Country 2025 & 2033
- Figure 62: Asia Pacific Non Starch Polysaccharide Volume Share (%), by Country 2025 & 2033
List of Tables
- Table 1: Global Non Starch Polysaccharide Revenue million Forecast, by Application 2020 & 2033
- Table 2: Global Non Starch Polysaccharide Volume K Forecast, by Application 2020 & 2033
- Table 3: Global Non Starch Polysaccharide Revenue million Forecast, by Type 2020 & 2033
- Table 4: Global Non Starch Polysaccharide Volume K Forecast, by Type 2020 & 2033
- Table 5: Global Non Starch Polysaccharide Revenue million Forecast, by Region 2020 & 2033
- Table 6: Global Non Starch Polysaccharide Volume K Forecast, by Region 2020 & 2033
- Table 7: Global Non Starch Polysaccharide Revenue million Forecast, by Application 2020 & 2033
- Table 8: Global Non Starch Polysaccharide Volume K Forecast, by Application 2020 & 2033
- Table 9: Global Non Starch Polysaccharide Revenue million Forecast, by Type 2020 & 2033
- Table 10: Global Non Starch Polysaccharide Volume K Forecast, by Type 2020 & 2033
- Table 11: Global Non Starch Polysaccharide Revenue million Forecast, by Country 2020 & 2033
- Table 12: Global Non Starch Polysaccharide Volume K Forecast, by Country 2020 & 2033
- Table 13: United States Non Starch Polysaccharide Revenue (million) Forecast, by Application 2020 & 2033
- Table 14: United States Non Starch Polysaccharide Volume (K) Forecast, by Application 2020 & 2033
- Table 15: Canada Non Starch Polysaccharide Revenue (million) Forecast, by Application 2020 & 2033
- Table 16: Canada Non Starch Polysaccharide Volume (K) Forecast, by Application 2020 & 2033
- Table 17: Mexico Non Starch Polysaccharide Revenue (million) Forecast, by Application 2020 & 2033
- Table 18: Mexico Non Starch Polysaccharide Volume (K) Forecast, by Application 2020 & 2033
- Table 19: Global Non Starch Polysaccharide Revenue million Forecast, by Application 2020 & 2033
- Table 20: Global Non Starch Polysaccharide Volume K Forecast, by Application 2020 & 2033
- Table 21: Global Non Starch Polysaccharide Revenue million Forecast, by Type 2020 & 2033
- Table 22: Global Non Starch Polysaccharide Volume K Forecast, by Type 2020 & 2033
- Table 23: Global Non Starch Polysaccharide Revenue million Forecast, by Country 2020 & 2033
- Table 24: Global Non Starch Polysaccharide Volume K Forecast, by Country 2020 & 2033
- Table 25: Brazil Non Starch Polysaccharide Revenue (million) Forecast, by Application 2020 & 2033
- Table 26: Brazil Non Starch Polysaccharide Volume (K) Forecast, by Application 2020 & 2033
- Table 27: Argentina Non Starch Polysaccharide Revenue (million) Forecast, by Application 2020 & 2033
- Table 28: Argentina Non Starch Polysaccharide Volume (K) Forecast, by Application 2020 & 2033
- Table 29: Rest of South America Non Starch Polysaccharide Revenue (million) Forecast, by Application 2020 & 2033
- Table 30: Rest of South America Non Starch Polysaccharide Volume (K) Forecast, by Application 2020 & 2033
- Table 31: Global Non Starch Polysaccharide Revenue million Forecast, by Application 2020 & 2033
- Table 32: Global Non Starch Polysaccharide Volume K Forecast, by Application 2020 & 2033
- Table 33: Global Non Starch Polysaccharide Revenue million Forecast, by Type 2020 & 2033
- Table 34: Global Non Starch Polysaccharide Volume K Forecast, by Type 2020 & 2033
- Table 35: Global Non Starch Polysaccharide Revenue million Forecast, by Country 2020 & 2033
- Table 36: Global Non Starch Polysaccharide Volume K Forecast, by Country 2020 & 2033
- Table 37: United Kingdom Non Starch Polysaccharide Revenue (million) Forecast, by Application 2020 & 2033
- Table 38: United Kingdom Non Starch Polysaccharide Volume (K) Forecast, by Application 2020 & 2033
- Table 39: Germany Non Starch Polysaccharide Revenue (million) Forecast, by Application 2020 & 2033
- Table 40: Germany Non Starch Polysaccharide Volume (K) Forecast, by Application 2020 & 2033
- Table 41: France Non Starch Polysaccharide Revenue (million) Forecast, by Application 2020 & 2033
- Table 42: France Non Starch Polysaccharide Volume (K) Forecast, by Application 2020 & 2033
- Table 43: Italy Non Starch Polysaccharide Revenue (million) Forecast, by Application 2020 & 2033
- Table 44: Italy Non Starch Polysaccharide Volume (K) Forecast, by Application 2020 & 2033
- Table 45: Spain Non Starch Polysaccharide Revenue (million) Forecast, by Application 2020 & 2033
- Table 46: Spain Non Starch Polysaccharide Volume (K) Forecast, by Application 2020 & 2033
- Table 47: Russia Non Starch Polysaccharide Revenue (million) Forecast, by Application 2020 & 2033
- Table 48: Russia Non Starch Polysaccharide Volume (K) Forecast, by Application 2020 & 2033
- Table 49: Benelux Non Starch Polysaccharide Revenue (million) Forecast, by Application 2020 & 2033
- Table 50: Benelux Non Starch Polysaccharide Volume (K) Forecast, by Application 2020 & 2033
- Table 51: Nordics Non Starch Polysaccharide Revenue (million) Forecast, by Application 2020 & 2033
- Table 52: Nordics Non Starch Polysaccharide Volume (K) Forecast, by Application 2020 & 2033
- Table 53: Rest of Europe Non Starch Polysaccharide Revenue (million) Forecast, by Application 2020 & 2033
- Table 54: Rest of Europe Non Starch Polysaccharide Volume (K) Forecast, by Application 2020 & 2033
- Table 55: Global Non Starch Polysaccharide Revenue million Forecast, by Application 2020 & 2033
- Table 56: Global Non Starch Polysaccharide Volume K Forecast, by Application 2020 & 2033
- Table 57: Global Non Starch Polysaccharide Revenue million Forecast, by Type 2020 & 2033
- Table 58: Global Non Starch Polysaccharide Volume K Forecast, by Type 2020 & 2033
- Table 59: Global Non Starch Polysaccharide Revenue million Forecast, by Country 2020 & 2033
- Table 60: Global Non Starch Polysaccharide Volume K Forecast, by Country 2020 & 2033
- Table 61: Turkey Non Starch Polysaccharide Revenue (million) Forecast, by Application 2020 & 2033
- Table 62: Turkey Non Starch Polysaccharide Volume (K) Forecast, by Application 2020 & 2033
- Table 63: Israel Non Starch Polysaccharide Revenue (million) Forecast, by Application 2020 & 2033
- Table 64: Israel Non Starch Polysaccharide Volume (K) Forecast, by Application 2020 & 2033
- Table 65: GCC Non Starch Polysaccharide Revenue (million) Forecast, by Application 2020 & 2033
- Table 66: GCC Non Starch Polysaccharide Volume (K) Forecast, by Application 2020 & 2033
- Table 67: North Africa Non Starch Polysaccharide Revenue (million) Forecast, by Application 2020 & 2033
- Table 68: North Africa Non Starch Polysaccharide Volume (K) Forecast, by Application 2020 & 2033
- Table 69: South Africa Non Starch Polysaccharide Revenue (million) Forecast, by Application 2020 & 2033
- Table 70: South Africa Non Starch Polysaccharide Volume (K) Forecast, by Application 2020 & 2033
- Table 71: Rest of Middle East & Africa Non Starch Polysaccharide Revenue (million) Forecast, by Application 2020 & 2033
- Table 72: Rest of Middle East & Africa Non Starch Polysaccharide Volume (K) Forecast, by Application 2020 & 2033
- Table 73: Global Non Starch Polysaccharide Revenue million Forecast, by Application 2020 & 2033
- Table 74: Global Non Starch Polysaccharide Volume K Forecast, by Application 2020 & 2033
- Table 75: Global Non Starch Polysaccharide Revenue million Forecast, by Type 2020 & 2033
- Table 76: Global Non Starch Polysaccharide Volume K Forecast, by Type 2020 & 2033
- Table 77: Global Non Starch Polysaccharide Revenue million Forecast, by Country 2020 & 2033
- Table 78: Global Non Starch Polysaccharide Volume K Forecast, by Country 2020 & 2033
- Table 79: China Non Starch Polysaccharide Revenue (million) Forecast, by Application 2020 & 2033
- Table 80: China Non Starch Polysaccharide Volume (K) Forecast, by Application 2020 & 2033
- Table 81: India Non Starch Polysaccharide Revenue (million) Forecast, by Application 2020 & 2033
- Table 82: India Non Starch Polysaccharide Volume (K) Forecast, by Application 2020 & 2033
- Table 83: Japan Non Starch Polysaccharide Revenue (million) Forecast, by Application 2020 & 2033
- Table 84: Japan Non Starch Polysaccharide Volume (K) Forecast, by Application 2020 & 2033
- Table 85: South Korea Non Starch Polysaccharide Revenue (million) Forecast, by Application 2020 & 2033
- Table 86: South Korea Non Starch Polysaccharide Volume (K) Forecast, by Application 2020 & 2033
- Table 87: ASEAN Non Starch Polysaccharide Revenue (million) Forecast, by Application 2020 & 2033
- Table 88: ASEAN Non Starch Polysaccharide Volume (K) Forecast, by Application 2020 & 2033
- Table 89: Oceania Non Starch Polysaccharide Revenue (million) Forecast, by Application 2020 & 2033
- Table 90: Oceania Non Starch Polysaccharide Volume (K) Forecast, by Application 2020 & 2033
- Table 91: Rest of Asia Pacific Non Starch Polysaccharide Revenue (million) Forecast, by Application 2020 & 2033
- Table 92: Rest of Asia Pacific Non Starch Polysaccharide Volume (K) Forecast, by Application 2020 & 2033
Frequently Asked Questions
1. What is the projected Compound Annual Growth Rate (CAGR) of the Non Starch Polysaccharide?
The projected CAGR is approximately XXX%.
2. Which companies are prominent players in the Non Starch Polysaccharide?
Key companies in the market include Du Pont, AB Enzymes, Dsm, Novozymes, Adisseo, Dyadic International, Amano Enzyme Incorporated, BASF, Advanced Enzymes Technologies, Alltech Inc, Guolong Group, Lanxing Adisseo.
3. What are the main segments of the Non Starch Polysaccharide?
The market segments include Application, Type.
4. Can you provide details about the market size?
The market size is estimated to be USD XXX million as of 2022.
5. What are some drivers contributing to market growth?
N/A
6. What are the notable trends driving market growth?
N/A
7. Are there any restraints impacting market growth?
N/A
8. Can you provide examples of recent developments in the market?
N/A
9. What pricing options are available for accessing the report?
Pricing options include single-user, multi-user, and enterprise licenses priced at USD 3950.00, USD 5925.00, and USD 7900.00 respectively.
10. Is the market size provided in terms of value or volume?
The market size is provided in terms of value, measured in million and volume, measured in K.
11. Are there any specific market keywords associated with the report?
Yes, the market keyword associated with the report is "Non Starch Polysaccharide," which aids in identifying and referencing the specific market segment covered.
12. How do I determine which pricing option suits my needs best?
The pricing options vary based on user requirements and access needs. Individual users may opt for single-user licenses, while businesses requiring broader access may choose multi-user or enterprise licenses for cost-effective access to the report.
13. Are there any additional resources or data provided in the Non Starch Polysaccharide report?
While the report offers comprehensive insights, it's advisable to review the specific contents or supplementary materials provided to ascertain if additional resources or data are available.
14. How can I stay updated on further developments or reports in the Non Starch Polysaccharide?
To stay informed about further developments, trends, and reports in the Non Starch Polysaccharide, consider subscribing to industry newsletters, following relevant companies and organizations, or regularly checking reputable industry news sources and publications.
Methodology
Step 1 - Identification of Relevant Samples Size from Population Database


Step 2 - Approaches for Defining Global Market Size (Value, Volume* & Price*)

Note*: In applicable scenarios
Step 3 - Data Sources
Primary Research
- Web Analytics
- Survey Reports
- Research Institute
- Latest Research Reports
- Opinion Leaders
Secondary Research
- Annual Reports
- White Paper
- Latest Press Release
- Industry Association
- Paid Database
- Investor Presentations

Step 4 - Data Triangulation
Involves using different sources of information in order to increase the validity of a study
These sources are likely to be stakeholders in a program - participants, other researchers, program staff, other community members, and so on.
Then we put all data in single framework & apply various statistical tools to find out the dynamic on the market.
During the analysis stage, feedback from the stakeholder groups would be compared to determine areas of agreement as well as areas of divergence