

Key Insights
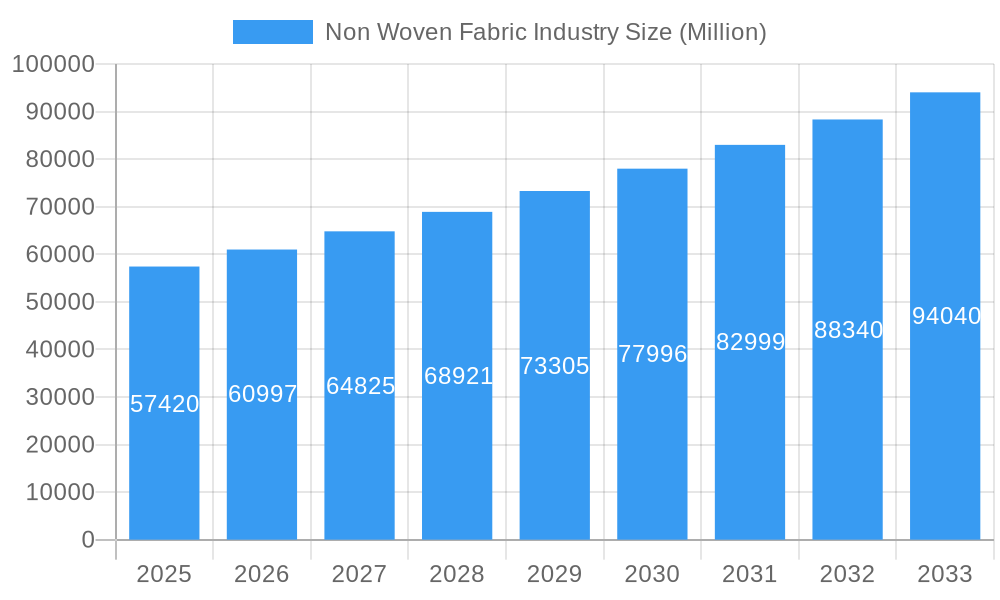
The global non-woven fabric market, valued at $57.42 billion in 2025, is projected to experience robust growth, exhibiting a Compound Annual Growth Rate (CAGR) of 6.11% from 2025 to 2033. This expansion is driven by several key factors. The increasing demand across diverse end-use industries, including healthcare (surgical gowns, masks, and wipes), construction (geotextiles and insulation), and automotive (interior components and filtration), fuels market growth. Technological advancements in spun-bond, meltblown, and wet-laid technologies are leading to the development of more versatile and high-performance non-woven fabrics, further stimulating demand. Sustainability concerns are also impacting the market, with a growing focus on biodegradable and recycled materials, like those derived from cotton and other bio-based sources. This shift towards eco-friendly options presents significant opportunities for manufacturers to develop and market sustainable non-woven products. The market is segmented by technology (spun-bond, meltblown, wet-laid, etc.), material (polyester, polypropylene, etc.), and end-user industry, offering various avenues for specialized growth. Competition is intense, with key players such as Kimberly-Clark, Toray Industries, Freudenberg, and Ahlstrom-Munksjö vying for market share through innovation and strategic partnerships. Regional variations exist, with North America and Asia Pacific expected to dominate the market due to their significant industrial presence and economic growth.
Non Woven Fabric Industry Market Size (In Billion)
Looking ahead, the market's trajectory will be influenced by several factors. Fluctuations in raw material prices, especially for polypropylene and polyester, could impact production costs and profitability. Government regulations regarding environmental sustainability will likely drive innovation in eco-friendly non-woven materials. Further technological advancements, particularly in areas like nanotechnology and bio-based materials, could significantly alter the competitive landscape. The increasing awareness of hygiene and sanitation globally will continue to boost demand, especially within the healthcare and hygiene sectors. Market players are expected to focus on product diversification, strategic collaborations, and geographical expansion to maintain a competitive edge in this dynamic market. The forecast period suggests significant growth potential across all segments, driven by the persistent need for versatile and functional non-woven materials in various applications.
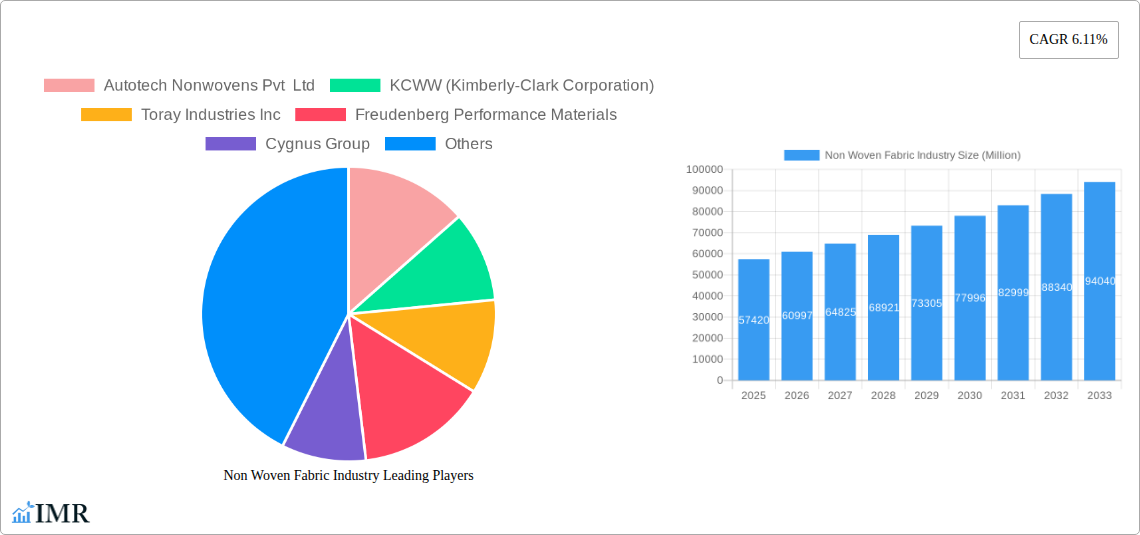
Non Woven Fabric Industry Company Market Share
Non Woven Fabric Industry Market Report: 2019-2033
This comprehensive report provides a detailed analysis of the Non Woven Fabric industry, encompassing market dynamics, growth trends, dominant segments, and key players. With a focus on the period 2019-2033 (Base Year: 2025), this report offers invaluable insights for industry professionals, investors, and strategic decision-makers. The report uses Million units as the unit for all values.
Non Woven Fabric Industry Market Dynamics & Structure
The nonwoven fabric industry is characterized by a moderately concentrated market structure, with several major players holding significant market share. The industry witnesses continuous technological innovation, primarily driven by the need for improved performance characteristics, sustainability concerns, and the expansion into new applications. Stringent regulatory frameworks concerning material safety and environmental impact influence manufacturing processes and product development. Competitive product substitutes, such as traditional woven fabrics and other engineered materials, exert pressure on pricing and market share. End-user demographics play a critical role, with growth fueled by rising populations, changing lifestyles, and evolving consumer preferences. The industry experiences a moderate level of mergers and acquisitions (M&A) activity, reflecting consolidation trends and strategic expansions.
- Market Concentration: The top 5 players hold approximately xx% of the global market share in 2025.
- Technological Innovation: Focus on biodegradable materials and advanced functionalities like antimicrobial properties is driving innovation.
- Regulatory Frameworks: Compliance with environmental regulations and safety standards significantly impacts production costs.
- M&A Activity: An estimated xx M&A deals occurred between 2019 and 2024, with an average deal value of xx Million units.
- Innovation Barriers: High R&D costs and lengthy regulatory approval processes pose significant barriers to innovation.
Non Woven Fabric Industry Growth Trends & Insights
The nonwoven fabric market experienced robust growth between 2019 and 2024, driven by increasing demand across various end-use sectors. The market size reached xx Million units in 2024 and is projected to reach xx Million units by 2033, exhibiting a CAGR of xx% during the forecast period (2025-2033). This growth is fueled by the rising adoption of nonwovens in diverse applications, including hygiene products, medical disposables, construction, and automotive. Technological disruptions, such as the development of sustainable and high-performance materials, are accelerating market expansion. Shifting consumer preferences towards eco-friendly and functional products further contribute to market growth.
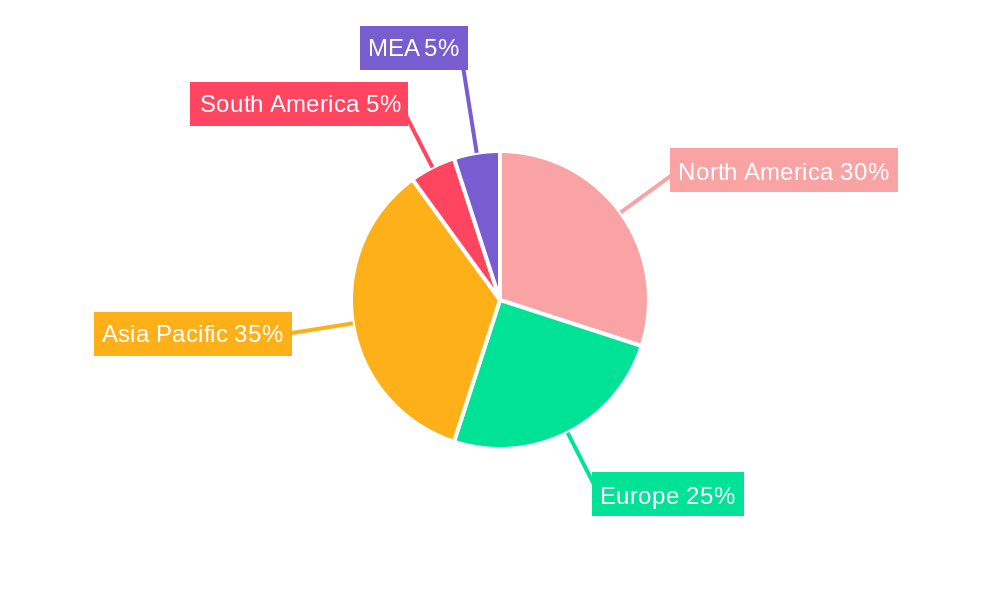
Dominant Regions, Countries, or Segments in Non Woven Fabric Industry
The Asia-Pacific region dominates the global nonwoven fabric market, driven by rapid industrialization, rising disposable incomes, and increasing demand from key end-use sectors like hygiene and healthcare. Within technologies, spun-bond holds the largest market share, followed by meltblown and wet-laid. Polypropylene is the most widely used material due to its cost-effectiveness and versatility. The construction industry represents a significant end-user segment, fueled by infrastructure development and construction activities.
- Leading Region: Asia-Pacific (Market Share: xx% in 2025)
- Leading Technology: Spun-bond (Market Share: xx% in 2025)
- Leading Material: Polypropylene (Market Share: xx% in 2025)
- Leading End-user Industry: Construction (Market Share: xx% in 2025)
- Key Growth Drivers: Rapid urbanization, infrastructure development, and increasing disposable incomes.
Non Woven Fabric Industry Product Landscape
The nonwoven fabric industry showcases diverse product innovations, encompassing advanced materials with enhanced properties like breathability, water resistance, and strength. These innovations cater to various applications, from medical textiles and filtration media to geotextiles and automotive components. Key performance metrics include tensile strength, breathability, and biodegradability. Unique selling propositions focus on sustainability, performance enhancements, and cost-effectiveness. Technological advancements in material science and manufacturing processes continue to drive product innovation.
Key Drivers, Barriers & Challenges in Non Woven Fabric Industry
Key Drivers: Increasing demand from hygiene and healthcare sectors; expanding applications in automotive and construction; advancements in material science; rising investments in R&D.
Key Challenges: Fluctuations in raw material prices; stringent environmental regulations; intense competition; supply chain disruptions impacting production capacity by xx% in 2024.
Emerging Opportunities in Non Woven Fabric Industry
Untapped markets in developing economies present significant growth potential. Innovative applications in areas like smart textiles and biodegradable packaging offer substantial opportunities. Evolving consumer preferences for sustainable and eco-friendly products drive demand for bio-based nonwovens.
Growth Accelerators in the Non Woven Fabric Industry Industry
Technological breakthroughs in material science, strategic partnerships fostering innovation, and expansion into new geographic markets are key growth catalysts. Emphasis on sustainable and eco-friendly solutions enhances market appeal and drives long-term growth.
Key Players Shaping the Non Woven Fabric Industry Market
- Autotech Nonwovens Pvt Ltd
- KCWW (Kimberly-Clark Corporation)
- Toray Industries Inc
- Freudenberg Performance Materials
- Cygnus Group
- TWE Group
- PFNonwovens Czech SRO
- Eximius Incorporation
- Glatfelter
- DuPont
- Ahlstrom-Munksj
- Fitesa
- Johns Manville
- Paramount Tech Fab Industries
- Berry Global Inc
Notable Milestones in Non Woven Fabric Industry Sector
- August 2022: Willacoochee Industrial Fabrics, Inc. (WINFAB) announces investment in a new nonwoven geotextile manufacturing line.
- June 2022: Asten Johnson creates a new division, AJ Nonwovens, to increase production capacity in North America.
In-Depth Non Woven Fabric Industry Market Outlook
The nonwoven fabric industry is poised for sustained growth, driven by technological advancements, expanding applications, and increasing demand from key end-use sectors. Strategic partnerships, investments in sustainable solutions, and penetration into untapped markets will shape future market dynamics. The industry's future potential is significant, offering attractive opportunities for players to capitalize on emerging trends and innovation.
Non Woven Fabric Industry Segmentation
-
1. Technology
- 1.1. Spun-bond
- 1.2. Wet-laid
- 1.3. Dry-laid
- 1.4. Other Technologies (Meltblown, and others)
-
2. Material
- 2.1. Polyester
- 2.2. Polypropylene
- 2.3. Polyethylene
- 2.4. Rayon (Viscose)
- 2.5. Other Materials (Cotton and other bio based)
-
3. End-user Industry
- 3.1. Construction
- 3.2. Textile
- 3.3. Healthcare
- 3.4. Automotive
- 3.5. Other En
Non Woven Fabric Industry Segmentation By Geography
-
1. Asia Pacific
- 1.1. China
- 1.2. India
- 1.3. Japan
- 1.4. South Korea
- 1.5. Malaysia
- 1.6. Thailand
- 1.7. Indonesia
- 1.8. Vietnam
- 1.9. Rest of Asia Pacific
-
2. North America
- 2.1. United States
- 2.2. Canada
- 2.3. Mexico
-
3. Europe
- 3.1. Germany
- 3.2. United Kingdom
- 3.3. France
- 3.4. Italy
- 3.5. Spain
- 3.6. Turkey
- 3.7. Russia
- 3.8. NORDIC Countries
- 3.9. Rest of Europe
-
4. South America
- 4.1. Brazil
- 4.2. Argentina
- 4.3. Colombia
- 4.4. Rest of South America
-
5. Middle East and Africa
- 5.1. Saudi Arabia
- 5.2. Nigeria
- 5.3. Qatar
- 5.4. Egypt
- 5.5. United Arab Emirates
- 5.6. South Africa
- 5.7. Rest of Middle East and Africa
Non Woven Fabric Industry Regional Market Share
Geographic Coverage of Non Woven Fabric Industry
Non Woven Fabric Industry REPORT HIGHLIGHTS
| Aspects | Details |
|---|---|
| Study Period | 2020-2034 |
| Base Year | 2025 |
| Estimated Year | 2026 |
| Forecast Period | 2026-2034 |
| Historical Period | 2020-2025 |
| Growth Rate | CAGR of 6.11% from 2020-2034 |
| Segmentation |
|
Table of Contents
- 1. Introduction
- 1.1. Research Scope
- 1.2. Market Segmentation
- 1.3. Research Objective
- 1.4. Definitions and Assumptions
- 2. Executive Summary
- 2.1. Market Snapshot
- 3. Market Dynamics
- 3.1. Market Drivers
- 3.2. Market Restrains
- 3.3. Market Trends
- 3.4. Market Opportunities
- 4. Market Factor Analysis
- 4.1. Porters Five Forces
- 4.1.1. Bargaining Power of Suppliers
- 4.1.2. Bargaining Power of Buyers
- 4.1.3. Threat of New Entrants
- 4.1.4. Threat of Substitutes
- 4.1.5. Competitive Rivalry
- 4.2. PESTEL analysis
- 4.3. BCG Analysis
- 4.3.1. Stars (High Growth, High Market Share)
- 4.3.2. Cash Cows (Low Growth, High Market Share)
- 4.3.3. Question Mark (High Growth, Low Market Share)
- 4.3.4. Dogs (Low Growth, Low Market Share)
- 4.4. Ansoff Matrix Analysis
- 4.5. Supply Chain Analysis
- 4.6. Regulatory Landscape
- 4.7. Current Market Potential and Opportunity Assessment (TAM–SAM–SOM Framework)
- 4.8. IMR Analyst Note
- 4.1. Porters Five Forces
- 5. Market Analysis, Insights and Forecast 2021-2033
- 5.1. Market Analysis, Insights and Forecast - by Technology
- 5.1.1. Spun-bond
- 5.1.2. Wet-laid
- 5.1.3. Dry-laid
- 5.1.4. Other Technologies (Meltblown, and others)
- 5.2. Market Analysis, Insights and Forecast - by Material
- 5.2.1. Polyester
- 5.2.2. Polypropylene
- 5.2.3. Polyethylene
- 5.2.4. Rayon (Viscose)
- 5.2.5. Other Materials (Cotton and other bio based)
- 5.3. Market Analysis, Insights and Forecast - by End-user Industry
- 5.3.1. Construction
- 5.3.2. Textile
- 5.3.3. Healthcare
- 5.3.4. Automotive
- 5.3.5. Other En
- 5.4. Market Analysis, Insights and Forecast - by Region
- 5.4.1. Asia Pacific
- 5.4.2. North America
- 5.4.3. Europe
- 5.4.4. South America
- 5.4.5. Middle East and Africa
- 5.1. Market Analysis, Insights and Forecast - by Technology
- 6. Global Non Woven Fabric Industry Analysis, Insights and Forecast, 2021-2033
- 6.1. Market Analysis, Insights and Forecast - by Technology
- 6.1.1. Spun-bond
- 6.1.2. Wet-laid
- 6.1.3. Dry-laid
- 6.1.4. Other Technologies (Meltblown, and others)
- 6.2. Market Analysis, Insights and Forecast - by Material
- 6.2.1. Polyester
- 6.2.2. Polypropylene
- 6.2.3. Polyethylene
- 6.2.4. Rayon (Viscose)
- 6.2.5. Other Materials (Cotton and other bio based)
- 6.3. Market Analysis, Insights and Forecast - by End-user Industry
- 6.3.1. Construction
- 6.3.2. Textile
- 6.3.3. Healthcare
- 6.3.4. Automotive
- 6.3.5. Other En
- 6.1. Market Analysis, Insights and Forecast - by Technology
- 7. Asia Pacific Non Woven Fabric Industry Analysis, Insights and Forecast, 2020-2032
- 7.1. Market Analysis, Insights and Forecast - by Technology
- 7.1.1. Spun-bond
- 7.1.2. Wet-laid
- 7.1.3. Dry-laid
- 7.1.4. Other Technologies (Meltblown, and others)
- 7.2. Market Analysis, Insights and Forecast - by Material
- 7.2.1. Polyester
- 7.2.2. Polypropylene
- 7.2.3. Polyethylene
- 7.2.4. Rayon (Viscose)
- 7.2.5. Other Materials (Cotton and other bio based)
- 7.3. Market Analysis, Insights and Forecast - by End-user Industry
- 7.3.1. Construction
- 7.3.2. Textile
- 7.3.3. Healthcare
- 7.3.4. Automotive
- 7.3.5. Other En
- 7.1. Market Analysis, Insights and Forecast - by Technology
- 8. North America Non Woven Fabric Industry Analysis, Insights and Forecast, 2020-2032
- 8.1. Market Analysis, Insights and Forecast - by Technology
- 8.1.1. Spun-bond
- 8.1.2. Wet-laid
- 8.1.3. Dry-laid
- 8.1.4. Other Technologies (Meltblown, and others)
- 8.2. Market Analysis, Insights and Forecast - by Material
- 8.2.1. Polyester
- 8.2.2. Polypropylene
- 8.2.3. Polyethylene
- 8.2.4. Rayon (Viscose)
- 8.2.5. Other Materials (Cotton and other bio based)
- 8.3. Market Analysis, Insights and Forecast - by End-user Industry
- 8.3.1. Construction
- 8.3.2. Textile
- 8.3.3. Healthcare
- 8.3.4. Automotive
- 8.3.5. Other En
- 8.1. Market Analysis, Insights and Forecast - by Technology
- 9. Europe Non Woven Fabric Industry Analysis, Insights and Forecast, 2020-2032
- 9.1. Market Analysis, Insights and Forecast - by Technology
- 9.1.1. Spun-bond
- 9.1.2. Wet-laid
- 9.1.3. Dry-laid
- 9.1.4. Other Technologies (Meltblown, and others)
- 9.2. Market Analysis, Insights and Forecast - by Material
- 9.2.1. Polyester
- 9.2.2. Polypropylene
- 9.2.3. Polyethylene
- 9.2.4. Rayon (Viscose)
- 9.2.5. Other Materials (Cotton and other bio based)
- 9.3. Market Analysis, Insights and Forecast - by End-user Industry
- 9.3.1. Construction
- 9.3.2. Textile
- 9.3.3. Healthcare
- 9.3.4. Automotive
- 9.3.5. Other En
- 9.1. Market Analysis, Insights and Forecast - by Technology
- 10. South America Non Woven Fabric Industry Analysis, Insights and Forecast, 2020-2032
- 10.1. Market Analysis, Insights and Forecast - by Technology
- 10.1.1. Spun-bond
- 10.1.2. Wet-laid
- 10.1.3. Dry-laid
- 10.1.4. Other Technologies (Meltblown, and others)
- 10.2. Market Analysis, Insights and Forecast - by Material
- 10.2.1. Polyester
- 10.2.2. Polypropylene
- 10.2.3. Polyethylene
- 10.2.4. Rayon (Viscose)
- 10.2.5. Other Materials (Cotton and other bio based)
- 10.3. Market Analysis, Insights and Forecast - by End-user Industry
- 10.3.1. Construction
- 10.3.2. Textile
- 10.3.3. Healthcare
- 10.3.4. Automotive
- 10.3.5. Other En
- 10.1. Market Analysis, Insights and Forecast - by Technology
- 11. Middle East and Africa Non Woven Fabric Industry Analysis, Insights and Forecast, 2020-2032
- 11.1. Market Analysis, Insights and Forecast - by Technology
- 11.1.1. Spun-bond
- 11.1.2. Wet-laid
- 11.1.3. Dry-laid
- 11.1.4. Other Technologies (Meltblown, and others)
- 11.2. Market Analysis, Insights and Forecast - by Material
- 11.2.1. Polyester
- 11.2.2. Polypropylene
- 11.2.3. Polyethylene
- 11.2.4. Rayon (Viscose)
- 11.2.5. Other Materials (Cotton and other bio based)
- 11.3. Market Analysis, Insights and Forecast - by End-user Industry
- 11.3.1. Construction
- 11.3.2. Textile
- 11.3.3. Healthcare
- 11.3.4. Automotive
- 11.3.5. Other En
- 11.1. Market Analysis, Insights and Forecast - by Technology
- 12. Competitive Analysis
- 12.1. Company Profiles
- 12.1.1 Autotech Nonwovens Pvt Ltd
- 12.1.1.1. Company Overview
- 12.1.1.2. Products
- 12.1.1.3. Company Financials
- 12.1.1.4. SWOT Analysis
- 12.1.2 KCWW (Kimberly-Clark Corporation)
- 12.1.2.1. Company Overview
- 12.1.2.2. Products
- 12.1.2.3. Company Financials
- 12.1.2.4. SWOT Analysis
- 12.1.3 Toray Industries Inc
- 12.1.3.1. Company Overview
- 12.1.3.2. Products
- 12.1.3.3. Company Financials
- 12.1.3.4. SWOT Analysis
- 12.1.4 Freudenberg Performance Materials
- 12.1.4.1. Company Overview
- 12.1.4.2. Products
- 12.1.4.3. Company Financials
- 12.1.4.4. SWOT Analysis
- 12.1.5 Cygnus Group
- 12.1.5.1. Company Overview
- 12.1.5.2. Products
- 12.1.5.3. Company Financials
- 12.1.5.4. SWOT Analysis
- 12.1.6 TWE Group*List Not Exhaustive
- 12.1.6.1. Company Overview
- 12.1.6.2. Products
- 12.1.6.3. Company Financials
- 12.1.6.4. SWOT Analysis
- 12.1.7 PFNonwovens Czech SRO
- 12.1.7.1. Company Overview
- 12.1.7.2. Products
- 12.1.7.3. Company Financials
- 12.1.7.4. SWOT Analysis
- 12.1.8 Eximius Incorporation
- 12.1.8.1. Company Overview
- 12.1.8.2. Products
- 12.1.8.3. Company Financials
- 12.1.8.4. SWOT Analysis
- 12.1.9 Glatfelter
- 12.1.9.1. Company Overview
- 12.1.9.2. Products
- 12.1.9.3. Company Financials
- 12.1.9.4. SWOT Analysis
- 12.1.10 DuPont
- 12.1.10.1. Company Overview
- 12.1.10.2. Products
- 12.1.10.3. Company Financials
- 12.1.10.4. SWOT Analysis
- 12.1.11 Ahlstrom-Munksj
- 12.1.11.1. Company Overview
- 12.1.11.2. Products
- 12.1.11.3. Company Financials
- 12.1.11.4. SWOT Analysis
- 12.1.12 Fitesa
- 12.1.12.1. Company Overview
- 12.1.12.2. Products
- 12.1.12.3. Company Financials
- 12.1.12.4. SWOT Analysis
- 12.1.13 Johns Manville
- 12.1.13.1. Company Overview
- 12.1.13.2. Products
- 12.1.13.3. Company Financials
- 12.1.13.4. SWOT Analysis
- 12.1.14 Paramount Tech Fab Industries
- 12.1.14.1. Company Overview
- 12.1.14.2. Products
- 12.1.14.3. Company Financials
- 12.1.14.4. SWOT Analysis
- 12.1.15 Berry Global Inc
- 12.1.15.1. Company Overview
- 12.1.15.2. Products
- 12.1.15.3. Company Financials
- 12.1.15.4. SWOT Analysis
- 12.1.1 Autotech Nonwovens Pvt Ltd
- 12.2. Market Entropy
- 12.2.1 Company's Key Areas Served
- 12.2.2 Recent Developments
- 12.3. Company Market Share Analysis 2025
- 12.3.1 Top 5 Companies Market Share Analysis
- 12.3.2 Top 3 Companies Market Share Analysis
- 12.4. List of Potential Customers
- 13. Research Methodology
List of Figures
- Figure 1: Global Non Woven Fabric Industry Revenue Breakdown (Million, %) by Region 2025 & 2033
- Figure 2: Global Non Woven Fabric Industry Volume Breakdown (K Tons, %) by Region 2025 & 2033
- Figure 3: Asia Pacific Non Woven Fabric Industry Revenue (Million), by Technology 2025 & 2033
- Figure 4: Asia Pacific Non Woven Fabric Industry Volume (K Tons), by Technology 2025 & 2033
- Figure 5: Asia Pacific Non Woven Fabric Industry Revenue Share (%), by Technology 2025 & 2033
- Figure 6: Asia Pacific Non Woven Fabric Industry Volume Share (%), by Technology 2025 & 2033
- Figure 7: Asia Pacific Non Woven Fabric Industry Revenue (Million), by Material 2025 & 2033
- Figure 8: Asia Pacific Non Woven Fabric Industry Volume (K Tons), by Material 2025 & 2033
- Figure 9: Asia Pacific Non Woven Fabric Industry Revenue Share (%), by Material 2025 & 2033
- Figure 10: Asia Pacific Non Woven Fabric Industry Volume Share (%), by Material 2025 & 2033
- Figure 11: Asia Pacific Non Woven Fabric Industry Revenue (Million), by End-user Industry 2025 & 2033
- Figure 12: Asia Pacific Non Woven Fabric Industry Volume (K Tons), by End-user Industry 2025 & 2033
- Figure 13: Asia Pacific Non Woven Fabric Industry Revenue Share (%), by End-user Industry 2025 & 2033
- Figure 14: Asia Pacific Non Woven Fabric Industry Volume Share (%), by End-user Industry 2025 & 2033
- Figure 15: Asia Pacific Non Woven Fabric Industry Revenue (Million), by Country 2025 & 2033
- Figure 16: Asia Pacific Non Woven Fabric Industry Volume (K Tons), by Country 2025 & 2033
- Figure 17: Asia Pacific Non Woven Fabric Industry Revenue Share (%), by Country 2025 & 2033
- Figure 18: Asia Pacific Non Woven Fabric Industry Volume Share (%), by Country 2025 & 2033
- Figure 19: North America Non Woven Fabric Industry Revenue (Million), by Technology 2025 & 2033
- Figure 20: North America Non Woven Fabric Industry Volume (K Tons), by Technology 2025 & 2033
- Figure 21: North America Non Woven Fabric Industry Revenue Share (%), by Technology 2025 & 2033
- Figure 22: North America Non Woven Fabric Industry Volume Share (%), by Technology 2025 & 2033
- Figure 23: North America Non Woven Fabric Industry Revenue (Million), by Material 2025 & 2033
- Figure 24: North America Non Woven Fabric Industry Volume (K Tons), by Material 2025 & 2033
- Figure 25: North America Non Woven Fabric Industry Revenue Share (%), by Material 2025 & 2033
- Figure 26: North America Non Woven Fabric Industry Volume Share (%), by Material 2025 & 2033
- Figure 27: North America Non Woven Fabric Industry Revenue (Million), by End-user Industry 2025 & 2033
- Figure 28: North America Non Woven Fabric Industry Volume (K Tons), by End-user Industry 2025 & 2033
- Figure 29: North America Non Woven Fabric Industry Revenue Share (%), by End-user Industry 2025 & 2033
- Figure 30: North America Non Woven Fabric Industry Volume Share (%), by End-user Industry 2025 & 2033
- Figure 31: North America Non Woven Fabric Industry Revenue (Million), by Country 2025 & 2033
- Figure 32: North America Non Woven Fabric Industry Volume (K Tons), by Country 2025 & 2033
- Figure 33: North America Non Woven Fabric Industry Revenue Share (%), by Country 2025 & 2033
- Figure 34: North America Non Woven Fabric Industry Volume Share (%), by Country 2025 & 2033
- Figure 35: Europe Non Woven Fabric Industry Revenue (Million), by Technology 2025 & 2033
- Figure 36: Europe Non Woven Fabric Industry Volume (K Tons), by Technology 2025 & 2033
- Figure 37: Europe Non Woven Fabric Industry Revenue Share (%), by Technology 2025 & 2033
- Figure 38: Europe Non Woven Fabric Industry Volume Share (%), by Technology 2025 & 2033
- Figure 39: Europe Non Woven Fabric Industry Revenue (Million), by Material 2025 & 2033
- Figure 40: Europe Non Woven Fabric Industry Volume (K Tons), by Material 2025 & 2033
- Figure 41: Europe Non Woven Fabric Industry Revenue Share (%), by Material 2025 & 2033
- Figure 42: Europe Non Woven Fabric Industry Volume Share (%), by Material 2025 & 2033
- Figure 43: Europe Non Woven Fabric Industry Revenue (Million), by End-user Industry 2025 & 2033
- Figure 44: Europe Non Woven Fabric Industry Volume (K Tons), by End-user Industry 2025 & 2033
- Figure 45: Europe Non Woven Fabric Industry Revenue Share (%), by End-user Industry 2025 & 2033
- Figure 46: Europe Non Woven Fabric Industry Volume Share (%), by End-user Industry 2025 & 2033
- Figure 47: Europe Non Woven Fabric Industry Revenue (Million), by Country 2025 & 2033
- Figure 48: Europe Non Woven Fabric Industry Volume (K Tons), by Country 2025 & 2033
- Figure 49: Europe Non Woven Fabric Industry Revenue Share (%), by Country 2025 & 2033
- Figure 50: Europe Non Woven Fabric Industry Volume Share (%), by Country 2025 & 2033
- Figure 51: South America Non Woven Fabric Industry Revenue (Million), by Technology 2025 & 2033
- Figure 52: South America Non Woven Fabric Industry Volume (K Tons), by Technology 2025 & 2033
- Figure 53: South America Non Woven Fabric Industry Revenue Share (%), by Technology 2025 & 2033
- Figure 54: South America Non Woven Fabric Industry Volume Share (%), by Technology 2025 & 2033
- Figure 55: South America Non Woven Fabric Industry Revenue (Million), by Material 2025 & 2033
- Figure 56: South America Non Woven Fabric Industry Volume (K Tons), by Material 2025 & 2033
- Figure 57: South America Non Woven Fabric Industry Revenue Share (%), by Material 2025 & 2033
- Figure 58: South America Non Woven Fabric Industry Volume Share (%), by Material 2025 & 2033
- Figure 59: South America Non Woven Fabric Industry Revenue (Million), by End-user Industry 2025 & 2033
- Figure 60: South America Non Woven Fabric Industry Volume (K Tons), by End-user Industry 2025 & 2033
- Figure 61: South America Non Woven Fabric Industry Revenue Share (%), by End-user Industry 2025 & 2033
- Figure 62: South America Non Woven Fabric Industry Volume Share (%), by End-user Industry 2025 & 2033
- Figure 63: South America Non Woven Fabric Industry Revenue (Million), by Country 2025 & 2033
- Figure 64: South America Non Woven Fabric Industry Volume (K Tons), by Country 2025 & 2033
- Figure 65: South America Non Woven Fabric Industry Revenue Share (%), by Country 2025 & 2033
- Figure 66: South America Non Woven Fabric Industry Volume Share (%), by Country 2025 & 2033
- Figure 67: Middle East and Africa Non Woven Fabric Industry Revenue (Million), by Technology 2025 & 2033
- Figure 68: Middle East and Africa Non Woven Fabric Industry Volume (K Tons), by Technology 2025 & 2033
- Figure 69: Middle East and Africa Non Woven Fabric Industry Revenue Share (%), by Technology 2025 & 2033
- Figure 70: Middle East and Africa Non Woven Fabric Industry Volume Share (%), by Technology 2025 & 2033
- Figure 71: Middle East and Africa Non Woven Fabric Industry Revenue (Million), by Material 2025 & 2033
- Figure 72: Middle East and Africa Non Woven Fabric Industry Volume (K Tons), by Material 2025 & 2033
- Figure 73: Middle East and Africa Non Woven Fabric Industry Revenue Share (%), by Material 2025 & 2033
- Figure 74: Middle East and Africa Non Woven Fabric Industry Volume Share (%), by Material 2025 & 2033
- Figure 75: Middle East and Africa Non Woven Fabric Industry Revenue (Million), by End-user Industry 2025 & 2033
- Figure 76: Middle East and Africa Non Woven Fabric Industry Volume (K Tons), by End-user Industry 2025 & 2033
- Figure 77: Middle East and Africa Non Woven Fabric Industry Revenue Share (%), by End-user Industry 2025 & 2033
- Figure 78: Middle East and Africa Non Woven Fabric Industry Volume Share (%), by End-user Industry 2025 & 2033
- Figure 79: Middle East and Africa Non Woven Fabric Industry Revenue (Million), by Country 2025 & 2033
- Figure 80: Middle East and Africa Non Woven Fabric Industry Volume (K Tons), by Country 2025 & 2033
- Figure 81: Middle East and Africa Non Woven Fabric Industry Revenue Share (%), by Country 2025 & 2033
- Figure 82: Middle East and Africa Non Woven Fabric Industry Volume Share (%), by Country 2025 & 2033
List of Tables
- Table 1: Global Non Woven Fabric Industry Revenue Million Forecast, by Technology 2020 & 2033
- Table 2: Global Non Woven Fabric Industry Volume K Tons Forecast, by Technology 2020 & 2033
- Table 3: Global Non Woven Fabric Industry Revenue Million Forecast, by Material 2020 & 2033
- Table 4: Global Non Woven Fabric Industry Volume K Tons Forecast, by Material 2020 & 2033
- Table 5: Global Non Woven Fabric Industry Revenue Million Forecast, by End-user Industry 2020 & 2033
- Table 6: Global Non Woven Fabric Industry Volume K Tons Forecast, by End-user Industry 2020 & 2033
- Table 7: Global Non Woven Fabric Industry Revenue Million Forecast, by Region 2020 & 2033
- Table 8: Global Non Woven Fabric Industry Volume K Tons Forecast, by Region 2020 & 2033
- Table 9: Global Non Woven Fabric Industry Revenue Million Forecast, by Technology 2020 & 2033
- Table 10: Global Non Woven Fabric Industry Volume K Tons Forecast, by Technology 2020 & 2033
- Table 11: Global Non Woven Fabric Industry Revenue Million Forecast, by Material 2020 & 2033
- Table 12: Global Non Woven Fabric Industry Volume K Tons Forecast, by Material 2020 & 2033
- Table 13: Global Non Woven Fabric Industry Revenue Million Forecast, by End-user Industry 2020 & 2033
- Table 14: Global Non Woven Fabric Industry Volume K Tons Forecast, by End-user Industry 2020 & 2033
- Table 15: Global Non Woven Fabric Industry Revenue Million Forecast, by Country 2020 & 2033
- Table 16: Global Non Woven Fabric Industry Volume K Tons Forecast, by Country 2020 & 2033
- Table 17: China Non Woven Fabric Industry Revenue (Million) Forecast, by Application 2020 & 2033
- Table 18: China Non Woven Fabric Industry Volume (K Tons) Forecast, by Application 2020 & 2033
- Table 19: India Non Woven Fabric Industry Revenue (Million) Forecast, by Application 2020 & 2033
- Table 20: India Non Woven Fabric Industry Volume (K Tons) Forecast, by Application 2020 & 2033
- Table 21: Japan Non Woven Fabric Industry Revenue (Million) Forecast, by Application 2020 & 2033
- Table 22: Japan Non Woven Fabric Industry Volume (K Tons) Forecast, by Application 2020 & 2033
- Table 23: South Korea Non Woven Fabric Industry Revenue (Million) Forecast, by Application 2020 & 2033
- Table 24: South Korea Non Woven Fabric Industry Volume (K Tons) Forecast, by Application 2020 & 2033
- Table 25: Malaysia Non Woven Fabric Industry Revenue (Million) Forecast, by Application 2020 & 2033
- Table 26: Malaysia Non Woven Fabric Industry Volume (K Tons) Forecast, by Application 2020 & 2033
- Table 27: Thailand Non Woven Fabric Industry Revenue (Million) Forecast, by Application 2020 & 2033
- Table 28: Thailand Non Woven Fabric Industry Volume (K Tons) Forecast, by Application 2020 & 2033
- Table 29: Indonesia Non Woven Fabric Industry Revenue (Million) Forecast, by Application 2020 & 2033
- Table 30: Indonesia Non Woven Fabric Industry Volume (K Tons) Forecast, by Application 2020 & 2033
- Table 31: Vietnam Non Woven Fabric Industry Revenue (Million) Forecast, by Application 2020 & 2033
- Table 32: Vietnam Non Woven Fabric Industry Volume (K Tons) Forecast, by Application 2020 & 2033
- Table 33: Rest of Asia Pacific Non Woven Fabric Industry Revenue (Million) Forecast, by Application 2020 & 2033
- Table 34: Rest of Asia Pacific Non Woven Fabric Industry Volume (K Tons) Forecast, by Application 2020 & 2033
- Table 35: Global Non Woven Fabric Industry Revenue Million Forecast, by Technology 2020 & 2033
- Table 36: Global Non Woven Fabric Industry Volume K Tons Forecast, by Technology 2020 & 2033
- Table 37: Global Non Woven Fabric Industry Revenue Million Forecast, by Material 2020 & 2033
- Table 38: Global Non Woven Fabric Industry Volume K Tons Forecast, by Material 2020 & 2033
- Table 39: Global Non Woven Fabric Industry Revenue Million Forecast, by End-user Industry 2020 & 2033
- Table 40: Global Non Woven Fabric Industry Volume K Tons Forecast, by End-user Industry 2020 & 2033
- Table 41: Global Non Woven Fabric Industry Revenue Million Forecast, by Country 2020 & 2033
- Table 42: Global Non Woven Fabric Industry Volume K Tons Forecast, by Country 2020 & 2033
- Table 43: United States Non Woven Fabric Industry Revenue (Million) Forecast, by Application 2020 & 2033
- Table 44: United States Non Woven Fabric Industry Volume (K Tons) Forecast, by Application 2020 & 2033
- Table 45: Canada Non Woven Fabric Industry Revenue (Million) Forecast, by Application 2020 & 2033
- Table 46: Canada Non Woven Fabric Industry Volume (K Tons) Forecast, by Application 2020 & 2033
- Table 47: Mexico Non Woven Fabric Industry Revenue (Million) Forecast, by Application 2020 & 2033
- Table 48: Mexico Non Woven Fabric Industry Volume (K Tons) Forecast, by Application 2020 & 2033
- Table 49: Global Non Woven Fabric Industry Revenue Million Forecast, by Technology 2020 & 2033
- Table 50: Global Non Woven Fabric Industry Volume K Tons Forecast, by Technology 2020 & 2033
- Table 51: Global Non Woven Fabric Industry Revenue Million Forecast, by Material 2020 & 2033
- Table 52: Global Non Woven Fabric Industry Volume K Tons Forecast, by Material 2020 & 2033
- Table 53: Global Non Woven Fabric Industry Revenue Million Forecast, by End-user Industry 2020 & 2033
- Table 54: Global Non Woven Fabric Industry Volume K Tons Forecast, by End-user Industry 2020 & 2033
- Table 55: Global Non Woven Fabric Industry Revenue Million Forecast, by Country 2020 & 2033
- Table 56: Global Non Woven Fabric Industry Volume K Tons Forecast, by Country 2020 & 2033
- Table 57: Germany Non Woven Fabric Industry Revenue (Million) Forecast, by Application 2020 & 2033
- Table 58: Germany Non Woven Fabric Industry Volume (K Tons) Forecast, by Application 2020 & 2033
- Table 59: United Kingdom Non Woven Fabric Industry Revenue (Million) Forecast, by Application 2020 & 2033
- Table 60: United Kingdom Non Woven Fabric Industry Volume (K Tons) Forecast, by Application 2020 & 2033
- Table 61: France Non Woven Fabric Industry Revenue (Million) Forecast, by Application 2020 & 2033
- Table 62: France Non Woven Fabric Industry Volume (K Tons) Forecast, by Application 2020 & 2033
- Table 63: Italy Non Woven Fabric Industry Revenue (Million) Forecast, by Application 2020 & 2033
- Table 64: Italy Non Woven Fabric Industry Volume (K Tons) Forecast, by Application 2020 & 2033
- Table 65: Spain Non Woven Fabric Industry Revenue (Million) Forecast, by Application 2020 & 2033
- Table 66: Spain Non Woven Fabric Industry Volume (K Tons) Forecast, by Application 2020 & 2033
- Table 67: Turkey Non Woven Fabric Industry Revenue (Million) Forecast, by Application 2020 & 2033
- Table 68: Turkey Non Woven Fabric Industry Volume (K Tons) Forecast, by Application 2020 & 2033
- Table 69: Russia Non Woven Fabric Industry Revenue (Million) Forecast, by Application 2020 & 2033
- Table 70: Russia Non Woven Fabric Industry Volume (K Tons) Forecast, by Application 2020 & 2033
- Table 71: NORDIC Countries Non Woven Fabric Industry Revenue (Million) Forecast, by Application 2020 & 2033
- Table 72: NORDIC Countries Non Woven Fabric Industry Volume (K Tons) Forecast, by Application 2020 & 2033
- Table 73: Rest of Europe Non Woven Fabric Industry Revenue (Million) Forecast, by Application 2020 & 2033
- Table 74: Rest of Europe Non Woven Fabric Industry Volume (K Tons) Forecast, by Application 2020 & 2033
- Table 75: Global Non Woven Fabric Industry Revenue Million Forecast, by Technology 2020 & 2033
- Table 76: Global Non Woven Fabric Industry Volume K Tons Forecast, by Technology 2020 & 2033
- Table 77: Global Non Woven Fabric Industry Revenue Million Forecast, by Material 2020 & 2033
- Table 78: Global Non Woven Fabric Industry Volume K Tons Forecast, by Material 2020 & 2033
- Table 79: Global Non Woven Fabric Industry Revenue Million Forecast, by End-user Industry 2020 & 2033
- Table 80: Global Non Woven Fabric Industry Volume K Tons Forecast, by End-user Industry 2020 & 2033
- Table 81: Global Non Woven Fabric Industry Revenue Million Forecast, by Country 2020 & 2033
- Table 82: Global Non Woven Fabric Industry Volume K Tons Forecast, by Country 2020 & 2033
- Table 83: Brazil Non Woven Fabric Industry Revenue (Million) Forecast, by Application 2020 & 2033
- Table 84: Brazil Non Woven Fabric Industry Volume (K Tons) Forecast, by Application 2020 & 2033
- Table 85: Argentina Non Woven Fabric Industry Revenue (Million) Forecast, by Application 2020 & 2033
- Table 86: Argentina Non Woven Fabric Industry Volume (K Tons) Forecast, by Application 2020 & 2033
- Table 87: Colombia Non Woven Fabric Industry Revenue (Million) Forecast, by Application 2020 & 2033
- Table 88: Colombia Non Woven Fabric Industry Volume (K Tons) Forecast, by Application 2020 & 2033
- Table 89: Rest of South America Non Woven Fabric Industry Revenue (Million) Forecast, by Application 2020 & 2033
- Table 90: Rest of South America Non Woven Fabric Industry Volume (K Tons) Forecast, by Application 2020 & 2033
- Table 91: Global Non Woven Fabric Industry Revenue Million Forecast, by Technology 2020 & 2033
- Table 92: Global Non Woven Fabric Industry Volume K Tons Forecast, by Technology 2020 & 2033
- Table 93: Global Non Woven Fabric Industry Revenue Million Forecast, by Material 2020 & 2033
- Table 94: Global Non Woven Fabric Industry Volume K Tons Forecast, by Material 2020 & 2033
- Table 95: Global Non Woven Fabric Industry Revenue Million Forecast, by End-user Industry 2020 & 2033
- Table 96: Global Non Woven Fabric Industry Volume K Tons Forecast, by End-user Industry 2020 & 2033
- Table 97: Global Non Woven Fabric Industry Revenue Million Forecast, by Country 2020 & 2033
- Table 98: Global Non Woven Fabric Industry Volume K Tons Forecast, by Country 2020 & 2033
- Table 99: Saudi Arabia Non Woven Fabric Industry Revenue (Million) Forecast, by Application 2020 & 2033
- Table 100: Saudi Arabia Non Woven Fabric Industry Volume (K Tons) Forecast, by Application 2020 & 2033
- Table 101: Nigeria Non Woven Fabric Industry Revenue (Million) Forecast, by Application 2020 & 2033
- Table 102: Nigeria Non Woven Fabric Industry Volume (K Tons) Forecast, by Application 2020 & 2033
- Table 103: Qatar Non Woven Fabric Industry Revenue (Million) Forecast, by Application 2020 & 2033
- Table 104: Qatar Non Woven Fabric Industry Volume (K Tons) Forecast, by Application 2020 & 2033
- Table 105: Egypt Non Woven Fabric Industry Revenue (Million) Forecast, by Application 2020 & 2033
- Table 106: Egypt Non Woven Fabric Industry Volume (K Tons) Forecast, by Application 2020 & 2033
- Table 107: United Arab Emirates Non Woven Fabric Industry Revenue (Million) Forecast, by Application 2020 & 2033
- Table 108: United Arab Emirates Non Woven Fabric Industry Volume (K Tons) Forecast, by Application 2020 & 2033
- Table 109: South Africa Non Woven Fabric Industry Revenue (Million) Forecast, by Application 2020 & 2033
- Table 110: South Africa Non Woven Fabric Industry Volume (K Tons) Forecast, by Application 2020 & 2033
- Table 111: Rest of Middle East and Africa Non Woven Fabric Industry Revenue (Million) Forecast, by Application 2020 & 2033
- Table 112: Rest of Middle East and Africa Non Woven Fabric Industry Volume (K Tons) Forecast, by Application 2020 & 2033
Frequently Asked Questions
1. What is the projected Compound Annual Growth Rate (CAGR) of the Non Woven Fabric Industry?
The projected CAGR is approximately 6.11%.
2. Which companies are prominent players in the Non Woven Fabric Industry?
Key companies in the market include Autotech Nonwovens Pvt Ltd, KCWW (Kimberly-Clark Corporation), Toray Industries Inc, Freudenberg Performance Materials, Cygnus Group, TWE Group*List Not Exhaustive, PFNonwovens Czech SRO, Eximius Incorporation, Glatfelter, DuPont, Ahlstrom-Munksj, Fitesa, Johns Manville, Paramount Tech Fab Industries, Berry Global Inc.
3. What are the main segments of the Non Woven Fabric Industry?
The market segments include Technology, Material, End-user Industry.
4. Can you provide details about the market size?
The market size is estimated to be USD 57.42 Million as of 2022.
5. What are some drivers contributing to market growth?
Increasing Application in the Healthcare Industry; Growing Demand for Electric Vehicles; Other Drivers.
6. What are the notable trends driving market growth?
Increasing Demand from the Healthcare Industry.
7. Are there any restraints impacting market growth?
Low Durability and Strength of Fabric; Other Restraints.
8. Can you provide examples of recent developments in the market?
August 2022: Willacoochee Industrial Fabrics, Inc. (WINFAB), one of the leading manufacturers of geosynthetic and erosion control products in the United States, announced its investment into a new state-of-the-art nonwoven geotextile manufacturing production line in Nashville, GA. The production line was anticipated to begin operation by the second quarter of 2023.
9. What pricing options are available for accessing the report?
Pricing options include single-user, multi-user, and enterprise licenses priced at USD 4750, USD 5250, and USD 8750 respectively.
10. Is the market size provided in terms of value or volume?
The market size is provided in terms of value, measured in Million and volume, measured in K Tons.
11. Are there any specific market keywords associated with the report?
Yes, the market keyword associated with the report is "Non Woven Fabric Industry," which aids in identifying and referencing the specific market segment covered.
12. How do I determine which pricing option suits my needs best?
The pricing options vary based on user requirements and access needs. Individual users may opt for single-user licenses, while businesses requiring broader access may choose multi-user or enterprise licenses for cost-effective access to the report.
13. Are there any additional resources or data provided in the Non Woven Fabric Industry report?
While the report offers comprehensive insights, it's advisable to review the specific contents or supplementary materials provided to ascertain if additional resources or data are available.
14. How can I stay updated on further developments or reports in the Non Woven Fabric Industry?
To stay informed about further developments, trends, and reports in the Non Woven Fabric Industry, consider subscribing to industry newsletters, following relevant companies and organizations, or regularly checking reputable industry news sources and publications.
Methodology
Step 1 - Identification of Relevant Samples Size from Population Database


Step 2 - Approaches for Defining Global Market Size (Value, Volume* & Price*)

Note*: In applicable scenarios
Step 3 - Data Sources
Primary Research
- Web Analytics
- Survey Reports
- Research Institute
- Latest Research Reports
- Opinion Leaders
Secondary Research
- Annual Reports
- White Paper
- Latest Press Release
- Industry Association
- Paid Database
- Investor Presentations

Step 4 - Data Triangulation
Involves using different sources of information in order to increase the validity of a study
These sources are likely to be stakeholders in a program - participants, other researchers, program staff, other community members, and so on.
Then we put all data in single framework & apply various statistical tools to find out the dynamic on the market.
During the analysis stage, feedback from the stakeholder groups would be compared to determine areas of agreement as well as areas of divergence