

Key Insights
The global online travel sites market is poised for substantial expansion, projected to reach $622.6 billion in 2025, with a robust Compound Annual Growth Rate (CAGR) of 9.75% through 2033. This significant growth is propelled by a confluence of evolving consumer behaviors and technological advancements. The increasing reliance on digital platforms for all aspects of life, from daily errands to complex planning, directly fuels the demand for online travel booking services. Travelers are actively seeking convenience, competitive pricing, and a wide array of choices, all readily available through online travel agencies (OTAs). The proliferation of smartphones and widespread internet access, particularly in emerging economies, has democratized travel planning, making it accessible to a much broader demographic. Furthermore, the continuous innovation in user interface design and the integration of AI-powered personalization are enhancing the customer experience, encouraging repeat bookings and fostering loyalty. The market's dynamism is further evident in the diverse applications, ranging from personal travel arrangements to complex group bookings and specialized travel services, indicating a broad and adaptable market landscape.
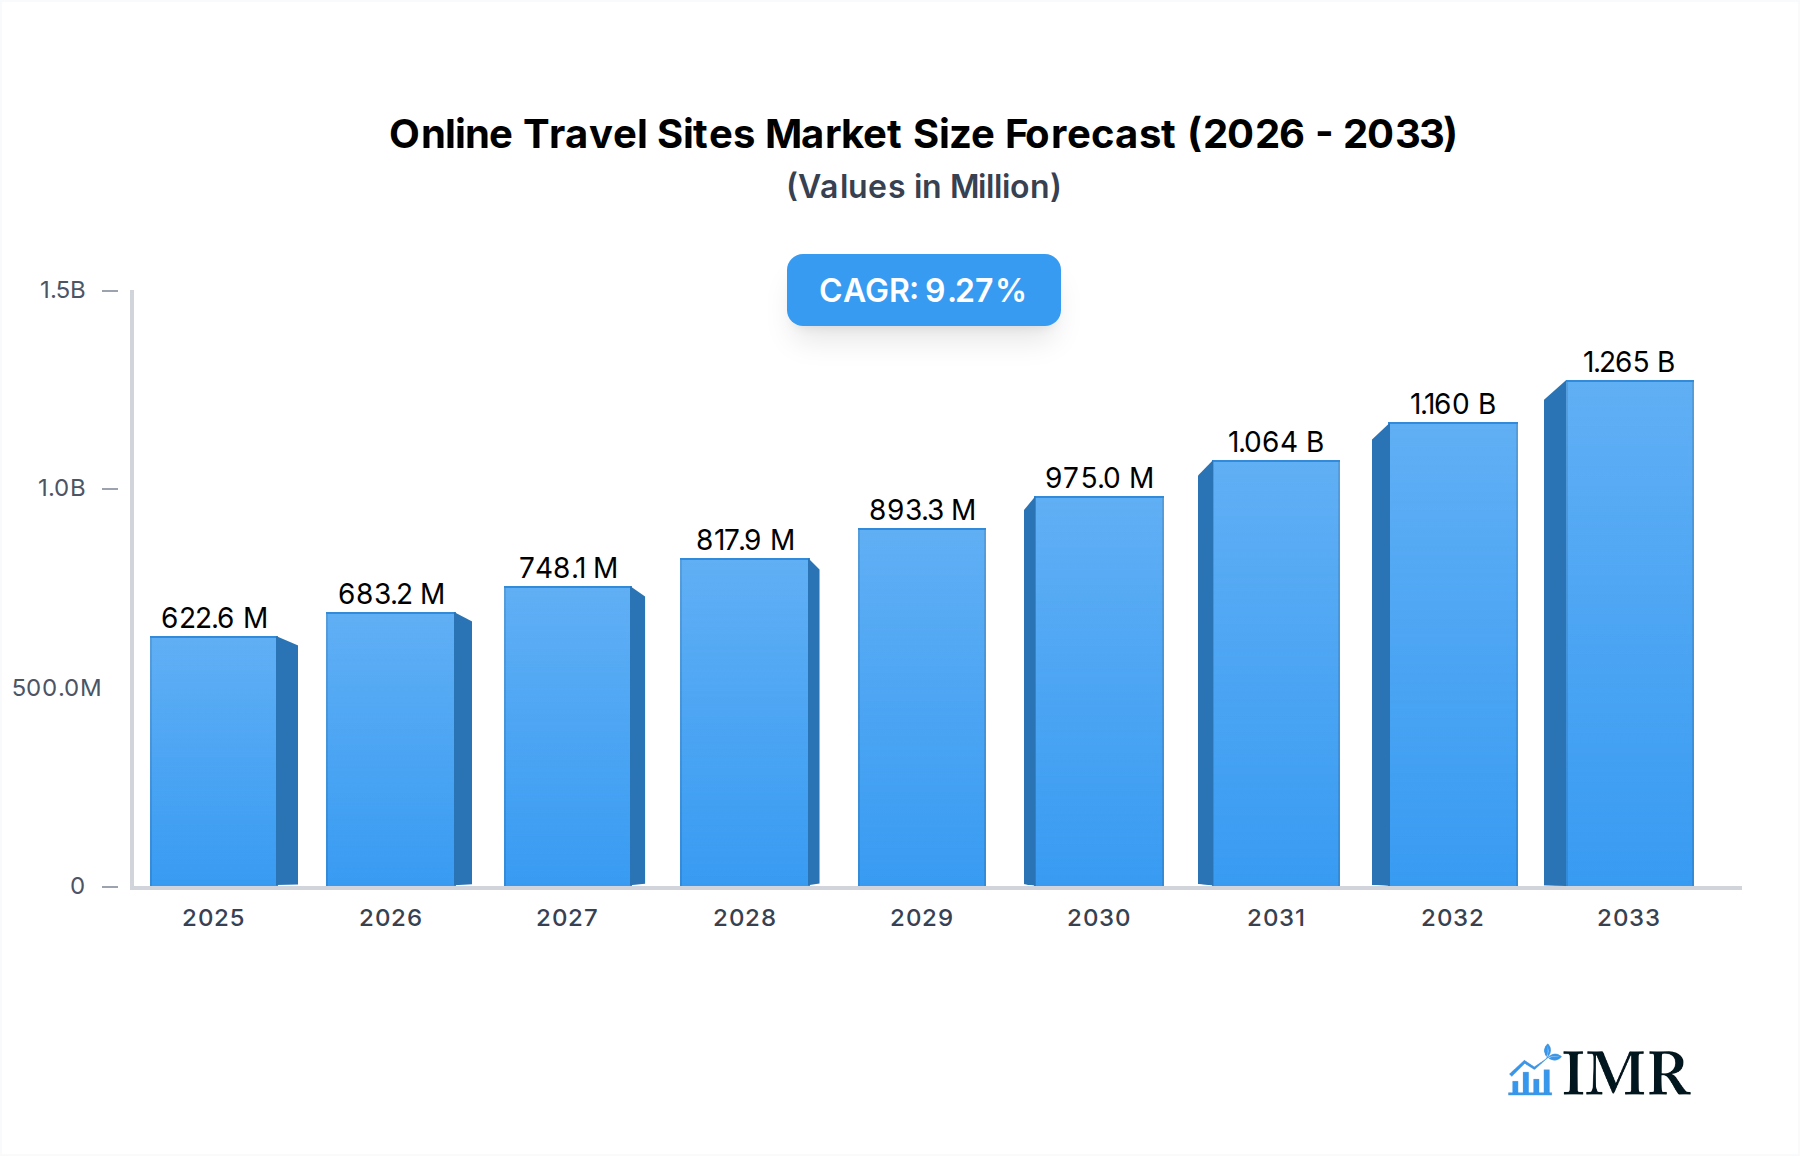
Online Travel Sites Market Size (In Million)
Several key trends are shaping the future of the online travel sites market. The rise of mobile-first booking experiences, enhanced by user-friendly apps and seamless payment integrations, is becoming paramount for reaching a younger, digitally native audience. Personalized recommendations, driven by sophisticated data analytics and machine learning, are enabling OTAs to offer tailored travel packages that resonate with individual preferences, thereby increasing conversion rates and customer satisfaction. The integration of ancillary services, such as car rentals, hotel activities, and travel insurance, within a single booking platform is creating a more comprehensive and convenient one-stop-shop for travelers. While the market is experiencing strong growth, certain restraints, such as intense price competition among major players and potential data security concerns, warrant careful consideration by industry stakeholders. Nevertheless, the overarching trend towards digital transformation in the travel industry, coupled with a persistent desire for exploration and leisure, firmly positions the online travel sites market for sustained and impressive growth.

Online Travel Sites Company Market Share
This in-depth report provides a critical analysis of the global Online Travel Sites market, offering actionable insights for industry stakeholders. Spanning a study period from 2019 to 2033, with a base and estimated year of 2025, this research delves into market dynamics, growth trends, regional dominance, product landscape, key drivers, emerging opportunities, and the competitive ecosystem. Leveraging high-traffic keywords and detailed segment analysis (Application: Personal, Group, Other; Types: WAP, WEB), this report is designed to maximize search engine visibility and equip professionals with a 360-degree understanding of this rapidly evolving sector.
Online Travel Sites Market Dynamics & Structure
The global Online Travel Sites market exhibits a moderately consolidated structure, with major players like Expedia Group (Expedia, Orbitz, Hotwire), Booking Holdings (Priceline, Booking.com - not listed in provided companies but a significant player to consider), and various other established entities vying for market share. Technological innovation is a primary driver, with advancements in AI-powered personalized recommendations, mobile booking capabilities, and seamless user interfaces continuously reshaping consumer expectations. The regulatory framework, while generally supportive of digital commerce, can introduce complexities related to data privacy and consumer protection. Competitive product substitutes include direct bookings with airlines and hotels, as well as emerging niche travel platforms. End-user demographics are increasingly tech-savvy, with a significant portion of travelers, from solo adventurers to large groups, relying on online platforms for planning and booking. Mergers and Acquisitions (M&A) remain a key strategy for market expansion and consolidation.
- Market Concentration: Moderately consolidated with a few dominant global players.
- Technological Innovation Drivers: AI for personalization, mobile-first experiences, virtual reality previews, and blockchain for secure transactions.
- Regulatory Frameworks: Data privacy (GDPR, CCPA), consumer protection laws, and anti-trust regulations.
- Competitive Product Substitutes: Direct bookings, specialized travel agencies (online and offline), and peer-to-peer accommodation platforms.
- End-User Demographics: Millennials and Gen Z are key drivers, exhibiting high adoption of digital travel solutions. Growth in the senior travel segment adopting online platforms.
- M&A Trends: Strategic acquisitions aimed at expanding service offerings, acquiring innovative technology, and increasing market reach. Approximately 15-20 significant M&A deals are anticipated annually in the broader travel tech sector.
Online Travel Sites Growth Trends & Insights
The Online Travel Sites market is projected for substantial growth, driven by increasing internet penetration, the proliferation of smartphones, and a growing propensity for independent travel planning. The global online travel market size is estimated to reach $1,450.3 billion by 2025, with a projected Compound Annual Growth Rate (CAGR) of 7.5% from 2025 to 2033. This growth is fueled by evolving consumer behavior, shifting towards digital-first booking experiences and a demand for personalized travel itineraries. Technological disruptions, such as the integration of AI for predictive booking and hyper-personalized recommendations, are enhancing user experience and driving repeat business. Mobile bookings are rapidly outpacing web bookings, underscoring the importance of a robust WAP and mobile application strategy. The "other" application segment, encompassing business travel and complex group bookings managed via specialized platforms, is also demonstrating significant upward momentum.
Key Growth Drivers:
- Digitalization of Travel: A sustained shift from offline to online booking channels across all travel segments.
- Mobile First Approach: Dominance of mobile devices for travel research, booking, and in-trip management.
- Personalization and Customization: Growing demand for tailor-made travel experiences, powered by AI and big data analytics.
- Emergence of Budget Travel: Increased accessibility to affordable travel options through online platforms.
- Growth of Experiential Travel: A rise in demand for unique and local experiences, often booked through specialized online travel aggregators.
Market Penetration & Adoption Rates:
- Global online travel booking penetration is expected to exceed 85% by 2028.
- Mobile booking adoption is projected to reach 70% of all online travel bookings by 2027.
- The "Personal" application segment accounts for over 75% of the current market value, with "Group" and "Other" segments showing faster growth rates.
Technological Disruptions and Consumer Behavior Shifts:
- AI-Powered Planning: Chatbots and AI assistants are becoming integral to travel planning, offering real-time advice and itinerary optimization.
- Augmented Reality (AR) and Virtual Reality (VR): Increasing use for destination previews and hotel room visualization, influencing booking decisions.
- Sustainability Focus: Growing consumer preference for eco-friendly travel options and platforms that facilitate sustainable choices.
- Last-Minute Bookings: The rise of dynamic pricing and mobile app convenience is facilitating more spontaneous travel decisions.
The parent market, encompassing all travel bookings (online and offline), is a massive $3,500 billion industry. The online travel sites segment, while a substantial part of this, represents a significant and growing child market within it. The Online Travel Sites market is projected to reach $1,450.3 billion in 2025, with an estimated growth to $2,400 billion by 2033, showcasing a strong expansion trajectory within the larger travel ecosystem.
Dominant Regions, Countries, or Segments in Online Travel Sites
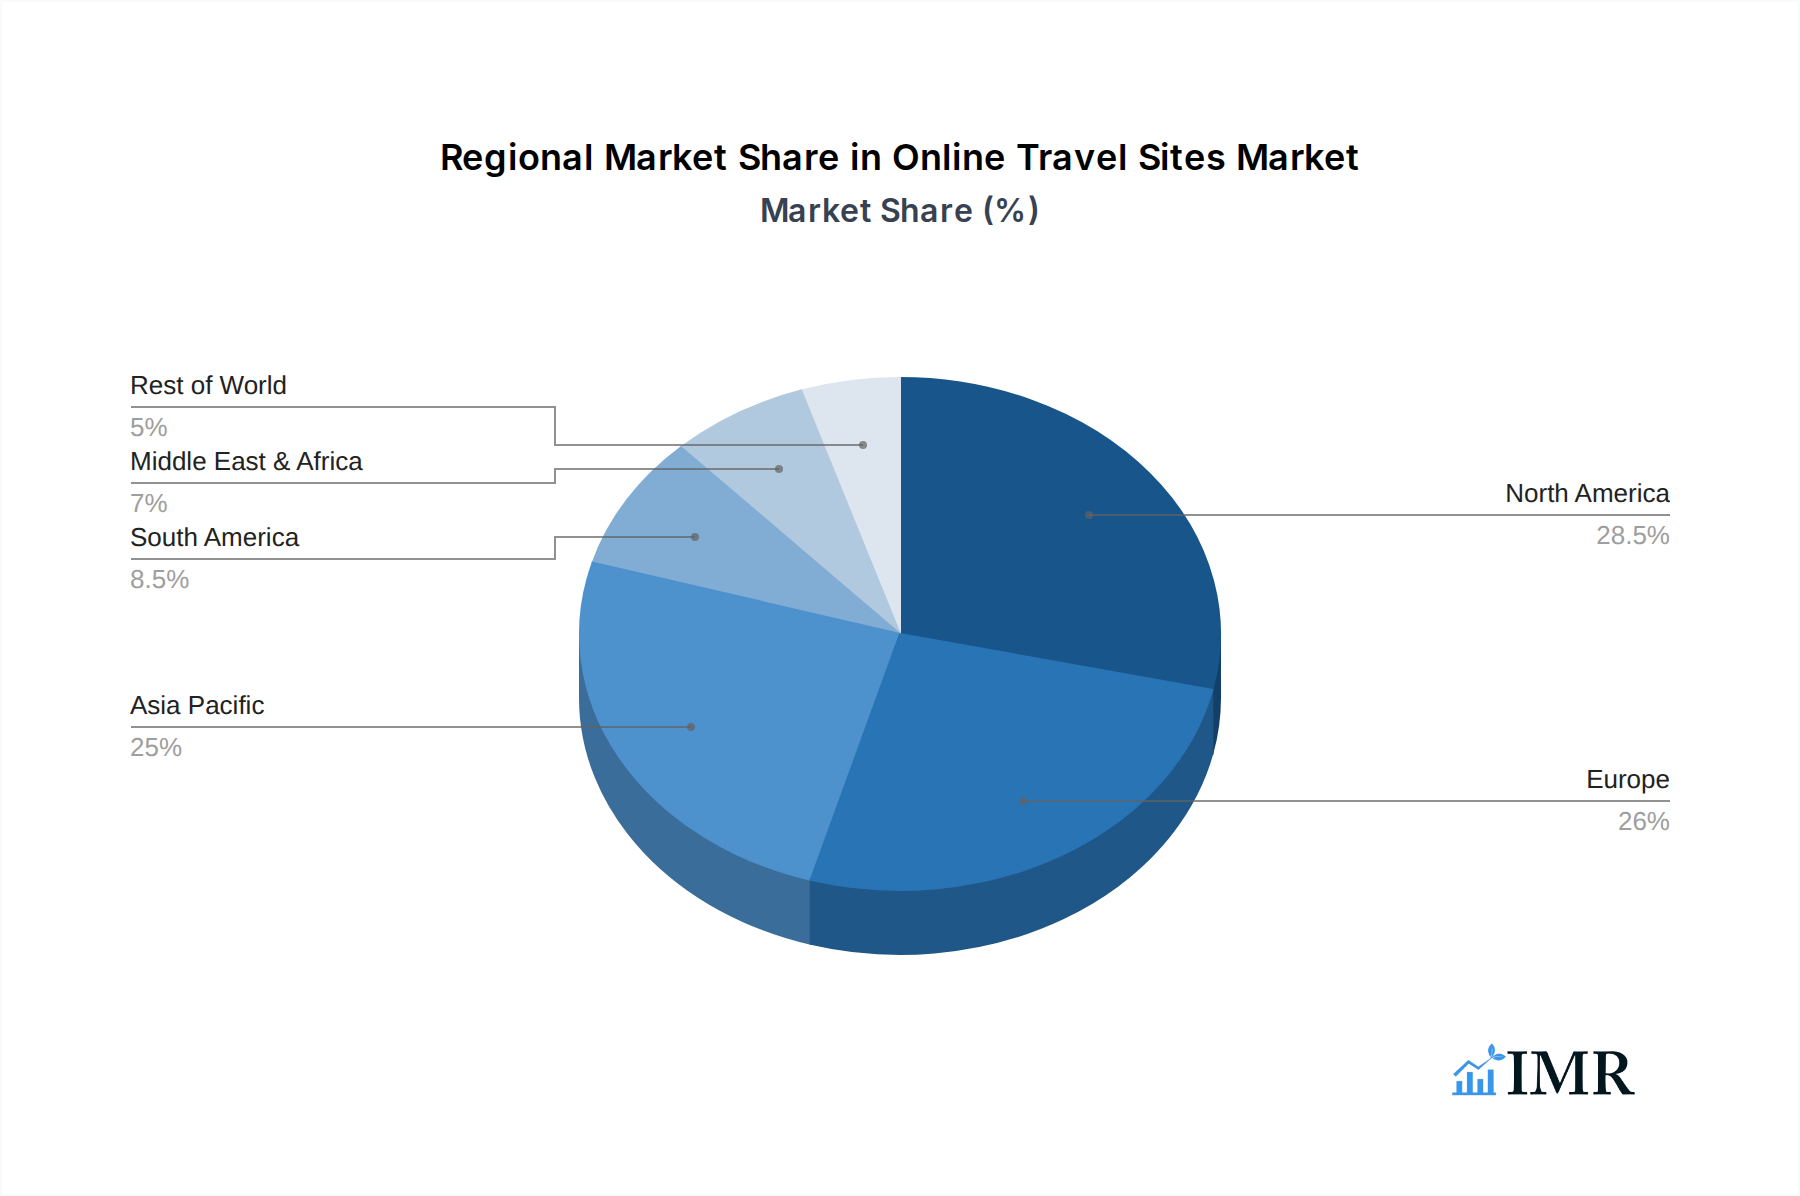
North America currently leads the Online Travel Sites market, driven by its mature digital infrastructure, high disposable incomes, and a deeply ingrained culture of online purchasing. The United States, in particular, represents a colossal market share within this region, with a high adoption rate for both web and WAP-based bookings across personal and group travel applications. The region's dominance is further solidified by the presence of major online travel agencies (OTAs) like Expedia and Priceline, which have a strong brand presence and extensive user base.
- Leading Region: North America.
- Dominant Country: United States.
- Key Drivers in North America:
- Economic Policies: Favorable economic conditions and a robust consumer spending power.
- Infrastructure: Widespread high-speed internet access and advanced mobile network coverage.
- Technological Adoption: Early and widespread adoption of digital platforms and mobile technologies.
- Consumer Habits: A strong preference for online research and booking due to convenience and competitive pricing.
- Market Share in North America: Estimated at 40% of the global online travel sites market value.
- Growth Potential: While mature, sustained growth is expected due to continued innovation and evolving consumer demands.
Dominant Segments Analysis:
Application: Personal: This segment accounts for the largest share of the Online Travel Sites market, estimated at 78% in 2025. Travelers worldwide increasingly prefer the flexibility and control offered by personal booking platforms for leisure trips, solo adventures, and family vacations. The ease of comparing prices and options for flights, accommodations, and activities makes it the most utilized application.
- Key Drivers: Convenience, price transparency, extensive choice, personalized recommendations.
- Growth Trajectory: Steady growth, projected at 7.0% CAGR from 2025-2033.
Application: Group: This segment, encompassing family reunions, corporate travel, and group tours, is a significant and rapidly growing child market, estimated at 18% of the market in 2025. The complexity of coordinating multiple bookings and travelers makes specialized group booking platforms and features within OTAs increasingly valuable.
- Key Drivers: Coordinated itineraries, bulk booking discounts, specialized group planning tools, increased demand for shared travel experiences.
- Growth Trajectory: Robust growth, projected at 9.2% CAGR from 2025-2033.
Application: Other: This segment, often including niche travel like adventure tours, MICE (Meetings, Incentives, Conferences, and Exhibitions), and specialized travel services, holds an estimated 4% of the market in 2025 but demonstrates the highest growth potential.
- Key Drivers: Demand for unique experiences, corporate event planning needs, niche market specialization.
- Growth Trajectory: Highest growth, projected at 10.5% CAGR from 2025-2033.
Types: WEB: The traditional web-based booking platform remains a cornerstone, accounting for approximately 60% of the market in 2025. It offers a comprehensive interface for detailed research and booking.
- Key Drivers: Detailed information presentation, complex search filters, desktop accessibility.
- Market Share (2025): ~60%
Types: WAP (Wireless Application Protocol) / Mobile Apps: This segment is experiencing explosive growth, driven by smartphone ubiquity and the demand for on-the-go booking and management. It is projected to account for 40% of the market in 2025 and is expected to surpass web-based bookings in the coming years.
- Key Drivers: Convenience, speed, real-time notifications, location-based services, seamless integration with mobile wallets.
- Market Share (2025): ~40%
- Growth Trajectory: Significant growth, projected at 8.5% CAGR from 2025-2033.
The Asia Pacific region is expected to witness the fastest growth in the Online Travel Sites market over the forecast period, driven by rising disposable incomes, increasing internet penetration, and a burgeoning middle class eager to explore both domestic and international destinations.
Online Travel Sites Product Landscape
The Online Travel Sites product landscape is characterized by continuous innovation aimed at enhancing user experience and streamlining the booking process. Key product developments include AI-driven personalized itinerary builders, dynamic packaging of flights and accommodations, and the integration of augmented reality (AR) for virtual destination tours. Performance metrics are heavily focused on conversion rates, booking value, customer satisfaction scores, and mobile app engagement. Unique selling propositions often revolve around competitive pricing, exclusive deals, loyalty programs, and comprehensive travel planning tools. Technological advancements are rapidly integrating machine learning for predictive travel recommendations and blockchain for enhanced booking security and transparency.
Key Drivers, Barriers & Challenges in Online Travel Sites
Key Drivers:
- Technological Advancements: AI for personalization, mobile-first design, and seamless user interfaces.
- Economic Growth: Rising disposable incomes and increased leisure spending globally.
- Internet and Smartphone Penetration: Expanding digital access, especially in emerging markets.
- Convenience and Price Transparency: The inherent advantages of online platforms for comparison shopping and instant booking.
- Growth of Experiential Travel: Demand for unique and tailored travel experiences.
Key Barriers & Challenges:
- Intense Competition and Price Wars: Constant pressure to offer competitive pricing can impact profit margins.
- Regulatory Hurdles: Evolving data privacy laws and consumer protection regulations can create compliance challenges.
- Cybersecurity Threats: Protecting sensitive customer data from breaches is a critical concern.
- Dependency on Third-Party Suppliers: Reliance on airlines, hotels, and tour operators can lead to service disruptions.
- Customer Trust and Loyalty: Building and maintaining customer trust in a crowded market.
- Supply Chain Issues: Potential disruptions in travel services due to geopolitical events, natural disasters, or health crises. For example, a xx% increase in booking cancellations due to unforeseen events can impact revenue.
- Regulatory Hurdles: Navigating complex international travel regulations and visa requirements can pose challenges for xx% of international bookings.
- Competitive Pressures: Maintaining market share against established players and emerging disruptors requires continuous innovation and investment.
Emerging Opportunities in Online Travel Sites
Emerging opportunities in the Online Travel Sites market lie in the burgeoning demand for sustainable and eco-friendly travel options, catering to a growing segment of environmentally conscious consumers. The expansion into niche travel segments, such as wellness tourism, adventure travel, and cultural immersion experiences, presents untapped markets. Furthermore, the integration of AI-powered virtual travel assistants and the development of personalized loyalty programs offering hyper-tailored rewards are poised to enhance customer engagement and retention. The "Other" application segment, focused on specialized group and corporate travel, offers significant growth potential as businesses increasingly rely on online platforms for efficient travel management. The use of augmented reality (AR) for destination previews and virtual hotel tours is also gaining traction.
Growth Accelerators in the Online Travel Sites Industry
Several key catalysts are accelerating growth in the Online Travel Sites industry. The relentless pace of technological innovation, particularly in artificial intelligence for personalized recommendations and chatbots for customer service, is a major growth engine. Strategic partnerships between OTAs and travel service providers, such as local experience operators and sustainable tourism initiatives, expand service offerings and market reach. Furthermore, the continuous refinement of mobile booking platforms, ensuring seamless user experiences and robust functionalities, is crucial for capturing a larger share of the mobile-first traveler. Aggressive marketing strategies, including influencer collaborations and targeted digital advertising, are also playing a vital role in driving customer acquisition and brand visibility.
Key Players Shaping the Online Travel Sites Market
- Travelocity
- Expedia
- Orbitz
- Priceline
- CheapOair
- Onetravel
- CheapTickets
- AirGorilla
- Hotwire
- Kayak
Notable Milestones in Online Travel Sites Sector
- 2019: Increased adoption of AI for personalized travel recommendations across major platforms.
- 2020: Surge in demand for flexible booking options and travel insurance due to global uncertainties.
- 2021: Significant growth in mobile bookings and the emergence of contactless travel solutions.
- 2022: Expansion of ancillary services, including tours, activities, and travel insurance packages, becoming a key revenue driver.
- 2023: Enhanced focus on sustainability and ethical travel options integrated into booking platforms.
- 2024: Widespread integration of conversational AI chatbots for real-time customer support and booking assistance.
In-Depth Online Travel Sites Market Outlook
The future of the Online Travel Sites market is exceptionally promising, characterized by sustained growth driven by technological innovation and evolving consumer preferences. The increasing integration of AI for hyper-personalization, the expansion of mobile-first booking ecosystems, and the growing demand for sustainable travel options will be pivotal. Strategic partnerships and a focus on niche market segments, including adventure and wellness tourism, will unlock new revenue streams. The market is poised for significant expansion, with a projected growth to $2,400 billion by 2033, presenting substantial opportunities for both established players and agile newcomers to capture market share and redefine the future of travel. The continued evolution of the "Group" and "Other" application segments signifies a maturing market capable of catering to increasingly complex travel needs.
Online Travel Sites Segmentation
-
1. Application
- 1.1. Personal
- 1.2. Group
- 1.3. Other
-
2. Types
- 2.1. WAP
- 2.2. WEB
Online Travel Sites Segmentation By Geography
-
1. North America
- 1.1. United States
- 1.2. Canada
- 1.3. Mexico
-
2. South America
- 2.1. Brazil
- 2.2. Argentina
- 2.3. Rest of South America
-
3. Europe
- 3.1. United Kingdom
- 3.2. Germany
- 3.3. France
- 3.4. Italy
- 3.5. Spain
- 3.6. Russia
- 3.7. Benelux
- 3.8. Nordics
- 3.9. Rest of Europe
-
4. Middle East & Africa
- 4.1. Turkey
- 4.2. Israel
- 4.3. GCC
- 4.4. North Africa
- 4.5. South Africa
- 4.6. Rest of Middle East & Africa
-
5. Asia Pacific
- 5.1. China
- 5.2. India
- 5.3. Japan
- 5.4. South Korea
- 5.5. ASEAN
- 5.6. Oceania
- 5.7. Rest of Asia Pacific
Online Travel Sites Regional Market Share
Geographic Coverage of Online Travel Sites
Online Travel Sites REPORT HIGHLIGHTS
| Aspects | Details |
|---|---|
| Study Period | 2020-2034 |
| Base Year | 2025 |
| Estimated Year | 2026 |
| Forecast Period | 2026-2034 |
| Historical Period | 2020-2025 |
| Growth Rate | CAGR of 9.75% from 2020-2034 |
| Segmentation |
|
Table of Contents
- 1. Introduction
- 1.1. Research Scope
- 1.2. Market Segmentation
- 1.3. Research Methodology
- 1.4. Definitions and Assumptions
- 2. Executive Summary
- 2.1. Introduction
- 3. Market Dynamics
- 3.1. Introduction
- 3.2. Market Drivers
- 3.3. Market Restrains
- 3.4. Market Trends
- 4. Market Factor Analysis
- 4.1. Porters Five Forces
- 4.2. Supply/Value Chain
- 4.3. PESTEL analysis
- 4.4. Market Entropy
- 4.5. Patent/Trademark Analysis
- 5. Global Online Travel Sites Analysis, Insights and Forecast, 2020-2032
- 5.1. Market Analysis, Insights and Forecast - by Application
- 5.1.1. Personal
- 5.1.2. Group
- 5.1.3. Other
- 5.2. Market Analysis, Insights and Forecast - by Types
- 5.2.1. WAP
- 5.2.2. WEB
- 5.3. Market Analysis, Insights and Forecast - by Region
- 5.3.1. North America
- 5.3.2. South America
- 5.3.3. Europe
- 5.3.4. Middle East & Africa
- 5.3.5. Asia Pacific
- 5.1. Market Analysis, Insights and Forecast - by Application
- 6. North America Online Travel Sites Analysis, Insights and Forecast, 2020-2032
- 6.1. Market Analysis, Insights and Forecast - by Application
- 6.1.1. Personal
- 6.1.2. Group
- 6.1.3. Other
- 6.2. Market Analysis, Insights and Forecast - by Types
- 6.2.1. WAP
- 6.2.2. WEB
- 6.1. Market Analysis, Insights and Forecast - by Application
- 7. South America Online Travel Sites Analysis, Insights and Forecast, 2020-2032
- 7.1. Market Analysis, Insights and Forecast - by Application
- 7.1.1. Personal
- 7.1.2. Group
- 7.1.3. Other
- 7.2. Market Analysis, Insights and Forecast - by Types
- 7.2.1. WAP
- 7.2.2. WEB
- 7.1. Market Analysis, Insights and Forecast - by Application
- 8. Europe Online Travel Sites Analysis, Insights and Forecast, 2020-2032
- 8.1. Market Analysis, Insights and Forecast - by Application
- 8.1.1. Personal
- 8.1.2. Group
- 8.1.3. Other
- 8.2. Market Analysis, Insights and Forecast - by Types
- 8.2.1. WAP
- 8.2.2. WEB
- 8.1. Market Analysis, Insights and Forecast - by Application
- 9. Middle East & Africa Online Travel Sites Analysis, Insights and Forecast, 2020-2032
- 9.1. Market Analysis, Insights and Forecast - by Application
- 9.1.1. Personal
- 9.1.2. Group
- 9.1.3. Other
- 9.2. Market Analysis, Insights and Forecast - by Types
- 9.2.1. WAP
- 9.2.2. WEB
- 9.1. Market Analysis, Insights and Forecast - by Application
- 10. Asia Pacific Online Travel Sites Analysis, Insights and Forecast, 2020-2032
- 10.1. Market Analysis, Insights and Forecast - by Application
- 10.1.1. Personal
- 10.1.2. Group
- 10.1.3. Other
- 10.2. Market Analysis, Insights and Forecast - by Types
- 10.2.1. WAP
- 10.2.2. WEB
- 10.1. Market Analysis, Insights and Forecast - by Application
- 11. Competitive Analysis
- 11.1. Global Market Share Analysis 2025
- 11.2. Company Profiles
- 11.2.1 Travelocity
- 11.2.1.1. Overview
- 11.2.1.2. Products
- 11.2.1.3. SWOT Analysis
- 11.2.1.4. Recent Developments
- 11.2.1.5. Financials (Based on Availability)
- 11.2.2 Expedia
- 11.2.2.1. Overview
- 11.2.2.2. Products
- 11.2.2.3. SWOT Analysis
- 11.2.2.4. Recent Developments
- 11.2.2.5. Financials (Based on Availability)
- 11.2.3 Orbitz
- 11.2.3.1. Overview
- 11.2.3.2. Products
- 11.2.3.3. SWOT Analysis
- 11.2.3.4. Recent Developments
- 11.2.3.5. Financials (Based on Availability)
- 11.2.4 Priceline
- 11.2.4.1. Overview
- 11.2.4.2. Products
- 11.2.4.3. SWOT Analysis
- 11.2.4.4. Recent Developments
- 11.2.4.5. Financials (Based on Availability)
- 11.2.5 CheapOair
- 11.2.5.1. Overview
- 11.2.5.2. Products
- 11.2.5.3. SWOT Analysis
- 11.2.5.4. Recent Developments
- 11.2.5.5. Financials (Based on Availability)
- 11.2.6 Onetravel
- 11.2.6.1. Overview
- 11.2.6.2. Products
- 11.2.6.3. SWOT Analysis
- 11.2.6.4. Recent Developments
- 11.2.6.5. Financials (Based on Availability)
- 11.2.7 CheapTickets
- 11.2.7.1. Overview
- 11.2.7.2. Products
- 11.2.7.3. SWOT Analysis
- 11.2.7.4. Recent Developments
- 11.2.7.5. Financials (Based on Availability)
- 11.2.8 AirGorilla
- 11.2.8.1. Overview
- 11.2.8.2. Products
- 11.2.8.3. SWOT Analysis
- 11.2.8.4. Recent Developments
- 11.2.8.5. Financials (Based on Availability)
- 11.2.9 Hotwire
- 11.2.9.1. Overview
- 11.2.9.2. Products
- 11.2.9.3. SWOT Analysis
- 11.2.9.4. Recent Developments
- 11.2.9.5. Financials (Based on Availability)
- 11.2.10 Kayak
- 11.2.10.1. Overview
- 11.2.10.2. Products
- 11.2.10.3. SWOT Analysis
- 11.2.10.4. Recent Developments
- 11.2.10.5. Financials (Based on Availability)
- 11.2.1 Travelocity
List of Figures
- Figure 1: Global Online Travel Sites Revenue Breakdown (billion, %) by Region 2025 & 2033
- Figure 2: North America Online Travel Sites Revenue (billion), by Application 2025 & 2033
- Figure 3: North America Online Travel Sites Revenue Share (%), by Application 2025 & 2033
- Figure 4: North America Online Travel Sites Revenue (billion), by Types 2025 & 2033
- Figure 5: North America Online Travel Sites Revenue Share (%), by Types 2025 & 2033
- Figure 6: North America Online Travel Sites Revenue (billion), by Country 2025 & 2033
- Figure 7: North America Online Travel Sites Revenue Share (%), by Country 2025 & 2033
- Figure 8: South America Online Travel Sites Revenue (billion), by Application 2025 & 2033
- Figure 9: South America Online Travel Sites Revenue Share (%), by Application 2025 & 2033
- Figure 10: South America Online Travel Sites Revenue (billion), by Types 2025 & 2033
- Figure 11: South America Online Travel Sites Revenue Share (%), by Types 2025 & 2033
- Figure 12: South America Online Travel Sites Revenue (billion), by Country 2025 & 2033
- Figure 13: South America Online Travel Sites Revenue Share (%), by Country 2025 & 2033
- Figure 14: Europe Online Travel Sites Revenue (billion), by Application 2025 & 2033
- Figure 15: Europe Online Travel Sites Revenue Share (%), by Application 2025 & 2033
- Figure 16: Europe Online Travel Sites Revenue (billion), by Types 2025 & 2033
- Figure 17: Europe Online Travel Sites Revenue Share (%), by Types 2025 & 2033
- Figure 18: Europe Online Travel Sites Revenue (billion), by Country 2025 & 2033
- Figure 19: Europe Online Travel Sites Revenue Share (%), by Country 2025 & 2033
- Figure 20: Middle East & Africa Online Travel Sites Revenue (billion), by Application 2025 & 2033
- Figure 21: Middle East & Africa Online Travel Sites Revenue Share (%), by Application 2025 & 2033
- Figure 22: Middle East & Africa Online Travel Sites Revenue (billion), by Types 2025 & 2033
- Figure 23: Middle East & Africa Online Travel Sites Revenue Share (%), by Types 2025 & 2033
- Figure 24: Middle East & Africa Online Travel Sites Revenue (billion), by Country 2025 & 2033
- Figure 25: Middle East & Africa Online Travel Sites Revenue Share (%), by Country 2025 & 2033
- Figure 26: Asia Pacific Online Travel Sites Revenue (billion), by Application 2025 & 2033
- Figure 27: Asia Pacific Online Travel Sites Revenue Share (%), by Application 2025 & 2033
- Figure 28: Asia Pacific Online Travel Sites Revenue (billion), by Types 2025 & 2033
- Figure 29: Asia Pacific Online Travel Sites Revenue Share (%), by Types 2025 & 2033
- Figure 30: Asia Pacific Online Travel Sites Revenue (billion), by Country 2025 & 2033
- Figure 31: Asia Pacific Online Travel Sites Revenue Share (%), by Country 2025 & 2033
List of Tables
- Table 1: Global Online Travel Sites Revenue billion Forecast, by Application 2020 & 2033
- Table 2: Global Online Travel Sites Revenue billion Forecast, by Types 2020 & 2033
- Table 3: Global Online Travel Sites Revenue billion Forecast, by Region 2020 & 2033
- Table 4: Global Online Travel Sites Revenue billion Forecast, by Application 2020 & 2033
- Table 5: Global Online Travel Sites Revenue billion Forecast, by Types 2020 & 2033
- Table 6: Global Online Travel Sites Revenue billion Forecast, by Country 2020 & 2033
- Table 7: United States Online Travel Sites Revenue (billion) Forecast, by Application 2020 & 2033
- Table 8: Canada Online Travel Sites Revenue (billion) Forecast, by Application 2020 & 2033
- Table 9: Mexico Online Travel Sites Revenue (billion) Forecast, by Application 2020 & 2033
- Table 10: Global Online Travel Sites Revenue billion Forecast, by Application 2020 & 2033
- Table 11: Global Online Travel Sites Revenue billion Forecast, by Types 2020 & 2033
- Table 12: Global Online Travel Sites Revenue billion Forecast, by Country 2020 & 2033
- Table 13: Brazil Online Travel Sites Revenue (billion) Forecast, by Application 2020 & 2033
- Table 14: Argentina Online Travel Sites Revenue (billion) Forecast, by Application 2020 & 2033
- Table 15: Rest of South America Online Travel Sites Revenue (billion) Forecast, by Application 2020 & 2033
- Table 16: Global Online Travel Sites Revenue billion Forecast, by Application 2020 & 2033
- Table 17: Global Online Travel Sites Revenue billion Forecast, by Types 2020 & 2033
- Table 18: Global Online Travel Sites Revenue billion Forecast, by Country 2020 & 2033
- Table 19: United Kingdom Online Travel Sites Revenue (billion) Forecast, by Application 2020 & 2033
- Table 20: Germany Online Travel Sites Revenue (billion) Forecast, by Application 2020 & 2033
- Table 21: France Online Travel Sites Revenue (billion) Forecast, by Application 2020 & 2033
- Table 22: Italy Online Travel Sites Revenue (billion) Forecast, by Application 2020 & 2033
- Table 23: Spain Online Travel Sites Revenue (billion) Forecast, by Application 2020 & 2033
- Table 24: Russia Online Travel Sites Revenue (billion) Forecast, by Application 2020 & 2033
- Table 25: Benelux Online Travel Sites Revenue (billion) Forecast, by Application 2020 & 2033
- Table 26: Nordics Online Travel Sites Revenue (billion) Forecast, by Application 2020 & 2033
- Table 27: Rest of Europe Online Travel Sites Revenue (billion) Forecast, by Application 2020 & 2033
- Table 28: Global Online Travel Sites Revenue billion Forecast, by Application 2020 & 2033
- Table 29: Global Online Travel Sites Revenue billion Forecast, by Types 2020 & 2033
- Table 30: Global Online Travel Sites Revenue billion Forecast, by Country 2020 & 2033
- Table 31: Turkey Online Travel Sites Revenue (billion) Forecast, by Application 2020 & 2033
- Table 32: Israel Online Travel Sites Revenue (billion) Forecast, by Application 2020 & 2033
- Table 33: GCC Online Travel Sites Revenue (billion) Forecast, by Application 2020 & 2033
- Table 34: North Africa Online Travel Sites Revenue (billion) Forecast, by Application 2020 & 2033
- Table 35: South Africa Online Travel Sites Revenue (billion) Forecast, by Application 2020 & 2033
- Table 36: Rest of Middle East & Africa Online Travel Sites Revenue (billion) Forecast, by Application 2020 & 2033
- Table 37: Global Online Travel Sites Revenue billion Forecast, by Application 2020 & 2033
- Table 38: Global Online Travel Sites Revenue billion Forecast, by Types 2020 & 2033
- Table 39: Global Online Travel Sites Revenue billion Forecast, by Country 2020 & 2033
- Table 40: China Online Travel Sites Revenue (billion) Forecast, by Application 2020 & 2033
- Table 41: India Online Travel Sites Revenue (billion) Forecast, by Application 2020 & 2033
- Table 42: Japan Online Travel Sites Revenue (billion) Forecast, by Application 2020 & 2033
- Table 43: South Korea Online Travel Sites Revenue (billion) Forecast, by Application 2020 & 2033
- Table 44: ASEAN Online Travel Sites Revenue (billion) Forecast, by Application 2020 & 2033
- Table 45: Oceania Online Travel Sites Revenue (billion) Forecast, by Application 2020 & 2033
- Table 46: Rest of Asia Pacific Online Travel Sites Revenue (billion) Forecast, by Application 2020 & 2033
Frequently Asked Questions
1. What is the projected Compound Annual Growth Rate (CAGR) of the Online Travel Sites?
The projected CAGR is approximately 9.75%.
2. Which companies are prominent players in the Online Travel Sites?
Key companies in the market include Travelocity, Expedia, Orbitz, Priceline, CheapOair, Onetravel, CheapTickets, AirGorilla, Hotwire, Kayak.
3. What are the main segments of the Online Travel Sites?
The market segments include Application, Types.
4. Can you provide details about the market size?
The market size is estimated to be USD 622.6 billion as of 2022.
5. What are some drivers contributing to market growth?
N/A
6. What are the notable trends driving market growth?
N/A
7. Are there any restraints impacting market growth?
N/A
8. Can you provide examples of recent developments in the market?
N/A
9. What pricing options are available for accessing the report?
Pricing options include single-user, multi-user, and enterprise licenses priced at USD 3350.00, USD 5025.00, and USD 6700.00 respectively.
10. Is the market size provided in terms of value or volume?
The market size is provided in terms of value, measured in billion.
11. Are there any specific market keywords associated with the report?
Yes, the market keyword associated with the report is "Online Travel Sites," which aids in identifying and referencing the specific market segment covered.
12. How do I determine which pricing option suits my needs best?
The pricing options vary based on user requirements and access needs. Individual users may opt for single-user licenses, while businesses requiring broader access may choose multi-user or enterprise licenses for cost-effective access to the report.
13. Are there any additional resources or data provided in the Online Travel Sites report?
While the report offers comprehensive insights, it's advisable to review the specific contents or supplementary materials provided to ascertain if additional resources or data are available.
14. How can I stay updated on further developments or reports in the Online Travel Sites?
To stay informed about further developments, trends, and reports in the Online Travel Sites, consider subscribing to industry newsletters, following relevant companies and organizations, or regularly checking reputable industry news sources and publications.
Methodology
Step 1 - Identification of Relevant Samples Size from Population Database


Step 2 - Approaches for Defining Global Market Size (Value, Volume* & Price*)

Note*: In applicable scenarios
Step 3 - Data Sources
Primary Research
- Web Analytics
- Survey Reports
- Research Institute
- Latest Research Reports
- Opinion Leaders
Secondary Research
- Annual Reports
- White Paper
- Latest Press Release
- Industry Association
- Paid Database
- Investor Presentations

Step 4 - Data Triangulation
Involves using different sources of information in order to increase the validity of a study
These sources are likely to be stakeholders in a program - participants, other researchers, program staff, other community members, and so on.
Then we put all data in single framework & apply various statistical tools to find out the dynamic on the market.
During the analysis stage, feedback from the stakeholder groups would be compared to determine areas of agreement as well as areas of divergence