

Key Insights
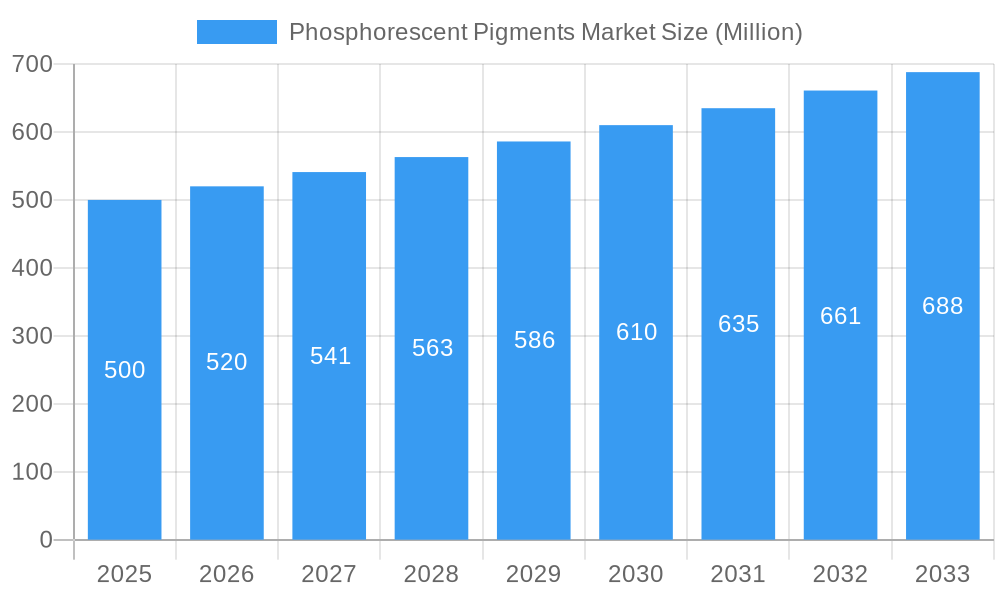
The phosphorescent pigments market is poised for substantial expansion, driven by escalating demand across a spectrum of applications. With a projected Compound Annual Growth Rate (CAGR) of 15.73%, the market is expected to reach approximately 6.88 billion by the base year 2025. Key contributing segments include paints & coatings, plastics, and printing inks, all benefiting from the increasing need for enhanced safety, aesthetic appeal, and novel product designs. Dominant pigment types, zinc sulfide and strontium aluminate, offer distinct luminescent properties tailored to specific application needs. Despite challenges such as evolving environmental regulations and the emergence of alternative technologies, continuous innovation in pigment formulations, coupled with advancements in brightness and longevity, and expanding use in burgeoning markets, particularly in Asia-Pacific, are anticipated to propel market growth. The market exhibits moderate fragmentation, with major players including Badger Color Concentrates, Honeywell International Inc., and LuminoChem Ltd. Regional expansion is expected to be fueled by infrastructure development and rising disposable incomes in developing economies. While North America and Europe currently lead in market share, the Asia-Pacific region is projected to experience the most significant growth due to rapid industrialization and urbanization.

Phosphorescent Pigments Market Market Size (In Billion)
The phosphorescent pigments market forecast indicates a sustained growth trajectory, underpinned by current CAGR trends and anticipated technological advancements. Emerging applications in security marking, energy-efficient lighting, and displays are set to further stimulate market expansion. Ongoing research and development (R&D) focused on improving pigment characteristics, including brightness, persistence, and color spectrum, will continue to be a primary demand driver. Industry players are increasingly prioritizing sustainable production methods and eco-friendly pigment formulations to align with stringent environmental standards and maintain competitive advantage. Market expansion is closely correlated with global economic growth and construction activity, serving as a key economic indicator. Strategic partnerships and mergers and acquisitions are also expected to significantly influence the market landscape.
Phosphorescent Pigments Market Company Market Share
Phosphorescent Pigments Market: A Comprehensive Report (2019-2033)
This comprehensive report offers an in-depth analysis of the phosphorescent pigments market, encompassing market dynamics, growth trends, regional analysis, product landscape, key players, and future outlook. The study period covers 2019-2033, with 2025 as the base and estimated year. The report segments the market by type (Zinc Sulfide, Strontium Aluminate, Other Types) and application (Paints & Coatings, Plastics, Printing Inks, Textiles, Other Applications), providing granular insights into market size and growth across various segments and geographies. The report's value is in Million USD.
Phosphorescent Pigments Market Dynamics & Structure
The phosphorescent pigments market is characterized by moderate concentration, with several key players dominating significant market shares. Technological innovation, particularly in enhancing luminance and longevity, is a key driver, while stringent environmental regulations influence product formulations and manufacturing processes. The market experiences competition from alternative technologies like electroluminescent materials. End-user demographics, primarily concentrated in the construction, automotive, and printing industries, shape market demand. Mergers and acquisitions (M&A) activity is relatively low, though strategic partnerships for technology licensing and distribution are common.
- Market Concentration: Moderately concentrated, with top 5 players holding approximately xx% market share in 2025.
- Technological Innovation: Focus on enhancing luminance, durability, and cost-effectiveness drives innovation.
- Regulatory Framework: Stringent environmental regulations impacting material composition and waste management.
- Competitive Substitutes: Electroluminescent materials pose a competitive threat in specific niche applications.
- End-User Demographics: Predominantly construction, automotive, and printing industries.
- M&A Activity: Relatively low, with strategic partnerships more prevalent. xx M&A deals recorded between 2019-2024.
Phosphorescent Pigments Market Growth Trends & Insights
The global phosphorescent pigments market exhibited a CAGR of xx% during the historical period (2019-2024), reaching a value of xx Million USD in 2024. The market is projected to grow at a CAGR of xx% during the forecast period (2025-2033), driven by increasing demand from the construction and automotive sectors for safety and aesthetic applications. Technological advancements, such as the development of longer-lasting and brighter pigments, are further accelerating market growth. Consumer preference shifts towards sustainable and environmentally friendly products are also influencing market trends. Market penetration in emerging economies is expected to increase significantly, fueled by rising infrastructure development and urbanization.
Dominant Regions, Countries, or Segments in Phosphorescent Pigments Market
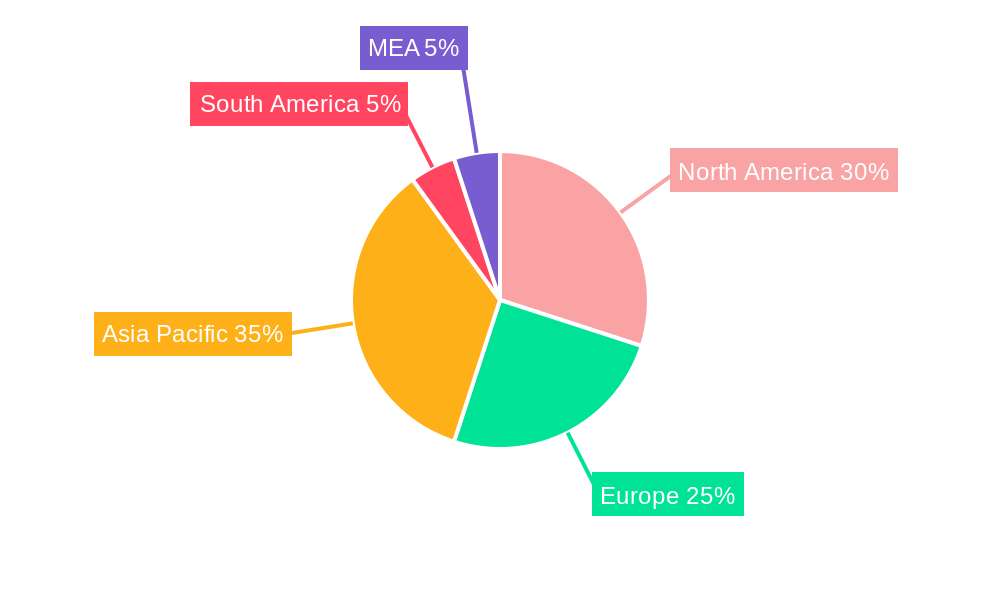
North America currently holds the largest market share, primarily driven by strong demand from the paints & coatings and plastics industries. However, Asia-Pacific is poised for significant growth, fueled by rapid infrastructure development and increasing adoption in emerging economies. Within the segments, Strontium Aluminate is the leading type due to its superior luminance and longer persistence. The Paints & Coatings application segment dominates overall market share due to its widespread use in safety and decorative applications.
- Key Drivers - North America: Established infrastructure, strong regulatory framework, high adoption rates.
- Key Drivers - Asia-Pacific: Rapid infrastructure development, urbanization, increasing disposable income.
- Dominant Segment (Type): Strontium Aluminate (xx% market share in 2025) due to its superior performance characteristics.
- Dominant Segment (Application): Paints & Coatings (xx% market share in 2025) due to wide usage in safety markings and decorative applications.
Phosphorescent Pigments Market Product Landscape
Phosphorescent pigments are continuously being improved to enhance brightness, persistence, and color range. Innovations focus on developing environmentally friendly formulations with reduced toxicity and improved durability. The unique selling proposition lies in their ability to provide long-lasting glow in the dark effects, making them ideal for safety and aesthetic applications. Advances in nanotechnology are being explored to enhance performance and reduce costs.
Key Drivers, Barriers & Challenges in Phosphorescent Pigments Market
Key Drivers: Growing demand from construction and automotive sectors for safety applications, increasing adoption in decorative applications, technological advancements leading to improved performance.
Key Challenges: High production costs, potential toxicity concerns related to certain pigment compositions, competition from alternative technologies, and fluctuations in raw material prices. Supply chain disruptions can lead to production delays and increased costs, impacting market growth by an estimated xx% annually. Stringent environmental regulations increase compliance costs.
Emerging Opportunities in Phosphorescent Pigments Market
Untapped markets in developing economies present significant opportunities. Innovative applications in textiles, consumer electronics, and personal care products are expected to fuel market expansion. Evolving consumer preference towards sustainable products is driving demand for eco-friendly phosphorescent pigments.
Growth Accelerators in the Phosphorescent Pigments Market Industry
Technological breakthroughs in enhancing pigment performance and reducing production costs are key accelerators. Strategic partnerships for technology licensing and distribution will expand market reach. Market expansion strategies focusing on emerging economies with strong infrastructure development will drive long-term growth.
Key Players Shaping the Phosphorescent Pigments Market Market
- Badger Color Concentrates
- Honeywell International Inc (Honeywell International Inc)
- LuminoChem Ltd
- United Mineral and Chemical Corp
- GloTech International Ltd
- Nemoto & Co Ltd
- Kremer Pigmente
- Nemoto Lumi-Materials Company Limited
- Radiant Color NV
- Allureglow International
Notable Milestones in Phosphorescent Pigments Market Sector
- 2020: Introduction of a new strontium aluminate pigment with enhanced luminance by LuminoChem Ltd.
- 2022: Badger Color Concentrates launches a sustainable, eco-friendly phosphorescent pigment line.
- 2023: Honeywell International Inc. acquires a smaller pigment manufacturer, expanding its market share. (Further milestones can be added here with specific dates).
In-Depth Phosphorescent Pigments Market Market Outlook
The phosphorescent pigments market is poised for robust growth, driven by continuous technological innovation and expanding applications across various industries. Strategic partnerships and market expansion into emerging economies will further accelerate market growth. Focus on developing eco-friendly and cost-effective formulations will shape future market dynamics, creating significant opportunities for market players.
Phosphorescent Pigments Market Segmentation
-
1. Type
- 1.1. Zinc Sulfide
- 1.2. Strontium Aluminate
- 1.3. Other Types
-
2. Application
- 2.1. Paints & Coatings
- 2.2. Plastics
- 2.3. Printing Inks
- 2.4. Textiles
- 2.5. Other Application
Phosphorescent Pigments Market Segmentation By Geography
-
1. Asia Pacific
- 1.1. China
- 1.2. India
- 1.3. Japan
- 1.4. South Korea
- 1.5. Rest of Asia Pacific
-
2. North America
- 2.1. United States
- 2.2. Canada
- 2.3. Mexico
-
3. Europe
- 3.1. Germany
- 3.2. United Kingdom
- 3.3. Italy
- 3.4. France
- 3.5. Rest of Europe
-
4. South America
- 4.1. Brazil
- 4.2. Argentina
- 4.3. Rest of South America
- 5. Middle East
-
6. Saudi Arabia
- 6.1. South Africa
- 6.2. Rest of Middle East
Phosphorescent Pigments Market Regional Market Share
Geographic Coverage of Phosphorescent Pigments Market
Phosphorescent Pigments Market REPORT HIGHLIGHTS
| Aspects | Details |
|---|---|
| Study Period | 2020-2034 |
| Base Year | 2025 |
| Estimated Year | 2026 |
| Forecast Period | 2026-2034 |
| Historical Period | 2020-2025 |
| Growth Rate | CAGR of 15.73% from 2020-2034 |
| Segmentation |
|
Table of Contents
- 1. Introduction
- 1.1. Research Scope
- 1.2. Market Segmentation
- 1.3. Research Objective
- 1.4. Definitions and Assumptions
- 2. Executive Summary
- 2.1. Market Snapshot
- 3. Market Dynamics
- 3.1. Market Drivers
- 3.2. Market Restrains
- 3.3. Market Trends
- 3.4. Market Opportunities
- 4. Market Factor Analysis
- 4.1. Porters Five Forces
- 4.1.1. Bargaining Power of Suppliers
- 4.1.2. Bargaining Power of Buyers
- 4.1.3. Threat of New Entrants
- 4.1.4. Threat of Substitutes
- 4.1.5. Competitive Rivalry
- 4.2. PESTEL analysis
- 4.3. BCG Analysis
- 4.3.1. Stars (High Growth, High Market Share)
- 4.3.2. Cash Cows (Low Growth, High Market Share)
- 4.3.3. Question Mark (High Growth, Low Market Share)
- 4.3.4. Dogs (Low Growth, Low Market Share)
- 4.4. Ansoff Matrix Analysis
- 4.5. Supply Chain Analysis
- 4.6. Regulatory Landscape
- 4.7. Current Market Potential and Opportunity Assessment (TAM–SAM–SOM Framework)
- 4.8. IMR Analyst Note
- 4.1. Porters Five Forces
- 5. Market Analysis, Insights and Forecast 2021-2033
- 5.1. Market Analysis, Insights and Forecast - by Type
- 5.1.1. Zinc Sulfide
- 5.1.2. Strontium Aluminate
- 5.1.3. Other Types
- 5.2. Market Analysis, Insights and Forecast - by Application
- 5.2.1. Paints & Coatings
- 5.2.2. Plastics
- 5.2.3. Printing Inks
- 5.2.4. Textiles
- 5.2.5. Other Application
- 5.3. Market Analysis, Insights and Forecast - by Region
- 5.3.1. Asia Pacific
- 5.3.2. North America
- 5.3.3. Europe
- 5.3.4. South America
- 5.3.5. Middle East
- 5.3.6. Saudi Arabia
- 5.1. Market Analysis, Insights and Forecast - by Type
- 6. Global Phosphorescent Pigments Market Analysis, Insights and Forecast, 2021-2033
- 6.1. Market Analysis, Insights and Forecast - by Type
- 6.1.1. Zinc Sulfide
- 6.1.2. Strontium Aluminate
- 6.1.3. Other Types
- 6.2. Market Analysis, Insights and Forecast - by Application
- 6.2.1. Paints & Coatings
- 6.2.2. Plastics
- 6.2.3. Printing Inks
- 6.2.4. Textiles
- 6.2.5. Other Application
- 6.1. Market Analysis, Insights and Forecast - by Type
- 7. Asia Pacific Phosphorescent Pigments Market Analysis, Insights and Forecast, 2020-2032
- 7.1. Market Analysis, Insights and Forecast - by Type
- 7.1.1. Zinc Sulfide
- 7.1.2. Strontium Aluminate
- 7.1.3. Other Types
- 7.2. Market Analysis, Insights and Forecast - by Application
- 7.2.1. Paints & Coatings
- 7.2.2. Plastics
- 7.2.3. Printing Inks
- 7.2.4. Textiles
- 7.2.5. Other Application
- 7.1. Market Analysis, Insights and Forecast - by Type
- 8. North America Phosphorescent Pigments Market Analysis, Insights and Forecast, 2020-2032
- 8.1. Market Analysis, Insights and Forecast - by Type
- 8.1.1. Zinc Sulfide
- 8.1.2. Strontium Aluminate
- 8.1.3. Other Types
- 8.2. Market Analysis, Insights and Forecast - by Application
- 8.2.1. Paints & Coatings
- 8.2.2. Plastics
- 8.2.3. Printing Inks
- 8.2.4. Textiles
- 8.2.5. Other Application
- 8.1. Market Analysis, Insights and Forecast - by Type
- 9. Europe Phosphorescent Pigments Market Analysis, Insights and Forecast, 2020-2032
- 9.1. Market Analysis, Insights and Forecast - by Type
- 9.1.1. Zinc Sulfide
- 9.1.2. Strontium Aluminate
- 9.1.3. Other Types
- 9.2. Market Analysis, Insights and Forecast - by Application
- 9.2.1. Paints & Coatings
- 9.2.2. Plastics
- 9.2.3. Printing Inks
- 9.2.4. Textiles
- 9.2.5. Other Application
- 9.1. Market Analysis, Insights and Forecast - by Type
- 10. South America Phosphorescent Pigments Market Analysis, Insights and Forecast, 2020-2032
- 10.1. Market Analysis, Insights and Forecast - by Type
- 10.1.1. Zinc Sulfide
- 10.1.2. Strontium Aluminate
- 10.1.3. Other Types
- 10.2. Market Analysis, Insights and Forecast - by Application
- 10.2.1. Paints & Coatings
- 10.2.2. Plastics
- 10.2.3. Printing Inks
- 10.2.4. Textiles
- 10.2.5. Other Application
- 10.1. Market Analysis, Insights and Forecast - by Type
- 11. Middle East Phosphorescent Pigments Market Analysis, Insights and Forecast, 2020-2032
- 11.1. Market Analysis, Insights and Forecast - by Type
- 11.1.1. Zinc Sulfide
- 11.1.2. Strontium Aluminate
- 11.1.3. Other Types
- 11.2. Market Analysis, Insights and Forecast - by Application
- 11.2.1. Paints & Coatings
- 11.2.2. Plastics
- 11.2.3. Printing Inks
- 11.2.4. Textiles
- 11.2.5. Other Application
- 11.1. Market Analysis, Insights and Forecast - by Type
- 12. Saudi Arabia Phosphorescent Pigments Market Analysis, Insights and Forecast, 2020-2032
- 12.1. Market Analysis, Insights and Forecast - by Type
- 12.1.1. Zinc Sulfide
- 12.1.2. Strontium Aluminate
- 12.1.3. Other Types
- 12.2. Market Analysis, Insights and Forecast - by Application
- 12.2.1. Paints & Coatings
- 12.2.2. Plastics
- 12.2.3. Printing Inks
- 12.2.4. Textiles
- 12.2.5. Other Application
- 12.1. Market Analysis, Insights and Forecast - by Type
- 13. Competitive Analysis
- 13.1. Company Profiles
- 13.1.1 Badger Color Concentrates
- 13.1.1.1. Company Overview
- 13.1.1.2. Products
- 13.1.1.3. Company Financials
- 13.1.1.4. SWOT Analysis
- 13.1.2 Honeywell International Inc
- 13.1.2.1. Company Overview
- 13.1.2.2. Products
- 13.1.2.3. Company Financials
- 13.1.2.4. SWOT Analysis
- 13.1.3 LuminoChem Ltd
- 13.1.3.1. Company Overview
- 13.1.3.2. Products
- 13.1.3.3. Company Financials
- 13.1.3.4. SWOT Analysis
- 13.1.4 United Mineral and Chemical Corp
- 13.1.4.1. Company Overview
- 13.1.4.2. Products
- 13.1.4.3. Company Financials
- 13.1.4.4. SWOT Analysis
- 13.1.5 GloTech International Ltd
- 13.1.5.1. Company Overview
- 13.1.5.2. Products
- 13.1.5.3. Company Financials
- 13.1.5.4. SWOT Analysis
- 13.1.6 Nemoto & Co Ltd
- 13.1.6.1. Company Overview
- 13.1.6.2. Products
- 13.1.6.3. Company Financials
- 13.1.6.4. SWOT Analysis
- 13.1.7 Kremer Pigmente
- 13.1.7.1. Company Overview
- 13.1.7.2. Products
- 13.1.7.3. Company Financials
- 13.1.7.4. SWOT Analysis
- 13.1.8 Nemoto Lumi-Materials Company Limited
- 13.1.8.1. Company Overview
- 13.1.8.2. Products
- 13.1.8.3. Company Financials
- 13.1.8.4. SWOT Analysis
- 13.1.9 Radiant Color NV
- 13.1.9.1. Company Overview
- 13.1.9.2. Products
- 13.1.9.3. Company Financials
- 13.1.9.4. SWOT Analysis
- 13.1.10 Allureglow International
- 13.1.10.1. Company Overview
- 13.1.10.2. Products
- 13.1.10.3. Company Financials
- 13.1.10.4. SWOT Analysis
- 13.1.1 Badger Color Concentrates
- 13.2. Market Entropy
- 13.2.1 Company's Key Areas Served
- 13.2.2 Recent Developments
- 13.3. Company Market Share Analysis 2025
- 13.3.1 Top 5 Companies Market Share Analysis
- 13.3.2 Top 3 Companies Market Share Analysis
- 13.4. List of Potential Customers
- 14. Research Methodology
List of Figures
- Figure 1: Global Phosphorescent Pigments Market Revenue Breakdown (billion, %) by Region 2025 & 2033
- Figure 2: Global Phosphorescent Pigments Market Volume Breakdown (K Tons, %) by Region 2025 & 2033
- Figure 3: Asia Pacific Phosphorescent Pigments Market Revenue (billion), by Type 2025 & 2033
- Figure 4: Asia Pacific Phosphorescent Pigments Market Volume (K Tons), by Type 2025 & 2033
- Figure 5: Asia Pacific Phosphorescent Pigments Market Revenue Share (%), by Type 2025 & 2033
- Figure 6: Asia Pacific Phosphorescent Pigments Market Volume Share (%), by Type 2025 & 2033
- Figure 7: Asia Pacific Phosphorescent Pigments Market Revenue (billion), by Application 2025 & 2033
- Figure 8: Asia Pacific Phosphorescent Pigments Market Volume (K Tons), by Application 2025 & 2033
- Figure 9: Asia Pacific Phosphorescent Pigments Market Revenue Share (%), by Application 2025 & 2033
- Figure 10: Asia Pacific Phosphorescent Pigments Market Volume Share (%), by Application 2025 & 2033
- Figure 11: Asia Pacific Phosphorescent Pigments Market Revenue (billion), by Country 2025 & 2033
- Figure 12: Asia Pacific Phosphorescent Pigments Market Volume (K Tons), by Country 2025 & 2033
- Figure 13: Asia Pacific Phosphorescent Pigments Market Revenue Share (%), by Country 2025 & 2033
- Figure 14: Asia Pacific Phosphorescent Pigments Market Volume Share (%), by Country 2025 & 2033
- Figure 15: North America Phosphorescent Pigments Market Revenue (billion), by Type 2025 & 2033
- Figure 16: North America Phosphorescent Pigments Market Volume (K Tons), by Type 2025 & 2033
- Figure 17: North America Phosphorescent Pigments Market Revenue Share (%), by Type 2025 & 2033
- Figure 18: North America Phosphorescent Pigments Market Volume Share (%), by Type 2025 & 2033
- Figure 19: North America Phosphorescent Pigments Market Revenue (billion), by Application 2025 & 2033
- Figure 20: North America Phosphorescent Pigments Market Volume (K Tons), by Application 2025 & 2033
- Figure 21: North America Phosphorescent Pigments Market Revenue Share (%), by Application 2025 & 2033
- Figure 22: North America Phosphorescent Pigments Market Volume Share (%), by Application 2025 & 2033
- Figure 23: North America Phosphorescent Pigments Market Revenue (billion), by Country 2025 & 2033
- Figure 24: North America Phosphorescent Pigments Market Volume (K Tons), by Country 2025 & 2033
- Figure 25: North America Phosphorescent Pigments Market Revenue Share (%), by Country 2025 & 2033
- Figure 26: North America Phosphorescent Pigments Market Volume Share (%), by Country 2025 & 2033
- Figure 27: Europe Phosphorescent Pigments Market Revenue (billion), by Type 2025 & 2033
- Figure 28: Europe Phosphorescent Pigments Market Volume (K Tons), by Type 2025 & 2033
- Figure 29: Europe Phosphorescent Pigments Market Revenue Share (%), by Type 2025 & 2033
- Figure 30: Europe Phosphorescent Pigments Market Volume Share (%), by Type 2025 & 2033
- Figure 31: Europe Phosphorescent Pigments Market Revenue (billion), by Application 2025 & 2033
- Figure 32: Europe Phosphorescent Pigments Market Volume (K Tons), by Application 2025 & 2033
- Figure 33: Europe Phosphorescent Pigments Market Revenue Share (%), by Application 2025 & 2033
- Figure 34: Europe Phosphorescent Pigments Market Volume Share (%), by Application 2025 & 2033
- Figure 35: Europe Phosphorescent Pigments Market Revenue (billion), by Country 2025 & 2033
- Figure 36: Europe Phosphorescent Pigments Market Volume (K Tons), by Country 2025 & 2033
- Figure 37: Europe Phosphorescent Pigments Market Revenue Share (%), by Country 2025 & 2033
- Figure 38: Europe Phosphorescent Pigments Market Volume Share (%), by Country 2025 & 2033
- Figure 39: South America Phosphorescent Pigments Market Revenue (billion), by Type 2025 & 2033
- Figure 40: South America Phosphorescent Pigments Market Volume (K Tons), by Type 2025 & 2033
- Figure 41: South America Phosphorescent Pigments Market Revenue Share (%), by Type 2025 & 2033
- Figure 42: South America Phosphorescent Pigments Market Volume Share (%), by Type 2025 & 2033
- Figure 43: South America Phosphorescent Pigments Market Revenue (billion), by Application 2025 & 2033
- Figure 44: South America Phosphorescent Pigments Market Volume (K Tons), by Application 2025 & 2033
- Figure 45: South America Phosphorescent Pigments Market Revenue Share (%), by Application 2025 & 2033
- Figure 46: South America Phosphorescent Pigments Market Volume Share (%), by Application 2025 & 2033
- Figure 47: South America Phosphorescent Pigments Market Revenue (billion), by Country 2025 & 2033
- Figure 48: South America Phosphorescent Pigments Market Volume (K Tons), by Country 2025 & 2033
- Figure 49: South America Phosphorescent Pigments Market Revenue Share (%), by Country 2025 & 2033
- Figure 50: South America Phosphorescent Pigments Market Volume Share (%), by Country 2025 & 2033
- Figure 51: Middle East Phosphorescent Pigments Market Revenue (billion), by Type 2025 & 2033
- Figure 52: Middle East Phosphorescent Pigments Market Volume (K Tons), by Type 2025 & 2033
- Figure 53: Middle East Phosphorescent Pigments Market Revenue Share (%), by Type 2025 & 2033
- Figure 54: Middle East Phosphorescent Pigments Market Volume Share (%), by Type 2025 & 2033
- Figure 55: Middle East Phosphorescent Pigments Market Revenue (billion), by Application 2025 & 2033
- Figure 56: Middle East Phosphorescent Pigments Market Volume (K Tons), by Application 2025 & 2033
- Figure 57: Middle East Phosphorescent Pigments Market Revenue Share (%), by Application 2025 & 2033
- Figure 58: Middle East Phosphorescent Pigments Market Volume Share (%), by Application 2025 & 2033
- Figure 59: Middle East Phosphorescent Pigments Market Revenue (billion), by Country 2025 & 2033
- Figure 60: Middle East Phosphorescent Pigments Market Volume (K Tons), by Country 2025 & 2033
- Figure 61: Middle East Phosphorescent Pigments Market Revenue Share (%), by Country 2025 & 2033
- Figure 62: Middle East Phosphorescent Pigments Market Volume Share (%), by Country 2025 & 2033
- Figure 63: Saudi Arabia Phosphorescent Pigments Market Revenue (billion), by Type 2025 & 2033
- Figure 64: Saudi Arabia Phosphorescent Pigments Market Volume (K Tons), by Type 2025 & 2033
- Figure 65: Saudi Arabia Phosphorescent Pigments Market Revenue Share (%), by Type 2025 & 2033
- Figure 66: Saudi Arabia Phosphorescent Pigments Market Volume Share (%), by Type 2025 & 2033
- Figure 67: Saudi Arabia Phosphorescent Pigments Market Revenue (billion), by Application 2025 & 2033
- Figure 68: Saudi Arabia Phosphorescent Pigments Market Volume (K Tons), by Application 2025 & 2033
- Figure 69: Saudi Arabia Phosphorescent Pigments Market Revenue Share (%), by Application 2025 & 2033
- Figure 70: Saudi Arabia Phosphorescent Pigments Market Volume Share (%), by Application 2025 & 2033
- Figure 71: Saudi Arabia Phosphorescent Pigments Market Revenue (billion), by Country 2025 & 2033
- Figure 72: Saudi Arabia Phosphorescent Pigments Market Volume (K Tons), by Country 2025 & 2033
- Figure 73: Saudi Arabia Phosphorescent Pigments Market Revenue Share (%), by Country 2025 & 2033
- Figure 74: Saudi Arabia Phosphorescent Pigments Market Volume Share (%), by Country 2025 & 2033
List of Tables
- Table 1: Global Phosphorescent Pigments Market Revenue billion Forecast, by Type 2020 & 2033
- Table 2: Global Phosphorescent Pigments Market Volume K Tons Forecast, by Type 2020 & 2033
- Table 3: Global Phosphorescent Pigments Market Revenue billion Forecast, by Application 2020 & 2033
- Table 4: Global Phosphorescent Pigments Market Volume K Tons Forecast, by Application 2020 & 2033
- Table 5: Global Phosphorescent Pigments Market Revenue billion Forecast, by Region 2020 & 2033
- Table 6: Global Phosphorescent Pigments Market Volume K Tons Forecast, by Region 2020 & 2033
- Table 7: Global Phosphorescent Pigments Market Revenue billion Forecast, by Type 2020 & 2033
- Table 8: Global Phosphorescent Pigments Market Volume K Tons Forecast, by Type 2020 & 2033
- Table 9: Global Phosphorescent Pigments Market Revenue billion Forecast, by Application 2020 & 2033
- Table 10: Global Phosphorescent Pigments Market Volume K Tons Forecast, by Application 2020 & 2033
- Table 11: Global Phosphorescent Pigments Market Revenue billion Forecast, by Country 2020 & 2033
- Table 12: Global Phosphorescent Pigments Market Volume K Tons Forecast, by Country 2020 & 2033
- Table 13: China Phosphorescent Pigments Market Revenue (billion) Forecast, by Application 2020 & 2033
- Table 14: China Phosphorescent Pigments Market Volume (K Tons) Forecast, by Application 2020 & 2033
- Table 15: India Phosphorescent Pigments Market Revenue (billion) Forecast, by Application 2020 & 2033
- Table 16: India Phosphorescent Pigments Market Volume (K Tons) Forecast, by Application 2020 & 2033
- Table 17: Japan Phosphorescent Pigments Market Revenue (billion) Forecast, by Application 2020 & 2033
- Table 18: Japan Phosphorescent Pigments Market Volume (K Tons) Forecast, by Application 2020 & 2033
- Table 19: South Korea Phosphorescent Pigments Market Revenue (billion) Forecast, by Application 2020 & 2033
- Table 20: South Korea Phosphorescent Pigments Market Volume (K Tons) Forecast, by Application 2020 & 2033
- Table 21: Rest of Asia Pacific Phosphorescent Pigments Market Revenue (billion) Forecast, by Application 2020 & 2033
- Table 22: Rest of Asia Pacific Phosphorescent Pigments Market Volume (K Tons) Forecast, by Application 2020 & 2033
- Table 23: Global Phosphorescent Pigments Market Revenue billion Forecast, by Type 2020 & 2033
- Table 24: Global Phosphorescent Pigments Market Volume K Tons Forecast, by Type 2020 & 2033
- Table 25: Global Phosphorescent Pigments Market Revenue billion Forecast, by Application 2020 & 2033
- Table 26: Global Phosphorescent Pigments Market Volume K Tons Forecast, by Application 2020 & 2033
- Table 27: Global Phosphorescent Pigments Market Revenue billion Forecast, by Country 2020 & 2033
- Table 28: Global Phosphorescent Pigments Market Volume K Tons Forecast, by Country 2020 & 2033
- Table 29: United States Phosphorescent Pigments Market Revenue (billion) Forecast, by Application 2020 & 2033
- Table 30: United States Phosphorescent Pigments Market Volume (K Tons) Forecast, by Application 2020 & 2033
- Table 31: Canada Phosphorescent Pigments Market Revenue (billion) Forecast, by Application 2020 & 2033
- Table 32: Canada Phosphorescent Pigments Market Volume (K Tons) Forecast, by Application 2020 & 2033
- Table 33: Mexico Phosphorescent Pigments Market Revenue (billion) Forecast, by Application 2020 & 2033
- Table 34: Mexico Phosphorescent Pigments Market Volume (K Tons) Forecast, by Application 2020 & 2033
- Table 35: Global Phosphorescent Pigments Market Revenue billion Forecast, by Type 2020 & 2033
- Table 36: Global Phosphorescent Pigments Market Volume K Tons Forecast, by Type 2020 & 2033
- Table 37: Global Phosphorescent Pigments Market Revenue billion Forecast, by Application 2020 & 2033
- Table 38: Global Phosphorescent Pigments Market Volume K Tons Forecast, by Application 2020 & 2033
- Table 39: Global Phosphorescent Pigments Market Revenue billion Forecast, by Country 2020 & 2033
- Table 40: Global Phosphorescent Pigments Market Volume K Tons Forecast, by Country 2020 & 2033
- Table 41: Germany Phosphorescent Pigments Market Revenue (billion) Forecast, by Application 2020 & 2033
- Table 42: Germany Phosphorescent Pigments Market Volume (K Tons) Forecast, by Application 2020 & 2033
- Table 43: United Kingdom Phosphorescent Pigments Market Revenue (billion) Forecast, by Application 2020 & 2033
- Table 44: United Kingdom Phosphorescent Pigments Market Volume (K Tons) Forecast, by Application 2020 & 2033
- Table 45: Italy Phosphorescent Pigments Market Revenue (billion) Forecast, by Application 2020 & 2033
- Table 46: Italy Phosphorescent Pigments Market Volume (K Tons) Forecast, by Application 2020 & 2033
- Table 47: France Phosphorescent Pigments Market Revenue (billion) Forecast, by Application 2020 & 2033
- Table 48: France Phosphorescent Pigments Market Volume (K Tons) Forecast, by Application 2020 & 2033
- Table 49: Rest of Europe Phosphorescent Pigments Market Revenue (billion) Forecast, by Application 2020 & 2033
- Table 50: Rest of Europe Phosphorescent Pigments Market Volume (K Tons) Forecast, by Application 2020 & 2033
- Table 51: Global Phosphorescent Pigments Market Revenue billion Forecast, by Type 2020 & 2033
- Table 52: Global Phosphorescent Pigments Market Volume K Tons Forecast, by Type 2020 & 2033
- Table 53: Global Phosphorescent Pigments Market Revenue billion Forecast, by Application 2020 & 2033
- Table 54: Global Phosphorescent Pigments Market Volume K Tons Forecast, by Application 2020 & 2033
- Table 55: Global Phosphorescent Pigments Market Revenue billion Forecast, by Country 2020 & 2033
- Table 56: Global Phosphorescent Pigments Market Volume K Tons Forecast, by Country 2020 & 2033
- Table 57: Brazil Phosphorescent Pigments Market Revenue (billion) Forecast, by Application 2020 & 2033
- Table 58: Brazil Phosphorescent Pigments Market Volume (K Tons) Forecast, by Application 2020 & 2033
- Table 59: Argentina Phosphorescent Pigments Market Revenue (billion) Forecast, by Application 2020 & 2033
- Table 60: Argentina Phosphorescent Pigments Market Volume (K Tons) Forecast, by Application 2020 & 2033
- Table 61: Rest of South America Phosphorescent Pigments Market Revenue (billion) Forecast, by Application 2020 & 2033
- Table 62: Rest of South America Phosphorescent Pigments Market Volume (K Tons) Forecast, by Application 2020 & 2033
- Table 63: Global Phosphorescent Pigments Market Revenue billion Forecast, by Type 2020 & 2033
- Table 64: Global Phosphorescent Pigments Market Volume K Tons Forecast, by Type 2020 & 2033
- Table 65: Global Phosphorescent Pigments Market Revenue billion Forecast, by Application 2020 & 2033
- Table 66: Global Phosphorescent Pigments Market Volume K Tons Forecast, by Application 2020 & 2033
- Table 67: Global Phosphorescent Pigments Market Revenue billion Forecast, by Country 2020 & 2033
- Table 68: Global Phosphorescent Pigments Market Volume K Tons Forecast, by Country 2020 & 2033
- Table 69: Global Phosphorescent Pigments Market Revenue billion Forecast, by Type 2020 & 2033
- Table 70: Global Phosphorescent Pigments Market Volume K Tons Forecast, by Type 2020 & 2033
- Table 71: Global Phosphorescent Pigments Market Revenue billion Forecast, by Application 2020 & 2033
- Table 72: Global Phosphorescent Pigments Market Volume K Tons Forecast, by Application 2020 & 2033
- Table 73: Global Phosphorescent Pigments Market Revenue billion Forecast, by Country 2020 & 2033
- Table 74: Global Phosphorescent Pigments Market Volume K Tons Forecast, by Country 2020 & 2033
- Table 75: South Africa Phosphorescent Pigments Market Revenue (billion) Forecast, by Application 2020 & 2033
- Table 76: South Africa Phosphorescent Pigments Market Volume (K Tons) Forecast, by Application 2020 & 2033
- Table 77: Rest of Middle East Phosphorescent Pigments Market Revenue (billion) Forecast, by Application 2020 & 2033
- Table 78: Rest of Middle East Phosphorescent Pigments Market Volume (K Tons) Forecast, by Application 2020 & 2033
Frequently Asked Questions
1. What is the projected Compound Annual Growth Rate (CAGR) of the Phosphorescent Pigments Market?
The projected CAGR is approximately 15.73%.
2. Which companies are prominent players in the Phosphorescent Pigments Market?
Key companies in the market include Badger Color Concentrates, Honeywell International Inc, LuminoChem Ltd, United Mineral and Chemical Corp , GloTech International Ltd, Nemoto & Co Ltd, Kremer Pigmente, Nemoto Lumi-Materials Company Limited, Radiant Color NV, Allureglow International.
3. What are the main segments of the Phosphorescent Pigments Market?
The market segments include Type, Application.
4. Can you provide details about the market size?
The market size is estimated to be USD 6.88 billion as of 2022.
5. What are some drivers contributing to market growth?
; Rising demand from paints & coatings; Increasing product application in signage boards.
6. What are the notable trends driving market growth?
Paints & Coatings Dominating the Phosphorescent Pigments Market Growth.
7. Are there any restraints impacting market growth?
Fluctuating Prices of Nickel and Other Alloying Elements; Other Restraints.
8. Can you provide examples of recent developments in the market?
N/A
9. What pricing options are available for accessing the report?
Pricing options include single-user, multi-user, and enterprise licenses priced at USD 4750, USD 5250, and USD 8750 respectively.
10. Is the market size provided in terms of value or volume?
The market size is provided in terms of value, measured in billion and volume, measured in K Tons.
11. Are there any specific market keywords associated with the report?
Yes, the market keyword associated with the report is "Phosphorescent Pigments Market," which aids in identifying and referencing the specific market segment covered.
12. How do I determine which pricing option suits my needs best?
The pricing options vary based on user requirements and access needs. Individual users may opt for single-user licenses, while businesses requiring broader access may choose multi-user or enterprise licenses for cost-effective access to the report.
13. Are there any additional resources or data provided in the Phosphorescent Pigments Market report?
While the report offers comprehensive insights, it's advisable to review the specific contents or supplementary materials provided to ascertain if additional resources or data are available.
14. How can I stay updated on further developments or reports in the Phosphorescent Pigments Market?
To stay informed about further developments, trends, and reports in the Phosphorescent Pigments Market, consider subscribing to industry newsletters, following relevant companies and organizations, or regularly checking reputable industry news sources and publications.
Methodology
Step 1 - Identification of Relevant Samples Size from Population Database


Step 2 - Approaches for Defining Global Market Size (Value, Volume* & Price*)

Note*: In applicable scenarios
Step 3 - Data Sources
Primary Research
- Web Analytics
- Survey Reports
- Research Institute
- Latest Research Reports
- Opinion Leaders
Secondary Research
- Annual Reports
- White Paper
- Latest Press Release
- Industry Association
- Paid Database
- Investor Presentations

Step 4 - Data Triangulation
Involves using different sources of information in order to increase the validity of a study
These sources are likely to be stakeholders in a program - participants, other researchers, program staff, other community members, and so on.
Then we put all data in single framework & apply various statistical tools to find out the dynamic on the market.
During the analysis stage, feedback from the stakeholder groups would be compared to determine areas of agreement as well as areas of divergence