

Key Insights
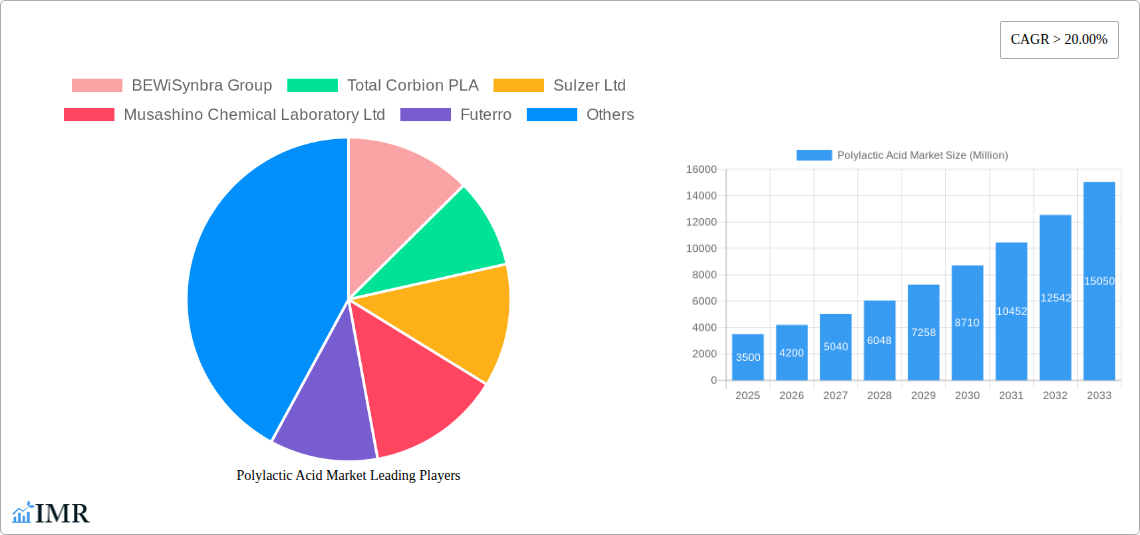
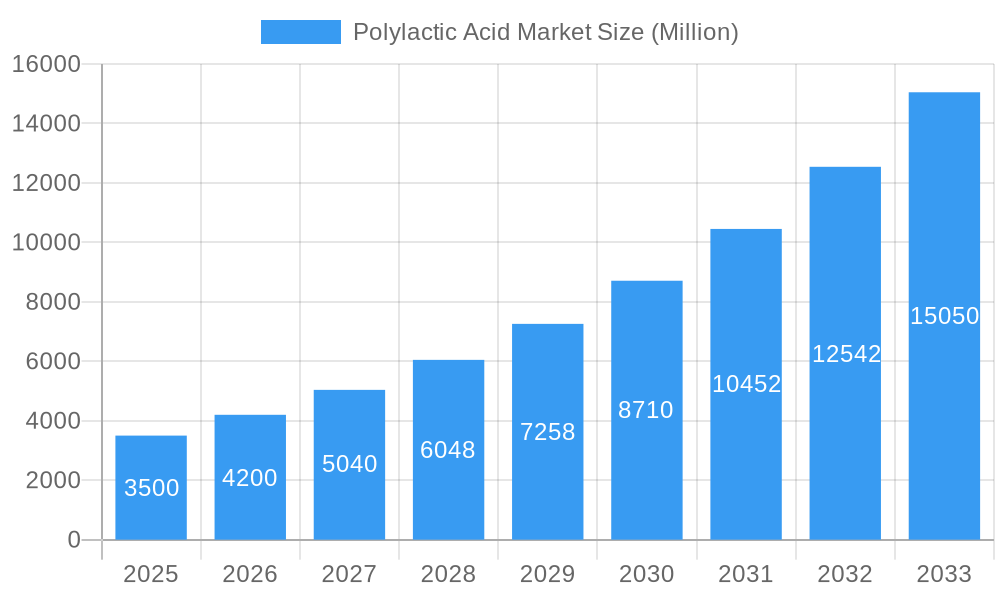
The Polylactic Acid (PLA) market is poised for substantial expansion, driven by the escalating demand for sustainable and biodegradable plastics. With an estimated market size of $2.01 billion in the base year 2025, the market is projected to achieve a remarkable Compound Annual Growth Rate (CAGR) of 17.5%. This robust growth is primarily attributed to the packaging sector's increasing adoption of eco-friendly PLA solutions. Growing environmental awareness and stricter regulations on plastic waste are compelling industries such as medical, electronics, and agriculture to embrace biodegradable PLA. The availability of PLA in various forms, including fiber, films, sheets, and coatings, supports a wide spectrum of applications and further propels market growth. Despite challenges like raw material cost volatility and the need for performance enhancements in specific uses, the market outlook remains exceptionally positive.
Polylactic Acid Market Market Size (In Billion)
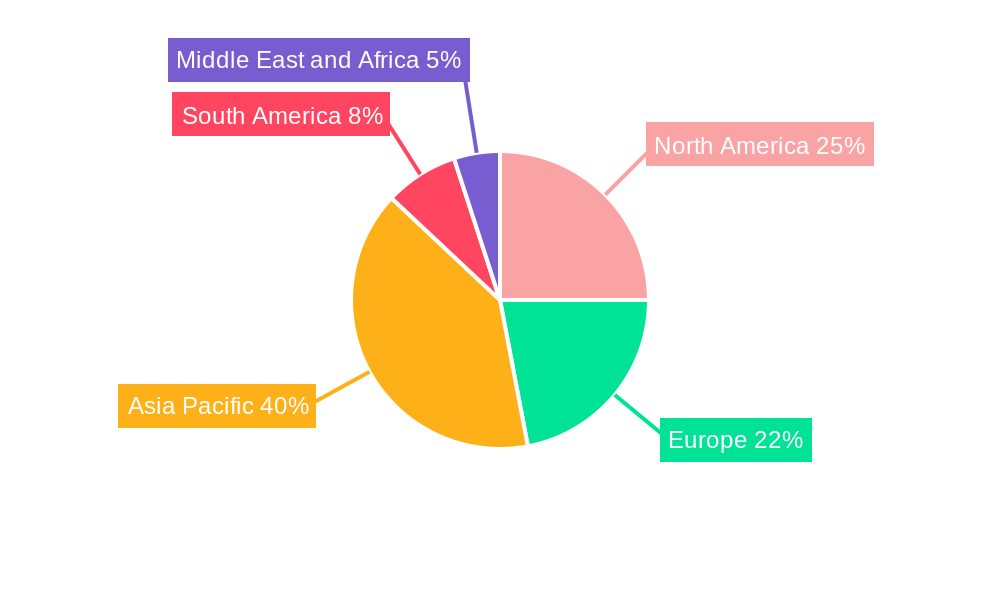
The PLA market's segmentation reveals diverse applications across various raw materials, with corn, cassava, sugarcane, and sugar beet being predominant. Asia Pacific, particularly China and India, leads geographical market share due to rapid industrialization and rising consumer awareness. North America and Europe also represent significant markets, characterized by mature economies and a strong environmental consciousness. Leading players like BEWiSynbra Group, Total Corbion PLA, and NatureWorks LLC are instrumental in shaping the market through innovation and strategic expansion. The forecast period (2025-2033) anticipates sustained growth fueled by technological advancements, supportive bioplastics regulations, and a global consumer shift towards environmentally responsible products. This trend is expected to unlock new applications and deepen market penetration across numerous end-user industries.
Polylactic Acid Market Company Market Share
Polylactic Acid (PLA) Market: A Comprehensive Report (2019-2033)
This comprehensive report provides a detailed analysis of the Polylactic Acid (PLA) market, encompassing its dynamics, growth trends, dominant segments, and key players. With a study period spanning 2019-2033, a base year of 2025, and a forecast period of 2025-2033, this report offers invaluable insights for industry professionals, investors, and researchers seeking to understand and capitalize on the opportunities within this burgeoning bioplastic market. The report covers the parent market of bioplastics and the child market of PLA, offering a complete market overview. The estimated market size in 2025 is xx Million.
Polylactic Acid Market Market Dynamics & Structure
This section analyzes the competitive landscape of the PLA market, examining market concentration, technological innovation, regulatory influences, and the impact of substitute products. The report delves into end-user demographics and M&A activities, providing both quantitative and qualitative insights.
Market Concentration: The PLA market exhibits a moderately concentrated structure, with key players holding significant market share. However, the entry of new players and technological advancements are leading to increased competition. The top 5 players hold approximately xx% of the market share in 2025.
Technological Innovation: Continuous innovation in PLA production processes, including advancements in polymerization techniques and material properties, is a key growth driver. However, challenges remain in scaling up production and reducing costs.
Regulatory Framework: Government regulations promoting sustainable packaging and bio-based materials are creating favorable market conditions. However, variations in regulations across different regions pose complexities for manufacturers.
Competitive Substitutes: PLA faces competition from other bioplastics and traditional petroleum-based plastics. However, the growing demand for sustainable alternatives is driving the adoption of PLA.
End-User Demographics: The packaging industry is the largest end-user segment, followed by the medical and electronics industries. Growing consumer awareness of environmental concerns is boosting demand.
M&A Trends: The PLA market has witnessed several mergers and acquisitions in recent years, reflecting the industry's consolidation and expansion efforts. The total value of M&A deals in the past 5 years is estimated at xx Million.
Polylactic Acid Market Growth Trends & Insights
This section provides a detailed analysis of the PLA market's growth trajectory, focusing on market size evolution, adoption rates, technological disruptions, and shifting consumer behaviors.
The global PLA market is experiencing robust growth, driven by increasing demand from various end-use sectors. The market size is projected to reach xx Million by 2033, exhibiting a CAGR of xx% during the forecast period (2025-2033). This growth is fueled by several factors, including rising consumer preference for eco-friendly products, stringent regulations on conventional plastics, and increasing investments in research and development for advanced PLA applications. Furthermore, technological advancements in production techniques and material properties are enhancing the performance and cost-effectiveness of PLA, further driving its market penetration. Consumer behavior shifts towards sustainable and biodegradable products are significantly contributing to the market's expansion. The increasing adoption of PLA in packaging, particularly in food and beverage applications, is a major growth driver.
Dominant Regions, Countries, or Segments in Polylactic Acid Market
This section identifies the leading regions, countries, and segments within the PLA market.
Raw Material: Corn is currently the dominant raw material for PLA production, owing to its widespread availability and relatively low cost. However, other raw materials like sugarcane and cassava are gaining traction due to their sustainability and regional availability. The market share of corn-based PLA is approximately xx% in 2025.
Form: Films and sheets currently dominate the PLA market in terms of volume, followed by fibers. The demand for PLA films and sheets is primarily driven by the packaging industry. The coatings segment is experiencing significant growth, driven by increasing applications in various industries.
End-user Industry: The packaging sector is the leading end-user industry for PLA, accounting for approximately xx% of the total market volume in 2025. The medical industry, with its demand for biodegradable implants and surgical sutures, also significantly contributes to PLA market growth. The electronics industry is emerging as a potential driver of future growth. North America and Asia-Pacific are currently the leading regions, with Asia-Pacific projected to surpass North America in market size within the forecast period.
Polylactic Acid Market Product Landscape
PLA products are continuously evolving, with innovations focusing on enhanced mechanical properties, improved biodegradability, and wider application versatility. New grades of PLA are being developed to cater to specific end-use requirements, including increased strength, heat resistance, and barrier properties. Technological advancements, such as the incorporation of nanomaterials and other additives, are further enhancing PLA's performance characteristics. This leads to unique selling propositions, like improved transparency, flexibility, and durability, differentiating PLA products from traditional plastics.
Key Drivers, Barriers & Challenges in Polylactic Acid Market
Key Drivers:
- Increasing consumer demand for sustainable and biodegradable packaging.
- Stringent government regulations aimed at reducing plastic pollution.
- Technological advancements enhancing PLA's performance and cost-effectiveness.
- Growing adoption of PLA in diverse industries like medical, electronics, and textiles.
Challenges & Restraints:
- Higher production cost compared to traditional plastics.
- Limited availability of suitable raw materials in certain regions.
- Concerns regarding PLA's biodegradability under specific conditions.
- Competition from other bioplastics and petroleum-based plastics. The high production cost of PLA relative to traditional plastics is a major restraint, limiting its widespread adoption.
Emerging Opportunities in Polylactic Acid Market
- Expanding applications of PLA in emerging markets, particularly in developing economies with growing consumer bases.
- Development of new PLA-based products with improved functionality and performance characteristics.
- Exploration of new raw materials to improve sustainability and reduce dependence on food crops.
- Strategic collaborations and partnerships to enhance the PLA value chain.
Growth Accelerators in the Polylactic Acid Market Industry
The long-term growth of the PLA market will be driven by several factors, including the continued development of more efficient and cost-effective production technologies, the expansion of strategic partnerships to enhance the supply chain and market penetration, and the exploration of innovative applications in high-growth sectors such as 3D printing and flexible electronics. Increased investments in R&D are also key in pushing the market towards wider adoption.
Key Players Shaping the Polylactic Acid Market Market
- BEWiSynbra Group
- Total Corbion PLA
- Sulzer Ltd
- Musashino Chemical Laboratory Ltd
- Futerro
- BASF SE
- Esun
- Zhejiang Hisun Biomaterials Co Ltd
- Shanghai Tong Jie Liang Biomaterials Co Ltd
- NatureWorks LLC
- Cofco
- Polysciences Inc
- Weforyou
- Jiangxi Keyuan Bio-Material Co Ltd
- Danimer Scientific
Notable Milestones in Polylactic Acid Market Sector
September 2023: Danimer Scientific's collaboration with Chevron Phillips Chemical to develop high-volume biodegradable plastic products using Danimer’s Rinnovo polymers signifies a potential market expansion.
May 2023: Sulzer's agreement with Jindan New Biomaterials for PLA production in China, with a capacity of up to 750,000 tonnes per year, highlights the significant investment and growth potential in the Asian market.
In-Depth Polylactic Acid Market Market Outlook
The future of the PLA market appears promising, driven by a confluence of factors, including the increasing global demand for sustainable alternatives to conventional plastics, the continuous advancement of PLA technology, and supportive government policies promoting bio-based materials. Strategic partnerships, innovation in product applications, and expansion into new markets are expected to propel further growth, making PLA a key player in the sustainable materials landscape. The market's potential for expansion into niche applications and emerging technologies presents compelling opportunities for businesses to capture market share and drive further innovation.
Polylactic Acid Market Segmentation
-
1. Raw Material
- 1.1. Corn
- 1.2. Cassava
- 1.3. Sugarcane and Sugar Beet
- 1.4. Other Raw Materials(molasses, potato, wheat)
-
2. Form
- 2.1. Fiber
- 2.2. Films and Sheets
- 2.3. Coatings
- 2.4. Other Forms
-
3. End-user Industry
- 3.1. Packaging
- 3.2. Medical
- 3.3. Electronics
- 3.4. Agriculture
- 3.5. Textiles
- 3.6. Other En
Polylactic Acid Market Segmentation By Geography
-
1. Asia Pacific
- 1.1. China
- 1.2. India
- 1.3. Japan
- 1.4. South Korea
- 1.5. ASEAN Countries
- 1.6. Rest of Asia Pacific
-
2. North America
- 2.1. United States
- 2.2. Canada
- 2.3. Mexico
-
3. Europe
- 3.1. Germany
- 3.2. United Kingdom
- 3.3. France
- 3.4. Italy
- 3.5. CIS region
- 3.6. Rest of Europe
-
4. South America
- 4.1. Brazil
- 4.2. Argentina
- 4.3. Rest of South America
-
5. Middle East and Africa
- 5.1. Saudi Arabia
- 5.2. South Africa
- 5.3. Rest of Middle East and Africa
Polylactic Acid Market Regional Market Share
Geographic Coverage of Polylactic Acid Market
Polylactic Acid Market REPORT HIGHLIGHTS
| Aspects | Details |
|---|---|
| Study Period | 2020-2034 |
| Base Year | 2025 |
| Estimated Year | 2026 |
| Forecast Period | 2026-2034 |
| Historical Period | 2020-2025 |
| Growth Rate | CAGR of 17.5% from 2020-2034 |
| Segmentation |
|
Table of Contents
- 1. Introduction
- 1.1. Research Scope
- 1.2. Market Segmentation
- 1.3. Research Objective
- 1.4. Definitions and Assumptions
- 2. Executive Summary
- 2.1. Market Snapshot
- 3. Market Dynamics
- 3.1. Market Drivers
- 3.2. Market Restrains
- 3.3. Market Trends
- 3.4. Market Opportunities
- 4. Market Factor Analysis
- 4.1. Porters Five Forces
- 4.1.1. Bargaining Power of Suppliers
- 4.1.2. Bargaining Power of Buyers
- 4.1.3. Threat of New Entrants
- 4.1.4. Threat of Substitutes
- 4.1.5. Competitive Rivalry
- 4.2. PESTEL analysis
- 4.3. BCG Analysis
- 4.3.1. Stars (High Growth, High Market Share)
- 4.3.2. Cash Cows (Low Growth, High Market Share)
- 4.3.3. Question Mark (High Growth, Low Market Share)
- 4.3.4. Dogs (Low Growth, Low Market Share)
- 4.4. Ansoff Matrix Analysis
- 4.5. Supply Chain Analysis
- 4.6. Regulatory Landscape
- 4.7. Current Market Potential and Opportunity Assessment (TAM–SAM–SOM Framework)
- 4.8. IMR Analyst Note
- 4.1. Porters Five Forces
- 5. Market Analysis, Insights and Forecast 2021-2033
- 5.1. Market Analysis, Insights and Forecast - by Raw Material
- 5.1.1. Corn
- 5.1.2. Cassava
- 5.1.3. Sugarcane and Sugar Beet
- 5.1.4. Other Raw Materials(molasses, potato, wheat)
- 5.2. Market Analysis, Insights and Forecast - by Form
- 5.2.1. Fiber
- 5.2.2. Films and Sheets
- 5.2.3. Coatings
- 5.2.4. Other Forms
- 5.3. Market Analysis, Insights and Forecast - by End-user Industry
- 5.3.1. Packaging
- 5.3.2. Medical
- 5.3.3. Electronics
- 5.3.4. Agriculture
- 5.3.5. Textiles
- 5.3.6. Other En
- 5.4. Market Analysis, Insights and Forecast - by Region
- 5.4.1. Asia Pacific
- 5.4.2. North America
- 5.4.3. Europe
- 5.4.4. South America
- 5.4.5. Middle East and Africa
- 5.1. Market Analysis, Insights and Forecast - by Raw Material
- 6. Global Polylactic Acid Market Analysis, Insights and Forecast, 2021-2033
- 6.1. Market Analysis, Insights and Forecast - by Raw Material
- 6.1.1. Corn
- 6.1.2. Cassava
- 6.1.3. Sugarcane and Sugar Beet
- 6.1.4. Other Raw Materials(molasses, potato, wheat)
- 6.2. Market Analysis, Insights and Forecast - by Form
- 6.2.1. Fiber
- 6.2.2. Films and Sheets
- 6.2.3. Coatings
- 6.2.4. Other Forms
- 6.3. Market Analysis, Insights and Forecast - by End-user Industry
- 6.3.1. Packaging
- 6.3.2. Medical
- 6.3.3. Electronics
- 6.3.4. Agriculture
- 6.3.5. Textiles
- 6.3.6. Other En
- 6.1. Market Analysis, Insights and Forecast - by Raw Material
- 7. Asia Pacific Polylactic Acid Market Analysis, Insights and Forecast, 2020-2032
- 7.1. Market Analysis, Insights and Forecast - by Raw Material
- 7.1.1. Corn
- 7.1.2. Cassava
- 7.1.3. Sugarcane and Sugar Beet
- 7.1.4. Other Raw Materials(molasses, potato, wheat)
- 7.2. Market Analysis, Insights and Forecast - by Form
- 7.2.1. Fiber
- 7.2.2. Films and Sheets
- 7.2.3. Coatings
- 7.2.4. Other Forms
- 7.3. Market Analysis, Insights and Forecast - by End-user Industry
- 7.3.1. Packaging
- 7.3.2. Medical
- 7.3.3. Electronics
- 7.3.4. Agriculture
- 7.3.5. Textiles
- 7.3.6. Other En
- 7.1. Market Analysis, Insights and Forecast - by Raw Material
- 8. North America Polylactic Acid Market Analysis, Insights and Forecast, 2020-2032
- 8.1. Market Analysis, Insights and Forecast - by Raw Material
- 8.1.1. Corn
- 8.1.2. Cassava
- 8.1.3. Sugarcane and Sugar Beet
- 8.1.4. Other Raw Materials(molasses, potato, wheat)
- 8.2. Market Analysis, Insights and Forecast - by Form
- 8.2.1. Fiber
- 8.2.2. Films and Sheets
- 8.2.3. Coatings
- 8.2.4. Other Forms
- 8.3. Market Analysis, Insights and Forecast - by End-user Industry
- 8.3.1. Packaging
- 8.3.2. Medical
- 8.3.3. Electronics
- 8.3.4. Agriculture
- 8.3.5. Textiles
- 8.3.6. Other En
- 8.1. Market Analysis, Insights and Forecast - by Raw Material
- 9. Europe Polylactic Acid Market Analysis, Insights and Forecast, 2020-2032
- 9.1. Market Analysis, Insights and Forecast - by Raw Material
- 9.1.1. Corn
- 9.1.2. Cassava
- 9.1.3. Sugarcane and Sugar Beet
- 9.1.4. Other Raw Materials(molasses, potato, wheat)
- 9.2. Market Analysis, Insights and Forecast - by Form
- 9.2.1. Fiber
- 9.2.2. Films and Sheets
- 9.2.3. Coatings
- 9.2.4. Other Forms
- 9.3. Market Analysis, Insights and Forecast - by End-user Industry
- 9.3.1. Packaging
- 9.3.2. Medical
- 9.3.3. Electronics
- 9.3.4. Agriculture
- 9.3.5. Textiles
- 9.3.6. Other En
- 9.1. Market Analysis, Insights and Forecast - by Raw Material
- 10. South America Polylactic Acid Market Analysis, Insights and Forecast, 2020-2032
- 10.1. Market Analysis, Insights and Forecast - by Raw Material
- 10.1.1. Corn
- 10.1.2. Cassava
- 10.1.3. Sugarcane and Sugar Beet
- 10.1.4. Other Raw Materials(molasses, potato, wheat)
- 10.2. Market Analysis, Insights and Forecast - by Form
- 10.2.1. Fiber
- 10.2.2. Films and Sheets
- 10.2.3. Coatings
- 10.2.4. Other Forms
- 10.3. Market Analysis, Insights and Forecast - by End-user Industry
- 10.3.1. Packaging
- 10.3.2. Medical
- 10.3.3. Electronics
- 10.3.4. Agriculture
- 10.3.5. Textiles
- 10.3.6. Other En
- 10.1. Market Analysis, Insights and Forecast - by Raw Material
- 11. Middle East and Africa Polylactic Acid Market Analysis, Insights and Forecast, 2020-2032
- 11.1. Market Analysis, Insights and Forecast - by Raw Material
- 11.1.1. Corn
- 11.1.2. Cassava
- 11.1.3. Sugarcane and Sugar Beet
- 11.1.4. Other Raw Materials(molasses, potato, wheat)
- 11.2. Market Analysis, Insights and Forecast - by Form
- 11.2.1. Fiber
- 11.2.2. Films and Sheets
- 11.2.3. Coatings
- 11.2.4. Other Forms
- 11.3. Market Analysis, Insights and Forecast - by End-user Industry
- 11.3.1. Packaging
- 11.3.2. Medical
- 11.3.3. Electronics
- 11.3.4. Agriculture
- 11.3.5. Textiles
- 11.3.6. Other En
- 11.1. Market Analysis, Insights and Forecast - by Raw Material
- 12. Competitive Analysis
- 12.1. Company Profiles
- 12.1.1 BEWiSynbra Group
- 12.1.1.1. Company Overview
- 12.1.1.2. Products
- 12.1.1.3. Company Financials
- 12.1.1.4. SWOT Analysis
- 12.1.2 Total Corbion PLA
- 12.1.2.1. Company Overview
- 12.1.2.2. Products
- 12.1.2.3. Company Financials
- 12.1.2.4. SWOT Analysis
- 12.1.3 Sulzer Ltd
- 12.1.3.1. Company Overview
- 12.1.3.2. Products
- 12.1.3.3. Company Financials
- 12.1.3.4. SWOT Analysis
- 12.1.4 Musashino Chemical Laboratory Ltd
- 12.1.4.1. Company Overview
- 12.1.4.2. Products
- 12.1.4.3. Company Financials
- 12.1.4.4. SWOT Analysis
- 12.1.5 Futerro
- 12.1.5.1. Company Overview
- 12.1.5.2. Products
- 12.1.5.3. Company Financials
- 12.1.5.4. SWOT Analysis
- 12.1.6 BASF SE
- 12.1.6.1. Company Overview
- 12.1.6.2. Products
- 12.1.6.3. Company Financials
- 12.1.6.4. SWOT Analysis
- 12.1.7 Esun
- 12.1.7.1. Company Overview
- 12.1.7.2. Products
- 12.1.7.3. Company Financials
- 12.1.7.4. SWOT Analysis
- 12.1.8 Zhejiang Hisun Biomaterials Co Ltd*List Not Exhaustive
- 12.1.8.1. Company Overview
- 12.1.8.2. Products
- 12.1.8.3. Company Financials
- 12.1.8.4. SWOT Analysis
- 12.1.9 Shanghai Tong Jie Liang Biomaterials Co Ltd
- 12.1.9.1. Company Overview
- 12.1.9.2. Products
- 12.1.9.3. Company Financials
- 12.1.9.4. SWOT Analysis
- 12.1.10 NatureWorks LLC
- 12.1.10.1. Company Overview
- 12.1.10.2. Products
- 12.1.10.3. Company Financials
- 12.1.10.4. SWOT Analysis
- 12.1.11 Cofco
- 12.1.11.1. Company Overview
- 12.1.11.2. Products
- 12.1.11.3. Company Financials
- 12.1.11.4. SWOT Analysis
- 12.1.12 Polysciences Inc
- 12.1.12.1. Company Overview
- 12.1.12.2. Products
- 12.1.12.3. Company Financials
- 12.1.12.4. SWOT Analysis
- 12.1.13 Weforyou
- 12.1.13.1. Company Overview
- 12.1.13.2. Products
- 12.1.13.3. Company Financials
- 12.1.13.4. SWOT Analysis
- 12.1.14 Jiangxi Keyuan Bio-Material Co Ltd
- 12.1.14.1. Company Overview
- 12.1.14.2. Products
- 12.1.14.3. Company Financials
- 12.1.14.4. SWOT Analysis
- 12.1.15 Danimer Scientific
- 12.1.15.1. Company Overview
- 12.1.15.2. Products
- 12.1.15.3. Company Financials
- 12.1.15.4. SWOT Analysis
- 12.1.1 BEWiSynbra Group
- 12.2. Market Entropy
- 12.2.1 Company's Key Areas Served
- 12.2.2 Recent Developments
- 12.3. Company Market Share Analysis 2025
- 12.3.1 Top 5 Companies Market Share Analysis
- 12.3.2 Top 3 Companies Market Share Analysis
- 12.4. List of Potential Customers
- 13. Research Methodology
List of Figures
- Figure 1: Global Polylactic Acid Market Revenue Breakdown (billion, %) by Region 2025 & 2033
- Figure 2: Global Polylactic Acid Market Volume Breakdown (Million, %) by Region 2025 & 2033
- Figure 3: Asia Pacific Polylactic Acid Market Revenue (billion), by Raw Material 2025 & 2033
- Figure 4: Asia Pacific Polylactic Acid Market Volume (Million), by Raw Material 2025 & 2033
- Figure 5: Asia Pacific Polylactic Acid Market Revenue Share (%), by Raw Material 2025 & 2033
- Figure 6: Asia Pacific Polylactic Acid Market Volume Share (%), by Raw Material 2025 & 2033
- Figure 7: Asia Pacific Polylactic Acid Market Revenue (billion), by Form 2025 & 2033
- Figure 8: Asia Pacific Polylactic Acid Market Volume (Million), by Form 2025 & 2033
- Figure 9: Asia Pacific Polylactic Acid Market Revenue Share (%), by Form 2025 & 2033
- Figure 10: Asia Pacific Polylactic Acid Market Volume Share (%), by Form 2025 & 2033
- Figure 11: Asia Pacific Polylactic Acid Market Revenue (billion), by End-user Industry 2025 & 2033
- Figure 12: Asia Pacific Polylactic Acid Market Volume (Million), by End-user Industry 2025 & 2033
- Figure 13: Asia Pacific Polylactic Acid Market Revenue Share (%), by End-user Industry 2025 & 2033
- Figure 14: Asia Pacific Polylactic Acid Market Volume Share (%), by End-user Industry 2025 & 2033
- Figure 15: Asia Pacific Polylactic Acid Market Revenue (billion), by Country 2025 & 2033
- Figure 16: Asia Pacific Polylactic Acid Market Volume (Million), by Country 2025 & 2033
- Figure 17: Asia Pacific Polylactic Acid Market Revenue Share (%), by Country 2025 & 2033
- Figure 18: Asia Pacific Polylactic Acid Market Volume Share (%), by Country 2025 & 2033
- Figure 19: North America Polylactic Acid Market Revenue (billion), by Raw Material 2025 & 2033
- Figure 20: North America Polylactic Acid Market Volume (Million), by Raw Material 2025 & 2033
- Figure 21: North America Polylactic Acid Market Revenue Share (%), by Raw Material 2025 & 2033
- Figure 22: North America Polylactic Acid Market Volume Share (%), by Raw Material 2025 & 2033
- Figure 23: North America Polylactic Acid Market Revenue (billion), by Form 2025 & 2033
- Figure 24: North America Polylactic Acid Market Volume (Million), by Form 2025 & 2033
- Figure 25: North America Polylactic Acid Market Revenue Share (%), by Form 2025 & 2033
- Figure 26: North America Polylactic Acid Market Volume Share (%), by Form 2025 & 2033
- Figure 27: North America Polylactic Acid Market Revenue (billion), by End-user Industry 2025 & 2033
- Figure 28: North America Polylactic Acid Market Volume (Million), by End-user Industry 2025 & 2033
- Figure 29: North America Polylactic Acid Market Revenue Share (%), by End-user Industry 2025 & 2033
- Figure 30: North America Polylactic Acid Market Volume Share (%), by End-user Industry 2025 & 2033
- Figure 31: North America Polylactic Acid Market Revenue (billion), by Country 2025 & 2033
- Figure 32: North America Polylactic Acid Market Volume (Million), by Country 2025 & 2033
- Figure 33: North America Polylactic Acid Market Revenue Share (%), by Country 2025 & 2033
- Figure 34: North America Polylactic Acid Market Volume Share (%), by Country 2025 & 2033
- Figure 35: Europe Polylactic Acid Market Revenue (billion), by Raw Material 2025 & 2033
- Figure 36: Europe Polylactic Acid Market Volume (Million), by Raw Material 2025 & 2033
- Figure 37: Europe Polylactic Acid Market Revenue Share (%), by Raw Material 2025 & 2033
- Figure 38: Europe Polylactic Acid Market Volume Share (%), by Raw Material 2025 & 2033
- Figure 39: Europe Polylactic Acid Market Revenue (billion), by Form 2025 & 2033
- Figure 40: Europe Polylactic Acid Market Volume (Million), by Form 2025 & 2033
- Figure 41: Europe Polylactic Acid Market Revenue Share (%), by Form 2025 & 2033
- Figure 42: Europe Polylactic Acid Market Volume Share (%), by Form 2025 & 2033
- Figure 43: Europe Polylactic Acid Market Revenue (billion), by End-user Industry 2025 & 2033
- Figure 44: Europe Polylactic Acid Market Volume (Million), by End-user Industry 2025 & 2033
- Figure 45: Europe Polylactic Acid Market Revenue Share (%), by End-user Industry 2025 & 2033
- Figure 46: Europe Polylactic Acid Market Volume Share (%), by End-user Industry 2025 & 2033
- Figure 47: Europe Polylactic Acid Market Revenue (billion), by Country 2025 & 2033
- Figure 48: Europe Polylactic Acid Market Volume (Million), by Country 2025 & 2033
- Figure 49: Europe Polylactic Acid Market Revenue Share (%), by Country 2025 & 2033
- Figure 50: Europe Polylactic Acid Market Volume Share (%), by Country 2025 & 2033
- Figure 51: South America Polylactic Acid Market Revenue (billion), by Raw Material 2025 & 2033
- Figure 52: South America Polylactic Acid Market Volume (Million), by Raw Material 2025 & 2033
- Figure 53: South America Polylactic Acid Market Revenue Share (%), by Raw Material 2025 & 2033
- Figure 54: South America Polylactic Acid Market Volume Share (%), by Raw Material 2025 & 2033
- Figure 55: South America Polylactic Acid Market Revenue (billion), by Form 2025 & 2033
- Figure 56: South America Polylactic Acid Market Volume (Million), by Form 2025 & 2033
- Figure 57: South America Polylactic Acid Market Revenue Share (%), by Form 2025 & 2033
- Figure 58: South America Polylactic Acid Market Volume Share (%), by Form 2025 & 2033
- Figure 59: South America Polylactic Acid Market Revenue (billion), by End-user Industry 2025 & 2033
- Figure 60: South America Polylactic Acid Market Volume (Million), by End-user Industry 2025 & 2033
- Figure 61: South America Polylactic Acid Market Revenue Share (%), by End-user Industry 2025 & 2033
- Figure 62: South America Polylactic Acid Market Volume Share (%), by End-user Industry 2025 & 2033
- Figure 63: South America Polylactic Acid Market Revenue (billion), by Country 2025 & 2033
- Figure 64: South America Polylactic Acid Market Volume (Million), by Country 2025 & 2033
- Figure 65: South America Polylactic Acid Market Revenue Share (%), by Country 2025 & 2033
- Figure 66: South America Polylactic Acid Market Volume Share (%), by Country 2025 & 2033
- Figure 67: Middle East and Africa Polylactic Acid Market Revenue (billion), by Raw Material 2025 & 2033
- Figure 68: Middle East and Africa Polylactic Acid Market Volume (Million), by Raw Material 2025 & 2033
- Figure 69: Middle East and Africa Polylactic Acid Market Revenue Share (%), by Raw Material 2025 & 2033
- Figure 70: Middle East and Africa Polylactic Acid Market Volume Share (%), by Raw Material 2025 & 2033
- Figure 71: Middle East and Africa Polylactic Acid Market Revenue (billion), by Form 2025 & 2033
- Figure 72: Middle East and Africa Polylactic Acid Market Volume (Million), by Form 2025 & 2033
- Figure 73: Middle East and Africa Polylactic Acid Market Revenue Share (%), by Form 2025 & 2033
- Figure 74: Middle East and Africa Polylactic Acid Market Volume Share (%), by Form 2025 & 2033
- Figure 75: Middle East and Africa Polylactic Acid Market Revenue (billion), by End-user Industry 2025 & 2033
- Figure 76: Middle East and Africa Polylactic Acid Market Volume (Million), by End-user Industry 2025 & 2033
- Figure 77: Middle East and Africa Polylactic Acid Market Revenue Share (%), by End-user Industry 2025 & 2033
- Figure 78: Middle East and Africa Polylactic Acid Market Volume Share (%), by End-user Industry 2025 & 2033
- Figure 79: Middle East and Africa Polylactic Acid Market Revenue (billion), by Country 2025 & 2033
- Figure 80: Middle East and Africa Polylactic Acid Market Volume (Million), by Country 2025 & 2033
- Figure 81: Middle East and Africa Polylactic Acid Market Revenue Share (%), by Country 2025 & 2033
- Figure 82: Middle East and Africa Polylactic Acid Market Volume Share (%), by Country 2025 & 2033
List of Tables
- Table 1: Global Polylactic Acid Market Revenue billion Forecast, by Raw Material 2020 & 2033
- Table 2: Global Polylactic Acid Market Volume Million Forecast, by Raw Material 2020 & 2033
- Table 3: Global Polylactic Acid Market Revenue billion Forecast, by Form 2020 & 2033
- Table 4: Global Polylactic Acid Market Volume Million Forecast, by Form 2020 & 2033
- Table 5: Global Polylactic Acid Market Revenue billion Forecast, by End-user Industry 2020 & 2033
- Table 6: Global Polylactic Acid Market Volume Million Forecast, by End-user Industry 2020 & 2033
- Table 7: Global Polylactic Acid Market Revenue billion Forecast, by Region 2020 & 2033
- Table 8: Global Polylactic Acid Market Volume Million Forecast, by Region 2020 & 2033
- Table 9: Global Polylactic Acid Market Revenue billion Forecast, by Raw Material 2020 & 2033
- Table 10: Global Polylactic Acid Market Volume Million Forecast, by Raw Material 2020 & 2033
- Table 11: Global Polylactic Acid Market Revenue billion Forecast, by Form 2020 & 2033
- Table 12: Global Polylactic Acid Market Volume Million Forecast, by Form 2020 & 2033
- Table 13: Global Polylactic Acid Market Revenue billion Forecast, by End-user Industry 2020 & 2033
- Table 14: Global Polylactic Acid Market Volume Million Forecast, by End-user Industry 2020 & 2033
- Table 15: Global Polylactic Acid Market Revenue billion Forecast, by Country 2020 & 2033
- Table 16: Global Polylactic Acid Market Volume Million Forecast, by Country 2020 & 2033
- Table 17: China Polylactic Acid Market Revenue (billion) Forecast, by Application 2020 & 2033
- Table 18: China Polylactic Acid Market Volume (Million) Forecast, by Application 2020 & 2033
- Table 19: India Polylactic Acid Market Revenue (billion) Forecast, by Application 2020 & 2033
- Table 20: India Polylactic Acid Market Volume (Million) Forecast, by Application 2020 & 2033
- Table 21: Japan Polylactic Acid Market Revenue (billion) Forecast, by Application 2020 & 2033
- Table 22: Japan Polylactic Acid Market Volume (Million) Forecast, by Application 2020 & 2033
- Table 23: South Korea Polylactic Acid Market Revenue (billion) Forecast, by Application 2020 & 2033
- Table 24: South Korea Polylactic Acid Market Volume (Million) Forecast, by Application 2020 & 2033
- Table 25: ASEAN Countries Polylactic Acid Market Revenue (billion) Forecast, by Application 2020 & 2033
- Table 26: ASEAN Countries Polylactic Acid Market Volume (Million) Forecast, by Application 2020 & 2033
- Table 27: Rest of Asia Pacific Polylactic Acid Market Revenue (billion) Forecast, by Application 2020 & 2033
- Table 28: Rest of Asia Pacific Polylactic Acid Market Volume (Million) Forecast, by Application 2020 & 2033
- Table 29: Global Polylactic Acid Market Revenue billion Forecast, by Raw Material 2020 & 2033
- Table 30: Global Polylactic Acid Market Volume Million Forecast, by Raw Material 2020 & 2033
- Table 31: Global Polylactic Acid Market Revenue billion Forecast, by Form 2020 & 2033
- Table 32: Global Polylactic Acid Market Volume Million Forecast, by Form 2020 & 2033
- Table 33: Global Polylactic Acid Market Revenue billion Forecast, by End-user Industry 2020 & 2033
- Table 34: Global Polylactic Acid Market Volume Million Forecast, by End-user Industry 2020 & 2033
- Table 35: Global Polylactic Acid Market Revenue billion Forecast, by Country 2020 & 2033
- Table 36: Global Polylactic Acid Market Volume Million Forecast, by Country 2020 & 2033
- Table 37: United States Polylactic Acid Market Revenue (billion) Forecast, by Application 2020 & 2033
- Table 38: United States Polylactic Acid Market Volume (Million) Forecast, by Application 2020 & 2033
- Table 39: Canada Polylactic Acid Market Revenue (billion) Forecast, by Application 2020 & 2033
- Table 40: Canada Polylactic Acid Market Volume (Million) Forecast, by Application 2020 & 2033
- Table 41: Mexico Polylactic Acid Market Revenue (billion) Forecast, by Application 2020 & 2033
- Table 42: Mexico Polylactic Acid Market Volume (Million) Forecast, by Application 2020 & 2033
- Table 43: Global Polylactic Acid Market Revenue billion Forecast, by Raw Material 2020 & 2033
- Table 44: Global Polylactic Acid Market Volume Million Forecast, by Raw Material 2020 & 2033
- Table 45: Global Polylactic Acid Market Revenue billion Forecast, by Form 2020 & 2033
- Table 46: Global Polylactic Acid Market Volume Million Forecast, by Form 2020 & 2033
- Table 47: Global Polylactic Acid Market Revenue billion Forecast, by End-user Industry 2020 & 2033
- Table 48: Global Polylactic Acid Market Volume Million Forecast, by End-user Industry 2020 & 2033
- Table 49: Global Polylactic Acid Market Revenue billion Forecast, by Country 2020 & 2033
- Table 50: Global Polylactic Acid Market Volume Million Forecast, by Country 2020 & 2033
- Table 51: Germany Polylactic Acid Market Revenue (billion) Forecast, by Application 2020 & 2033
- Table 52: Germany Polylactic Acid Market Volume (Million) Forecast, by Application 2020 & 2033
- Table 53: United Kingdom Polylactic Acid Market Revenue (billion) Forecast, by Application 2020 & 2033
- Table 54: United Kingdom Polylactic Acid Market Volume (Million) Forecast, by Application 2020 & 2033
- Table 55: France Polylactic Acid Market Revenue (billion) Forecast, by Application 2020 & 2033
- Table 56: France Polylactic Acid Market Volume (Million) Forecast, by Application 2020 & 2033
- Table 57: Italy Polylactic Acid Market Revenue (billion) Forecast, by Application 2020 & 2033
- Table 58: Italy Polylactic Acid Market Volume (Million) Forecast, by Application 2020 & 2033
- Table 59: CIS region Polylactic Acid Market Revenue (billion) Forecast, by Application 2020 & 2033
- Table 60: CIS region Polylactic Acid Market Volume (Million) Forecast, by Application 2020 & 2033
- Table 61: Rest of Europe Polylactic Acid Market Revenue (billion) Forecast, by Application 2020 & 2033
- Table 62: Rest of Europe Polylactic Acid Market Volume (Million) Forecast, by Application 2020 & 2033
- Table 63: Global Polylactic Acid Market Revenue billion Forecast, by Raw Material 2020 & 2033
- Table 64: Global Polylactic Acid Market Volume Million Forecast, by Raw Material 2020 & 2033
- Table 65: Global Polylactic Acid Market Revenue billion Forecast, by Form 2020 & 2033
- Table 66: Global Polylactic Acid Market Volume Million Forecast, by Form 2020 & 2033
- Table 67: Global Polylactic Acid Market Revenue billion Forecast, by End-user Industry 2020 & 2033
- Table 68: Global Polylactic Acid Market Volume Million Forecast, by End-user Industry 2020 & 2033
- Table 69: Global Polylactic Acid Market Revenue billion Forecast, by Country 2020 & 2033
- Table 70: Global Polylactic Acid Market Volume Million Forecast, by Country 2020 & 2033
- Table 71: Brazil Polylactic Acid Market Revenue (billion) Forecast, by Application 2020 & 2033
- Table 72: Brazil Polylactic Acid Market Volume (Million) Forecast, by Application 2020 & 2033
- Table 73: Argentina Polylactic Acid Market Revenue (billion) Forecast, by Application 2020 & 2033
- Table 74: Argentina Polylactic Acid Market Volume (Million) Forecast, by Application 2020 & 2033
- Table 75: Rest of South America Polylactic Acid Market Revenue (billion) Forecast, by Application 2020 & 2033
- Table 76: Rest of South America Polylactic Acid Market Volume (Million) Forecast, by Application 2020 & 2033
- Table 77: Global Polylactic Acid Market Revenue billion Forecast, by Raw Material 2020 & 2033
- Table 78: Global Polylactic Acid Market Volume Million Forecast, by Raw Material 2020 & 2033
- Table 79: Global Polylactic Acid Market Revenue billion Forecast, by Form 2020 & 2033
- Table 80: Global Polylactic Acid Market Volume Million Forecast, by Form 2020 & 2033
- Table 81: Global Polylactic Acid Market Revenue billion Forecast, by End-user Industry 2020 & 2033
- Table 82: Global Polylactic Acid Market Volume Million Forecast, by End-user Industry 2020 & 2033
- Table 83: Global Polylactic Acid Market Revenue billion Forecast, by Country 2020 & 2033
- Table 84: Global Polylactic Acid Market Volume Million Forecast, by Country 2020 & 2033
- Table 85: Saudi Arabia Polylactic Acid Market Revenue (billion) Forecast, by Application 2020 & 2033
- Table 86: Saudi Arabia Polylactic Acid Market Volume (Million) Forecast, by Application 2020 & 2033
- Table 87: South Africa Polylactic Acid Market Revenue (billion) Forecast, by Application 2020 & 2033
- Table 88: South Africa Polylactic Acid Market Volume (Million) Forecast, by Application 2020 & 2033
- Table 89: Rest of Middle East and Africa Polylactic Acid Market Revenue (billion) Forecast, by Application 2020 & 2033
- Table 90: Rest of Middle East and Africa Polylactic Acid Market Volume (Million) Forecast, by Application 2020 & 2033
Frequently Asked Questions
1. What is the projected Compound Annual Growth Rate (CAGR) of the Polylactic Acid Market?
The projected CAGR is approximately 17.5%.
2. Which companies are prominent players in the Polylactic Acid Market?
Key companies in the market include BEWiSynbra Group, Total Corbion PLA, Sulzer Ltd, Musashino Chemical Laboratory Ltd, Futerro, BASF SE, Esun, Zhejiang Hisun Biomaterials Co Ltd*List Not Exhaustive, Shanghai Tong Jie Liang Biomaterials Co Ltd, NatureWorks LLC, Cofco, Polysciences Inc, Weforyou, Jiangxi Keyuan Bio-Material Co Ltd, Danimer Scientific.
3. What are the main segments of the Polylactic Acid Market?
The market segments include Raw Material, Form, End-user Industry.
4. Can you provide details about the market size?
The market size is estimated to be USD 2.01 billion as of 2022.
5. What are some drivers contributing to market growth?
Favorable Government Policies Promoting Bio-plastics; Other Drivers.
6. What are the notable trends driving market growth?
The Packaging Segment is Expected to Dominate the Market.
7. Are there any restraints impacting market growth?
High Price and Other Disadvantages; Other Restraints.
8. Can you provide examples of recent developments in the market?
September 2023: Danimer Scientific has announced its collaboration with Chevron Phillips Chemical to explore the development and commercialization of high-volume biodegradable plastic products using Danimer’s Rinnovo polymers. This partnership aims to boost the company’s profile of PLA-based bioplastic products in the market.
9. What pricing options are available for accessing the report?
Pricing options include single-user, multi-user, and enterprise licenses priced at USD 4750, USD 5250, and USD 8750 respectively.
10. Is the market size provided in terms of value or volume?
The market size is provided in terms of value, measured in billion and volume, measured in Million.
11. Are there any specific market keywords associated with the report?
Yes, the market keyword associated with the report is "Polylactic Acid Market," which aids in identifying and referencing the specific market segment covered.
12. How do I determine which pricing option suits my needs best?
The pricing options vary based on user requirements and access needs. Individual users may opt for single-user licenses, while businesses requiring broader access may choose multi-user or enterprise licenses for cost-effective access to the report.
13. Are there any additional resources or data provided in the Polylactic Acid Market report?
While the report offers comprehensive insights, it's advisable to review the specific contents or supplementary materials provided to ascertain if additional resources or data are available.
14. How can I stay updated on further developments or reports in the Polylactic Acid Market?
To stay informed about further developments, trends, and reports in the Polylactic Acid Market, consider subscribing to industry newsletters, following relevant companies and organizations, or regularly checking reputable industry news sources and publications.
Methodology
Step 1 - Identification of Relevant Samples Size from Population Database


Step 2 - Approaches for Defining Global Market Size (Value, Volume* & Price*)

Note*: In applicable scenarios
Step 3 - Data Sources
Primary Research
- Web Analytics
- Survey Reports
- Research Institute
- Latest Research Reports
- Opinion Leaders
Secondary Research
- Annual Reports
- White Paper
- Latest Press Release
- Industry Association
- Paid Database
- Investor Presentations

Step 4 - Data Triangulation
Involves using different sources of information in order to increase the validity of a study
These sources are likely to be stakeholders in a program - participants, other researchers, program staff, other community members, and so on.
Then we put all data in single framework & apply various statistical tools to find out the dynamic on the market.
During the analysis stage, feedback from the stakeholder groups would be compared to determine areas of agreement as well as areas of divergence