

Key Insights
The global polyurethane composites market is poised for robust expansion, driven by increasing adoption across key sectors like transportation, building and construction, and wind energy. These advanced materials offer exceptional strength-to-weight ratios, promoting fuel efficiency in automotive applications and enabling sustainable, high-performance solutions in construction. The wind energy sector benefits from their durability in critical components like blades. While raw material price volatility and environmental considerations present challenges, ongoing innovations in material science and manufacturing are effectively addressing these concerns. The market is segmented by fiber type (glass, carbon, others) and end-user industry. Glass fiber-reinforced polyurethane composites currently lead due to their cost-effectiveness. Key industry players are actively investing in research and development to enhance product capabilities and expand their market footprint. The Asia-Pacific region, particularly China and India, is anticipated to be a significant growth engine, fueled by rapid industrialization and infrastructure development.
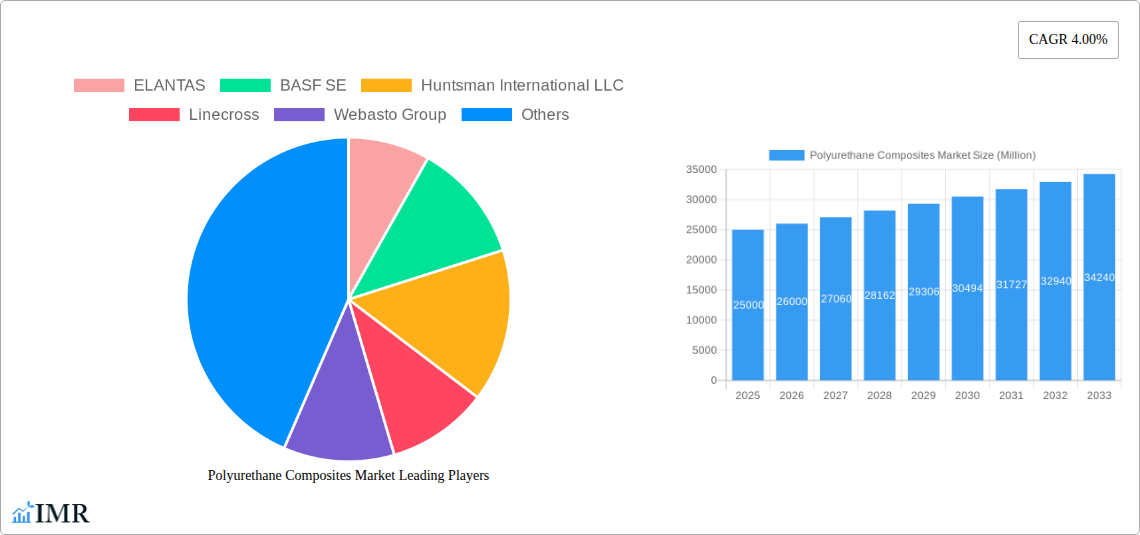
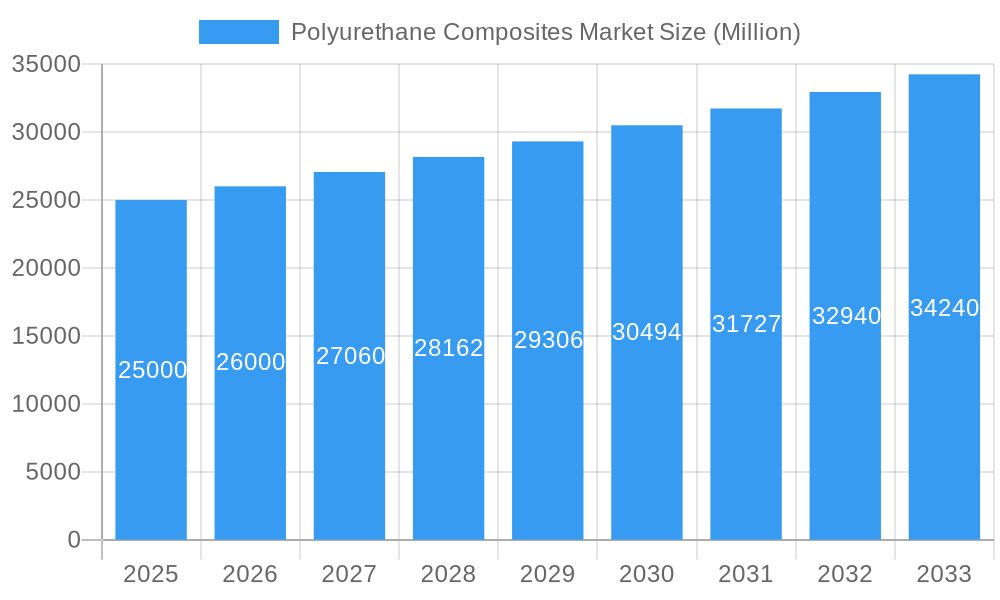
Polyurethane Composites Market Market Size (In Million)
The competitive arena features a blend of global corporations and specialized manufacturers. Future market dynamics will be shaped by the adoption of sustainable practices, supportive government regulations for lightweight materials, and technological advancements enhancing polyurethane composites' performance and versatility. Innovations in bio-based formulations and recycling technologies will also be pivotal for market growth and sustainability. Strategic collaborations between manufacturers and end-users will further influence this dynamic market. Regional segmentation provides crucial insights into varied demand and growth potentials, enabling targeted market penetration strategies.
Polyurethane Composites Market Company Market Share
This comprehensive report analyzes the Polyurethane Composites Market, detailing market dynamics, growth trajectories, regional performance, product landscape, and key stakeholders. The analysis covers the period from 2019 to 2033, with a forecast focusing on 2025-2033 and a base year of 2025. The market is segmented by fiber type (glass, carbon, others) and end-user industry (transportation, building & construction, electrical & electronics, wind energy, others). The projected market size for 2025 is 870.93 million, with an estimated compound annual growth rate (CAGR) of 5.96% from the 2025 to 2033 period.
Polyurethane Composites Market Market Dynamics & Structure
This section analyzes the competitive landscape of the polyurethane composites market, including market concentration, technological innovation, regulatory aspects, and competitive substitutes. We examine the impact of mergers and acquisitions (M&A) activities and end-user demographics on market growth. The market is moderately concentrated, with key players holding significant market share. Technological innovation, driven by the need for lighter, stronger, and more durable materials, is a primary growth driver. Stringent environmental regulations are also shaping product development.
- Market Concentration: Moderately concentrated, with top 5 players holding approximately xx% market share in 2025.
- M&A Activity: An average of xx M&A deals per year were observed during the historical period (2019-2024).
- Technological Innovation: Focus on developing high-performance composites with improved mechanical properties and recyclability.
- Regulatory Landscape: Growing emphasis on sustainability and reduced carbon footprint influencing material choices.
- Competitive Substitutes: Other lightweight materials like carbon fiber reinforced polymers (CFRP) and fiberglass are key competitors.
Polyurethane Composites Market Growth Trends & Insights
This section provides a detailed analysis of the polyurethane composites market's growth trajectory, utilizing data and insights to forecast future market trends. The analysis covers factors influencing market size evolution, adoption rates, technological disruptions, and shifts in consumer behavior. The market experienced a CAGR of xx% during the historical period (2019-2024) and is projected to maintain a CAGR of xx% during the forecast period (2025-2033), reaching an estimated xx Million by 2033. Increasing demand for lightweight materials in the automotive and wind energy sectors is a key driver. Technological advancements leading to improved performance and cost-effectiveness are also fueling market growth.
Dominant Regions, Countries, or Segments in Polyurethane Composites Market
This section identifies the leading regions, countries, and segments driving market growth. The transportation segment is expected to hold the largest market share due to its wide application in automobiles and aerospace, followed by the building and construction sectors. North America and Europe are expected to maintain a significant market share throughout the forecast period, followed by the Asia-Pacific region experiencing substantial growth due to infrastructure development and increasing manufacturing activities.
- Leading Segment: Transportation (xx% market share in 2025)
- Fastest-Growing Segment: Wind Energy (xx% CAGR during 2025-2033)
- Dominant Region: North America (xx% market share in 2025)
- Key Drivers: Government incentives for renewable energy, rising construction activities, and increasing demand for lightweight vehicles.
Polyurethane Composites Market Product Landscape
Polyurethane composites offer a range of products with varying properties catering to specific applications. These composites are known for their versatility, high strength-to-weight ratio, and excellent impact resistance. Recent innovations focus on improving thermal stability, flame retardancy, and chemical resistance to meet stringent industry standards. Unique selling propositions often highlight customized formulations to match specific application needs, resulting in optimized performance characteristics.
Key Drivers, Barriers & Challenges in Polyurethane Composites Market
Key Drivers:
- Increasing demand for lightweight materials in automotive and aerospace industries.
- Growing adoption in renewable energy sectors (wind energy, solar).
- Advancements in polyurethane chemistry leading to improved material properties.
Key Challenges:
- High raw material costs and price volatility.
- Environmental concerns related to polyurethane production and disposal.
- Competition from alternative lightweight materials.
Emerging Opportunities in Polyurethane Composites Market
Emerging opportunities exist in the development of bio-based polyurethane composites, expansion into niche applications in sports equipment and medical devices, and adoption of advanced manufacturing techniques like 3D printing. Untapped markets in developing economies also present significant potential for growth.
Growth Accelerators in the Polyurethane Composites Market Industry
Technological breakthroughs in polyurethane chemistry, strategic partnerships between material suppliers and end-users, and expansion into new applications and geographical markets are key growth accelerators. The development of recyclable and sustainable polyurethane composites is also a significant catalyst for long-term growth.
Key Players Shaping the Polyurethane Composites Market Market
Notable Milestones in Polyurethane Composites Market Sector
- 2020: Covestro AG launches a new line of sustainable polyurethane composites.
- 2022: BASF SE and Huntsman International LLC announce a joint venture to develop high-performance polyurethane composites for the automotive industry.
- 2023: Significant investment in R&D for recyclable polyurethane composites.
In-Depth Polyurethane Composites Market Market Outlook
The polyurethane composites market is poised for sustained growth, driven by technological advancements, increasing demand from key industries, and the development of more sustainable materials. Strategic partnerships and expansion into emerging markets will further propel market expansion, creating significant opportunities for industry players. The market is expected to maintain a robust growth trajectory throughout the forecast period, offering considerable potential for investors and businesses alike.
Polyurethane Composites Market Segmentation
-
1. Fiber Type
- 1.1. Glass
- 1.2. Carbon
- 1.3. Others
-
2. End-user Industry
- 2.1. Transportation
- 2.2. Building & Construction
- 2.3. Electrical & Electronics
- 2.4. Wind Energy
- 2.5. Others
Polyurethane Composites Market Segmentation By Geography
-
1. Asia Pacific
- 1.1. China
- 1.2. India
- 1.3. Japan
- 1.4. South Korea
- 1.5. Rest of Asia Pacific
-
2. North America
- 2.1. United States
- 2.2. Canada
- 2.3. Mexico
-
3. Europe
- 3.1. Germany
- 3.2. United Kingdom
- 3.3. Italy
- 3.4. France
- 3.5. Rest of Europe
-
4. South America
- 4.1. Brazil
- 4.2. Argentina
- 4.3. Rest of South America
-
5. Middle East and Africa
- 5.1. Saudi Arabia
- 5.2. South Africa
- 5.3. Rest of Middle East and Africa
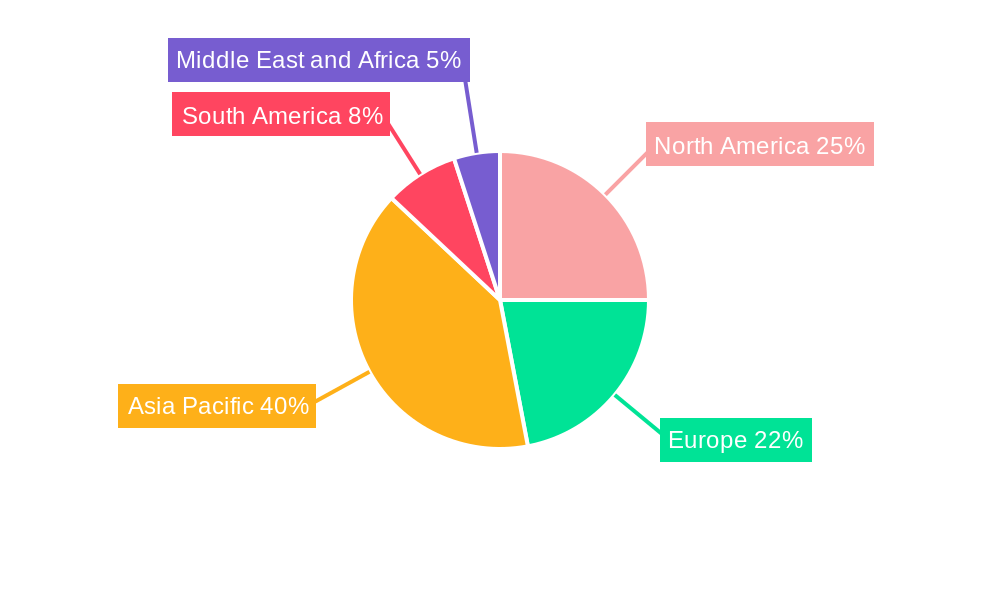
Polyurethane Composites Market Regional Market Share
Geographic Coverage of Polyurethane Composites Market
Polyurethane Composites Market REPORT HIGHLIGHTS
| Aspects | Details |
|---|---|
| Study Period | 2020-2034 |
| Base Year | 2025 |
| Estimated Year | 2026 |
| Forecast Period | 2026-2034 |
| Historical Period | 2020-2025 |
| Growth Rate | CAGR of 5.96% from 2020-2034 |
| Segmentation |
|
Table of Contents
- 1. Introduction
- 1.1. Research Scope
- 1.2. Market Segmentation
- 1.3. Research Objective
- 1.4. Definitions and Assumptions
- 2. Executive Summary
- 2.1. Market Snapshot
- 3. Market Dynamics
- 3.1. Market Drivers
- 3.2. Market Restrains
- 3.3. Market Trends
- 3.4. Market Opportunities
- 4. Market Factor Analysis
- 4.1. Porters Five Forces
- 4.1.1. Bargaining Power of Suppliers
- 4.1.2. Bargaining Power of Buyers
- 4.1.3. Threat of New Entrants
- 4.1.4. Threat of Substitutes
- 4.1.5. Competitive Rivalry
- 4.2. PESTEL analysis
- 4.3. BCG Analysis
- 4.3.1. Stars (High Growth, High Market Share)
- 4.3.2. Cash Cows (Low Growth, High Market Share)
- 4.3.3. Question Mark (High Growth, Low Market Share)
- 4.3.4. Dogs (Low Growth, Low Market Share)
- 4.4. Ansoff Matrix Analysis
- 4.5. Supply Chain Analysis
- 4.6. Regulatory Landscape
- 4.7. Current Market Potential and Opportunity Assessment (TAM–SAM–SOM Framework)
- 4.8. IMR Analyst Note
- 4.1. Porters Five Forces
- 5. Market Analysis, Insights and Forecast 2021-2033
- 5.1. Market Analysis, Insights and Forecast - by Fiber Type
- 5.1.1. Glass
- 5.1.2. Carbon
- 5.1.3. Others
- 5.2. Market Analysis, Insights and Forecast - by End-user Industry
- 5.2.1. Transportation
- 5.2.2. Building & Construction
- 5.2.3. Electrical & Electronics
- 5.2.4. Wind Energy
- 5.2.5. Others
- 5.3. Market Analysis, Insights and Forecast - by Region
- 5.3.1. Asia Pacific
- 5.3.2. North America
- 5.3.3. Europe
- 5.3.4. South America
- 5.3.5. Middle East and Africa
- 5.1. Market Analysis, Insights and Forecast - by Fiber Type
- 6. Global Polyurethane Composites Market Analysis, Insights and Forecast, 2021-2033
- 6.1. Market Analysis, Insights and Forecast - by Fiber Type
- 6.1.1. Glass
- 6.1.2. Carbon
- 6.1.3. Others
- 6.2. Market Analysis, Insights and Forecast - by End-user Industry
- 6.2.1. Transportation
- 6.2.2. Building & Construction
- 6.2.3. Electrical & Electronics
- 6.2.4. Wind Energy
- 6.2.5. Others
- 6.1. Market Analysis, Insights and Forecast - by Fiber Type
- 7. Asia Pacific Polyurethane Composites Market Analysis, Insights and Forecast, 2020-2032
- 7.1. Market Analysis, Insights and Forecast - by Fiber Type
- 7.1.1. Glass
- 7.1.2. Carbon
- 7.1.3. Others
- 7.2. Market Analysis, Insights and Forecast - by End-user Industry
- 7.2.1. Transportation
- 7.2.2. Building & Construction
- 7.2.3. Electrical & Electronics
- 7.2.4. Wind Energy
- 7.2.5. Others
- 7.1. Market Analysis, Insights and Forecast - by Fiber Type
- 8. North America Polyurethane Composites Market Analysis, Insights and Forecast, 2020-2032
- 8.1. Market Analysis, Insights and Forecast - by Fiber Type
- 8.1.1. Glass
- 8.1.2. Carbon
- 8.1.3. Others
- 8.2. Market Analysis, Insights and Forecast - by End-user Industry
- 8.2.1. Transportation
- 8.2.2. Building & Construction
- 8.2.3. Electrical & Electronics
- 8.2.4. Wind Energy
- 8.2.5. Others
- 8.1. Market Analysis, Insights and Forecast - by Fiber Type
- 9. Europe Polyurethane Composites Market Analysis, Insights and Forecast, 2020-2032
- 9.1. Market Analysis, Insights and Forecast - by Fiber Type
- 9.1.1. Glass
- 9.1.2. Carbon
- 9.1.3. Others
- 9.2. Market Analysis, Insights and Forecast - by End-user Industry
- 9.2.1. Transportation
- 9.2.2. Building & Construction
- 9.2.3. Electrical & Electronics
- 9.2.4. Wind Energy
- 9.2.5. Others
- 9.1. Market Analysis, Insights and Forecast - by Fiber Type
- 10. South America Polyurethane Composites Market Analysis, Insights and Forecast, 2020-2032
- 10.1. Market Analysis, Insights and Forecast - by Fiber Type
- 10.1.1. Glass
- 10.1.2. Carbon
- 10.1.3. Others
- 10.2. Market Analysis, Insights and Forecast - by End-user Industry
- 10.2.1. Transportation
- 10.2.2. Building & Construction
- 10.2.3. Electrical & Electronics
- 10.2.4. Wind Energy
- 10.2.5. Others
- 10.1. Market Analysis, Insights and Forecast - by Fiber Type
- 11. Middle East and Africa Polyurethane Composites Market Analysis, Insights and Forecast, 2020-2032
- 11.1. Market Analysis, Insights and Forecast - by Fiber Type
- 11.1.1. Glass
- 11.1.2. Carbon
- 11.1.3. Others
- 11.2. Market Analysis, Insights and Forecast - by End-user Industry
- 11.2.1. Transportation
- 11.2.2. Building & Construction
- 11.2.3. Electrical & Electronics
- 11.2.4. Wind Energy
- 11.2.5. Others
- 11.1. Market Analysis, Insights and Forecast - by Fiber Type
- 12. Competitive Analysis
- 12.1. Company Profiles
- 12.1.1 ELANTAS
- 12.1.1.1. Company Overview
- 12.1.1.2. Products
- 12.1.1.3. Company Financials
- 12.1.1.4. SWOT Analysis
- 12.1.2 BASF SE
- 12.1.2.1. Company Overview
- 12.1.2.2. Products
- 12.1.2.3. Company Financials
- 12.1.2.4. SWOT Analysis
- 12.1.3 Huntsman International LLC
- 12.1.3.1. Company Overview
- 12.1.3.2. Products
- 12.1.3.3. Company Financials
- 12.1.3.4. SWOT Analysis
- 12.1.4 Linecross
- 12.1.4.1. Company Overview
- 12.1.4.2. Products
- 12.1.4.3. Company Financials
- 12.1.4.4. SWOT Analysis
- 12.1.5 Webasto Group
- 12.1.5.1. Company Overview
- 12.1.5.2. Products
- 12.1.5.3. Company Financials
- 12.1.5.4. SWOT Analysis
- 12.1.6 Henkel Corporation
- 12.1.6.1. Company Overview
- 12.1.6.2. Products
- 12.1.6.3. Company Financials
- 12.1.6.4. SWOT Analysis
- 12.1.7 Covestro AG
- 12.1.7.1. Company Overview
- 12.1.7.2. Products
- 12.1.7.3. Company Financials
- 12.1.7.4. SWOT Analysis
- 12.1.1 ELANTAS
- 12.2. Market Entropy
- 12.2.1 Company's Key Areas Served
- 12.2.2 Recent Developments
- 12.3. Company Market Share Analysis 2025
- 12.3.1 Top 5 Companies Market Share Analysis
- 12.3.2 Top 3 Companies Market Share Analysis
- 12.4. List of Potential Customers
- 13. Research Methodology
List of Figures
- Figure 1: Global Polyurethane Composites Market Revenue Breakdown (million, %) by Region 2025 & 2033
- Figure 2: Global Polyurethane Composites Market Volume Breakdown (grams per cubic centimeter , %) by Region 2025 & 2033
- Figure 3: Asia Pacific Polyurethane Composites Market Revenue (million), by Fiber Type 2025 & 2033
- Figure 4: Asia Pacific Polyurethane Composites Market Volume (grams per cubic centimeter ), by Fiber Type 2025 & 2033
- Figure 5: Asia Pacific Polyurethane Composites Market Revenue Share (%), by Fiber Type 2025 & 2033
- Figure 6: Asia Pacific Polyurethane Composites Market Volume Share (%), by Fiber Type 2025 & 2033
- Figure 7: Asia Pacific Polyurethane Composites Market Revenue (million), by End-user Industry 2025 & 2033
- Figure 8: Asia Pacific Polyurethane Composites Market Volume (grams per cubic centimeter ), by End-user Industry 2025 & 2033
- Figure 9: Asia Pacific Polyurethane Composites Market Revenue Share (%), by End-user Industry 2025 & 2033
- Figure 10: Asia Pacific Polyurethane Composites Market Volume Share (%), by End-user Industry 2025 & 2033
- Figure 11: Asia Pacific Polyurethane Composites Market Revenue (million), by Country 2025 & 2033
- Figure 12: Asia Pacific Polyurethane Composites Market Volume (grams per cubic centimeter ), by Country 2025 & 2033
- Figure 13: Asia Pacific Polyurethane Composites Market Revenue Share (%), by Country 2025 & 2033
- Figure 14: Asia Pacific Polyurethane Composites Market Volume Share (%), by Country 2025 & 2033
- Figure 15: North America Polyurethane Composites Market Revenue (million), by Fiber Type 2025 & 2033
- Figure 16: North America Polyurethane Composites Market Volume (grams per cubic centimeter ), by Fiber Type 2025 & 2033
- Figure 17: North America Polyurethane Composites Market Revenue Share (%), by Fiber Type 2025 & 2033
- Figure 18: North America Polyurethane Composites Market Volume Share (%), by Fiber Type 2025 & 2033
- Figure 19: North America Polyurethane Composites Market Revenue (million), by End-user Industry 2025 & 2033
- Figure 20: North America Polyurethane Composites Market Volume (grams per cubic centimeter ), by End-user Industry 2025 & 2033
- Figure 21: North America Polyurethane Composites Market Revenue Share (%), by End-user Industry 2025 & 2033
- Figure 22: North America Polyurethane Composites Market Volume Share (%), by End-user Industry 2025 & 2033
- Figure 23: North America Polyurethane Composites Market Revenue (million), by Country 2025 & 2033
- Figure 24: North America Polyurethane Composites Market Volume (grams per cubic centimeter ), by Country 2025 & 2033
- Figure 25: North America Polyurethane Composites Market Revenue Share (%), by Country 2025 & 2033
- Figure 26: North America Polyurethane Composites Market Volume Share (%), by Country 2025 & 2033
- Figure 27: Europe Polyurethane Composites Market Revenue (million), by Fiber Type 2025 & 2033
- Figure 28: Europe Polyurethane Composites Market Volume (grams per cubic centimeter ), by Fiber Type 2025 & 2033
- Figure 29: Europe Polyurethane Composites Market Revenue Share (%), by Fiber Type 2025 & 2033
- Figure 30: Europe Polyurethane Composites Market Volume Share (%), by Fiber Type 2025 & 2033
- Figure 31: Europe Polyurethane Composites Market Revenue (million), by End-user Industry 2025 & 2033
- Figure 32: Europe Polyurethane Composites Market Volume (grams per cubic centimeter ), by End-user Industry 2025 & 2033
- Figure 33: Europe Polyurethane Composites Market Revenue Share (%), by End-user Industry 2025 & 2033
- Figure 34: Europe Polyurethane Composites Market Volume Share (%), by End-user Industry 2025 & 2033
- Figure 35: Europe Polyurethane Composites Market Revenue (million), by Country 2025 & 2033
- Figure 36: Europe Polyurethane Composites Market Volume (grams per cubic centimeter ), by Country 2025 & 2033
- Figure 37: Europe Polyurethane Composites Market Revenue Share (%), by Country 2025 & 2033
- Figure 38: Europe Polyurethane Composites Market Volume Share (%), by Country 2025 & 2033
- Figure 39: South America Polyurethane Composites Market Revenue (million), by Fiber Type 2025 & 2033
- Figure 40: South America Polyurethane Composites Market Volume (grams per cubic centimeter ), by Fiber Type 2025 & 2033
- Figure 41: South America Polyurethane Composites Market Revenue Share (%), by Fiber Type 2025 & 2033
- Figure 42: South America Polyurethane Composites Market Volume Share (%), by Fiber Type 2025 & 2033
- Figure 43: South America Polyurethane Composites Market Revenue (million), by End-user Industry 2025 & 2033
- Figure 44: South America Polyurethane Composites Market Volume (grams per cubic centimeter ), by End-user Industry 2025 & 2033
- Figure 45: South America Polyurethane Composites Market Revenue Share (%), by End-user Industry 2025 & 2033
- Figure 46: South America Polyurethane Composites Market Volume Share (%), by End-user Industry 2025 & 2033
- Figure 47: South America Polyurethane Composites Market Revenue (million), by Country 2025 & 2033
- Figure 48: South America Polyurethane Composites Market Volume (grams per cubic centimeter ), by Country 2025 & 2033
- Figure 49: South America Polyurethane Composites Market Revenue Share (%), by Country 2025 & 2033
- Figure 50: South America Polyurethane Composites Market Volume Share (%), by Country 2025 & 2033
- Figure 51: Middle East and Africa Polyurethane Composites Market Revenue (million), by Fiber Type 2025 & 2033
- Figure 52: Middle East and Africa Polyurethane Composites Market Volume (grams per cubic centimeter ), by Fiber Type 2025 & 2033
- Figure 53: Middle East and Africa Polyurethane Composites Market Revenue Share (%), by Fiber Type 2025 & 2033
- Figure 54: Middle East and Africa Polyurethane Composites Market Volume Share (%), by Fiber Type 2025 & 2033
- Figure 55: Middle East and Africa Polyurethane Composites Market Revenue (million), by End-user Industry 2025 & 2033
- Figure 56: Middle East and Africa Polyurethane Composites Market Volume (grams per cubic centimeter ), by End-user Industry 2025 & 2033
- Figure 57: Middle East and Africa Polyurethane Composites Market Revenue Share (%), by End-user Industry 2025 & 2033
- Figure 58: Middle East and Africa Polyurethane Composites Market Volume Share (%), by End-user Industry 2025 & 2033
- Figure 59: Middle East and Africa Polyurethane Composites Market Revenue (million), by Country 2025 & 2033
- Figure 60: Middle East and Africa Polyurethane Composites Market Volume (grams per cubic centimeter ), by Country 2025 & 2033
- Figure 61: Middle East and Africa Polyurethane Composites Market Revenue Share (%), by Country 2025 & 2033
- Figure 62: Middle East and Africa Polyurethane Composites Market Volume Share (%), by Country 2025 & 2033
List of Tables
- Table 1: Global Polyurethane Composites Market Revenue million Forecast, by Fiber Type 2020 & 2033
- Table 2: Global Polyurethane Composites Market Volume grams per cubic centimeter Forecast, by Fiber Type 2020 & 2033
- Table 3: Global Polyurethane Composites Market Revenue million Forecast, by End-user Industry 2020 & 2033
- Table 4: Global Polyurethane Composites Market Volume grams per cubic centimeter Forecast, by End-user Industry 2020 & 2033
- Table 5: Global Polyurethane Composites Market Revenue million Forecast, by Region 2020 & 2033
- Table 6: Global Polyurethane Composites Market Volume grams per cubic centimeter Forecast, by Region 2020 & 2033
- Table 7: Global Polyurethane Composites Market Revenue million Forecast, by Fiber Type 2020 & 2033
- Table 8: Global Polyurethane Composites Market Volume grams per cubic centimeter Forecast, by Fiber Type 2020 & 2033
- Table 9: Global Polyurethane Composites Market Revenue million Forecast, by End-user Industry 2020 & 2033
- Table 10: Global Polyurethane Composites Market Volume grams per cubic centimeter Forecast, by End-user Industry 2020 & 2033
- Table 11: Global Polyurethane Composites Market Revenue million Forecast, by Country 2020 & 2033
- Table 12: Global Polyurethane Composites Market Volume grams per cubic centimeter Forecast, by Country 2020 & 2033
- Table 13: China Polyurethane Composites Market Revenue (million) Forecast, by Application 2020 & 2033
- Table 14: China Polyurethane Composites Market Volume (grams per cubic centimeter ) Forecast, by Application 2020 & 2033
- Table 15: India Polyurethane Composites Market Revenue (million) Forecast, by Application 2020 & 2033
- Table 16: India Polyurethane Composites Market Volume (grams per cubic centimeter ) Forecast, by Application 2020 & 2033
- Table 17: Japan Polyurethane Composites Market Revenue (million) Forecast, by Application 2020 & 2033
- Table 18: Japan Polyurethane Composites Market Volume (grams per cubic centimeter ) Forecast, by Application 2020 & 2033
- Table 19: South Korea Polyurethane Composites Market Revenue (million) Forecast, by Application 2020 & 2033
- Table 20: South Korea Polyurethane Composites Market Volume (grams per cubic centimeter ) Forecast, by Application 2020 & 2033
- Table 21: Rest of Asia Pacific Polyurethane Composites Market Revenue (million) Forecast, by Application 2020 & 2033
- Table 22: Rest of Asia Pacific Polyurethane Composites Market Volume (grams per cubic centimeter ) Forecast, by Application 2020 & 2033
- Table 23: Global Polyurethane Composites Market Revenue million Forecast, by Fiber Type 2020 & 2033
- Table 24: Global Polyurethane Composites Market Volume grams per cubic centimeter Forecast, by Fiber Type 2020 & 2033
- Table 25: Global Polyurethane Composites Market Revenue million Forecast, by End-user Industry 2020 & 2033
- Table 26: Global Polyurethane Composites Market Volume grams per cubic centimeter Forecast, by End-user Industry 2020 & 2033
- Table 27: Global Polyurethane Composites Market Revenue million Forecast, by Country 2020 & 2033
- Table 28: Global Polyurethane Composites Market Volume grams per cubic centimeter Forecast, by Country 2020 & 2033
- Table 29: United States Polyurethane Composites Market Revenue (million) Forecast, by Application 2020 & 2033
- Table 30: United States Polyurethane Composites Market Volume (grams per cubic centimeter ) Forecast, by Application 2020 & 2033
- Table 31: Canada Polyurethane Composites Market Revenue (million) Forecast, by Application 2020 & 2033
- Table 32: Canada Polyurethane Composites Market Volume (grams per cubic centimeter ) Forecast, by Application 2020 & 2033
- Table 33: Mexico Polyurethane Composites Market Revenue (million) Forecast, by Application 2020 & 2033
- Table 34: Mexico Polyurethane Composites Market Volume (grams per cubic centimeter ) Forecast, by Application 2020 & 2033
- Table 35: Global Polyurethane Composites Market Revenue million Forecast, by Fiber Type 2020 & 2033
- Table 36: Global Polyurethane Composites Market Volume grams per cubic centimeter Forecast, by Fiber Type 2020 & 2033
- Table 37: Global Polyurethane Composites Market Revenue million Forecast, by End-user Industry 2020 & 2033
- Table 38: Global Polyurethane Composites Market Volume grams per cubic centimeter Forecast, by End-user Industry 2020 & 2033
- Table 39: Global Polyurethane Composites Market Revenue million Forecast, by Country 2020 & 2033
- Table 40: Global Polyurethane Composites Market Volume grams per cubic centimeter Forecast, by Country 2020 & 2033
- Table 41: Germany Polyurethane Composites Market Revenue (million) Forecast, by Application 2020 & 2033
- Table 42: Germany Polyurethane Composites Market Volume (grams per cubic centimeter ) Forecast, by Application 2020 & 2033
- Table 43: United Kingdom Polyurethane Composites Market Revenue (million) Forecast, by Application 2020 & 2033
- Table 44: United Kingdom Polyurethane Composites Market Volume (grams per cubic centimeter ) Forecast, by Application 2020 & 2033
- Table 45: Italy Polyurethane Composites Market Revenue (million) Forecast, by Application 2020 & 2033
- Table 46: Italy Polyurethane Composites Market Volume (grams per cubic centimeter ) Forecast, by Application 2020 & 2033
- Table 47: France Polyurethane Composites Market Revenue (million) Forecast, by Application 2020 & 2033
- Table 48: France Polyurethane Composites Market Volume (grams per cubic centimeter ) Forecast, by Application 2020 & 2033
- Table 49: Rest of Europe Polyurethane Composites Market Revenue (million) Forecast, by Application 2020 & 2033
- Table 50: Rest of Europe Polyurethane Composites Market Volume (grams per cubic centimeter ) Forecast, by Application 2020 & 2033
- Table 51: Global Polyurethane Composites Market Revenue million Forecast, by Fiber Type 2020 & 2033
- Table 52: Global Polyurethane Composites Market Volume grams per cubic centimeter Forecast, by Fiber Type 2020 & 2033
- Table 53: Global Polyurethane Composites Market Revenue million Forecast, by End-user Industry 2020 & 2033
- Table 54: Global Polyurethane Composites Market Volume grams per cubic centimeter Forecast, by End-user Industry 2020 & 2033
- Table 55: Global Polyurethane Composites Market Revenue million Forecast, by Country 2020 & 2033
- Table 56: Global Polyurethane Composites Market Volume grams per cubic centimeter Forecast, by Country 2020 & 2033
- Table 57: Brazil Polyurethane Composites Market Revenue (million) Forecast, by Application 2020 & 2033
- Table 58: Brazil Polyurethane Composites Market Volume (grams per cubic centimeter ) Forecast, by Application 2020 & 2033
- Table 59: Argentina Polyurethane Composites Market Revenue (million) Forecast, by Application 2020 & 2033
- Table 60: Argentina Polyurethane Composites Market Volume (grams per cubic centimeter ) Forecast, by Application 2020 & 2033
- Table 61: Rest of South America Polyurethane Composites Market Revenue (million) Forecast, by Application 2020 & 2033
- Table 62: Rest of South America Polyurethane Composites Market Volume (grams per cubic centimeter ) Forecast, by Application 2020 & 2033
- Table 63: Global Polyurethane Composites Market Revenue million Forecast, by Fiber Type 2020 & 2033
- Table 64: Global Polyurethane Composites Market Volume grams per cubic centimeter Forecast, by Fiber Type 2020 & 2033
- Table 65: Global Polyurethane Composites Market Revenue million Forecast, by End-user Industry 2020 & 2033
- Table 66: Global Polyurethane Composites Market Volume grams per cubic centimeter Forecast, by End-user Industry 2020 & 2033
- Table 67: Global Polyurethane Composites Market Revenue million Forecast, by Country 2020 & 2033
- Table 68: Global Polyurethane Composites Market Volume grams per cubic centimeter Forecast, by Country 2020 & 2033
- Table 69: Saudi Arabia Polyurethane Composites Market Revenue (million) Forecast, by Application 2020 & 2033
- Table 70: Saudi Arabia Polyurethane Composites Market Volume (grams per cubic centimeter ) Forecast, by Application 2020 & 2033
- Table 71: South Africa Polyurethane Composites Market Revenue (million) Forecast, by Application 2020 & 2033
- Table 72: South Africa Polyurethane Composites Market Volume (grams per cubic centimeter ) Forecast, by Application 2020 & 2033
- Table 73: Rest of Middle East and Africa Polyurethane Composites Market Revenue (million) Forecast, by Application 2020 & 2033
- Table 74: Rest of Middle East and Africa Polyurethane Composites Market Volume (grams per cubic centimeter ) Forecast, by Application 2020 & 2033
Frequently Asked Questions
1. What is the projected Compound Annual Growth Rate (CAGR) of the Polyurethane Composites Market?
The projected CAGR is approximately 5.96%.
2. Which companies are prominent players in the Polyurethane Composites Market?
Key companies in the market include ELANTAS, BASF SE, Huntsman International LLC, Linecross, Webasto Group, Henkel Corporation, Covestro AG.
3. What are the main segments of the Polyurethane Composites Market?
The market segments include Fiber Type, End-user Industry.
4. Can you provide details about the market size?
The market size is estimated to be USD 870.93 million as of 2022.
5. What are some drivers contributing to market growth?
; Increasing Demand for the Lightweight Materials From the Transportation Industry; Growing Demand from the Building and Construction Industry.
6. What are the notable trends driving market growth?
Increasing demand from the Transportation Industry.
7. Are there any restraints impacting market growth?
; Slowdown in the Global Automotive Production; High Production Costs.
8. Can you provide examples of recent developments in the market?
N/A
9. What pricing options are available for accessing the report?
Pricing options include single-user, multi-user, and enterprise licenses priced at USD 4750, USD 5250, and USD 8750 respectively.
10. Is the market size provided in terms of value or volume?
The market size is provided in terms of value, measured in million and volume, measured in grams per cubic centimeter .
11. Are there any specific market keywords associated with the report?
Yes, the market keyword associated with the report is "Polyurethane Composites Market," which aids in identifying and referencing the specific market segment covered.
12. How do I determine which pricing option suits my needs best?
The pricing options vary based on user requirements and access needs. Individual users may opt for single-user licenses, while businesses requiring broader access may choose multi-user or enterprise licenses for cost-effective access to the report.
13. Are there any additional resources or data provided in the Polyurethane Composites Market report?
While the report offers comprehensive insights, it's advisable to review the specific contents or supplementary materials provided to ascertain if additional resources or data are available.
14. How can I stay updated on further developments or reports in the Polyurethane Composites Market?
To stay informed about further developments, trends, and reports in the Polyurethane Composites Market, consider subscribing to industry newsletters, following relevant companies and organizations, or regularly checking reputable industry news sources and publications.
Methodology
Step 1 - Identification of Relevant Samples Size from Population Database


Step 2 - Approaches for Defining Global Market Size (Value, Volume* & Price*)

Note*: In applicable scenarios
Step 3 - Data Sources
Primary Research
- Web Analytics
- Survey Reports
- Research Institute
- Latest Research Reports
- Opinion Leaders
Secondary Research
- Annual Reports
- White Paper
- Latest Press Release
- Industry Association
- Paid Database
- Investor Presentations

Step 4 - Data Triangulation
Involves using different sources of information in order to increase the validity of a study
These sources are likely to be stakeholders in a program - participants, other researchers, program staff, other community members, and so on.
Then we put all data in single framework & apply various statistical tools to find out the dynamic on the market.
During the analysis stage, feedback from the stakeholder groups would be compared to determine areas of agreement as well as areas of divergence