

Key Insights
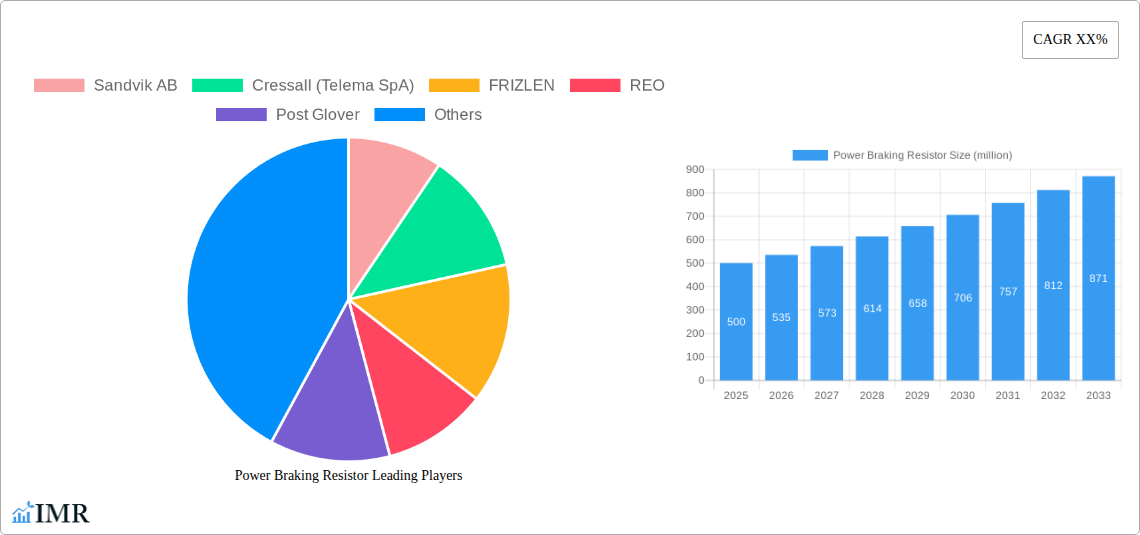
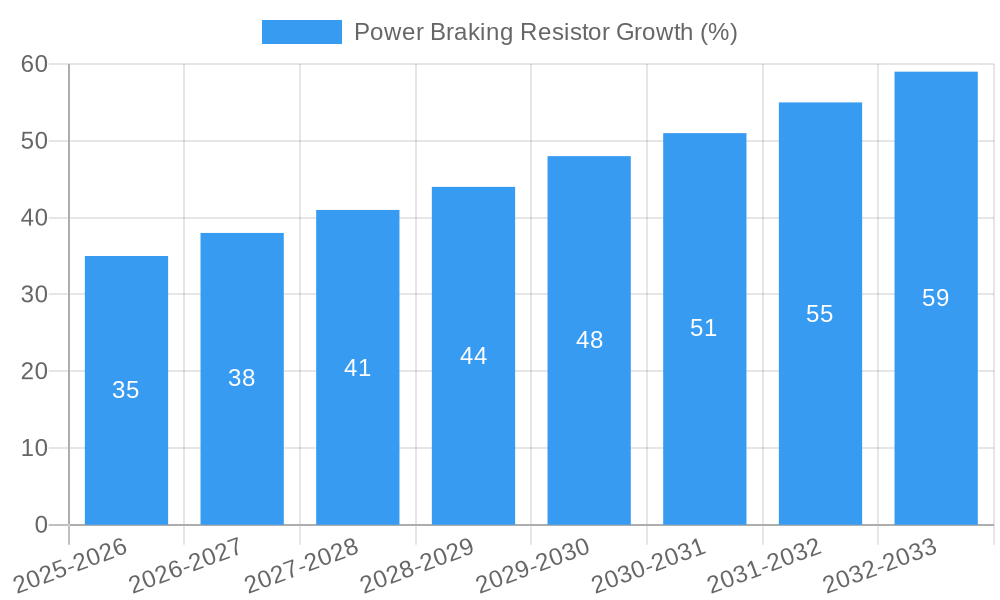
The global power braking resistor market is experiencing robust growth, driven by increasing demand for efficient and reliable braking systems across various industries. The market, estimated at $500 million in 2025, is projected to witness a compound annual growth rate (CAGR) of 7% from 2025 to 2033, reaching a value exceeding $900 million by 2033. This growth is fueled by several key factors. The expanding adoption of electric vehicles (EVs) and hybrid electric vehicles (HEVs) is a significant driver, as power braking resistors are crucial components in regenerative braking systems. Furthermore, stringent emission regulations globally are pushing manufacturers to adopt more efficient braking solutions, boosting demand for advanced power braking resistors. Industrial automation and the increasing use of industrial robots are also contributing to market expansion. Technological advancements, such as the development of higher power density and more efficient resistor designs, are further stimulating market growth. Key players in the market, including Sandvik AB, Eaton, ABB, Siemens, and others, are investing heavily in research and development to improve product performance and cater to the growing demand.
However, certain restraints hinder the market's growth trajectory. The high initial investment cost associated with installing power braking resistor systems can be a barrier for some customers, particularly in smaller industries. Furthermore, the potential for heat generation and the need for effective cooling solutions present challenges that require ongoing technological innovation. Despite these challenges, the long-term prospects for the power braking resistor market remain positive, driven by the aforementioned growth factors and a continuous focus on improving energy efficiency and safety in various applications. Market segmentation is crucial, with different resistor types (e.g., wire-wound, foil, etc.) finding applications in specific sectors, leading to varying growth rates within these segments. Regional variations are also expected, with regions like North America and Europe leading the market, followed by Asia-Pacific experiencing significant growth in the coming years.
Power Braking Resistor Market Report: 2019-2033
This comprehensive report provides an in-depth analysis of the global power braking resistor market, encompassing market dynamics, growth trends, regional landscapes, product innovations, and key players. The study period covers 2019-2033, with 2025 as the base and estimated year. The forecast period spans 2025-2033, and the historical period covers 2019-2024. This report is crucial for industry professionals, investors, and strategists seeking to understand and capitalize on the opportunities within this dynamic sector. The market is segmented by application (parent market: Industrial Automation; child market: Railway, Electric Vehicles) and geographical region.
Power Braking Resistor Market Dynamics & Structure
This section analyzes the competitive landscape, technological advancements, regulatory influences, and market trends impacting the power braking resistor market. The global market size in 2024 is estimated at $xx million.
Market Concentration & Competition: The market exhibits a moderately concentrated structure, with key players holding significant market share. Industry consolidation through mergers and acquisitions (M&A) is expected to continue, driving further concentration.
- Market Share (2024): Top 5 players hold approximately 60% market share.
- M&A Activity (2019-2024): xx deals recorded, with an average deal value of $xx million.
- Competitive Landscape: Intense competition driven by technological innovation and pricing pressure.
Technological Innovation & Drivers: Continuous advancements in materials science and thermal management are driving the development of higher-power, more efficient, and compact power braking resistors. The adoption of advanced cooling technologies like liquid cooling is also gaining traction.
- Key Innovations: Improved heat dissipation materials, advanced manufacturing techniques, intelligent control systems.
- Innovation Barriers: High R&D costs, stringent regulatory approvals, and the need for specialized expertise.
Regulatory Frameworks & Standards: Stringent safety and environmental regulations, particularly regarding emissions and energy efficiency, are shaping market development.
- Key Regulations: IEC standards, RoHS compliance, and regional environmental directives.
- Regulatory Impact: Drives the adoption of eco-friendly materials and designs.
Product Substitutes & End-User Demographics: The main substitutes include dynamic braking systems and regenerative braking systems. The primary end-users are within the industrial automation, railway, and electric vehicle sectors. The market is influenced by factors like industrial automation growth, railway infrastructure expansion, and the increasing adoption of electric vehicles.
Power Braking Resistor Growth Trends & Insights
The global power braking resistor market is projected to experience robust growth during the forecast period (2025-2033). Driven by increasing demand from the industrial automation, railway, and electric vehicle sectors, the market is poised for significant expansion.
The market size is expected to reach $xx million in 2025 and further grow to $xx million by 2033, exhibiting a CAGR of xx%. This growth is primarily attributed to the rising adoption of electric vehicles, infrastructure development, and advancements in industrial automation. Technological disruptions, such as the development of more efficient and compact braking resistors, are also expected to influence market growth. Changes in consumer behavior, driven by environmental awareness and a preference for sustainable solutions, are further bolstering demand.
Dominant Regions, Countries, or Segments in Power Braking Resistor
The [Region/Country - e.g., North America] region currently dominates the global power braking resistor market, accounting for a significant market share. This dominance is primarily driven by factors such as robust industrial growth, strong government support for infrastructure development, and a high concentration of key players in the region.
- Key Drivers: Strong industrial base, robust infrastructure development, supportive government policies, high adoption rates of advanced technologies.
- Market Share (2024): [Region/Country] holds approximately xx% of the global market share.
- Growth Potential: Significant growth potential in emerging economies like [Country/Region - e.g., Asia-Pacific] due to rapid industrialization and increasing investments in infrastructure projects.
Power Braking Resistor Product Landscape
Power braking resistors are available in various designs and configurations, including air-cooled, liquid-cooled, and high-power units, to meet diverse application requirements. Recent innovations focus on enhancing efficiency, reducing size, and improving heat dissipation. Key features include advanced materials, optimized designs, and integrated control systems that improve performance and reliability. Unique selling propositions often highlight superior thermal performance, extended lifespan, and compact design.
Key Drivers, Barriers & Challenges in Power Braking Resistor
Key Drivers: The increasing demand for energy-efficient solutions in industrial automation and electric vehicles is a key driver. Government regulations promoting sustainable technologies and investments in infrastructure projects also significantly contribute to market growth.
Challenges & Restraints: Supply chain disruptions, fluctuating raw material costs, and the increasing complexity of regulatory approvals pose significant challenges. The high initial investment costs associated with adopting advanced braking resistor technologies can also impede market expansion. Intense competition among established players further adds pressure on profit margins. Furthermore, the development of alternative braking technologies could potentially limit the growth of power braking resistors in the long term.
Emerging Opportunities in Power Braking Resistor
Emerging opportunities lie in untapped markets, such as the development of specialized braking resistors for niche applications in renewable energy systems and the increasing adoption of advanced cooling technologies for improved efficiency. Furthermore, the growth of electric vehicles and the expansion of high-speed rail networks presents significant market expansion possibilities.
Growth Accelerators in the Power Braking Resistor Industry
Technological advancements, such as the development of more efficient and compact braking resistors, along with strategic partnerships among key players, are anticipated to drive long-term growth. Market expansion strategies, including penetration into new geographical regions and targeting emerging applications, will further contribute to market expansion.
Key Players Shaping the Power Braking Resistor Market
- Sandvik AB
- Cressall (Telema SpA)
- FRIZLEN
- REO
- Post Glover
- Eaton
- Powerohm (Hubbell)
- Toshiba
- ABB
- Siemens
- Rockwell
- Schneider Electric
- Yaskawa
- Danfoss
- Mitsubishi Electric
- Nidec
- Vishay
- Delta
- Hitachi
- Omron
- Transfab TMS
- Hilkar
Notable Milestones in Power Braking Resistor Sector
- 2020-Q4: Introduction of a new high-efficiency liquid-cooled power braking resistor by [Company Name].
- 2022-Q2: Merger between [Company Name] and [Company Name], resulting in increased market share.
- 2023-Q3: Launch of a new regulatory standard impacting the design and certification of power braking resistors. (Further details would be provided within the report itself)
In-Depth Power Braking Resistor Market Outlook
The power braking resistor market is poised for continued growth, driven by technological innovations, increasing demand from key end-use sectors, and supportive government policies. Strategic partnerships, investments in R&D, and the development of sustainable technologies will further accelerate market expansion. Untapped market segments and new application areas offer significant opportunities for industry players. The forecast period indicates sustained growth with significant potential for market expansion.
Power Braking Resistor Segmentation
-
1. Application
- 1.1. Locomotive
- 1.2. High-Bay Storage
- 1.3. Machine Tools
- 1.4. Lift Construction
- 1.5. Others
-
2. Types
- 2.1. Less than 100 kW
- 2.2. 100kW-500kW
- 2.3. 500kW-800kW
- 2.4. 800kW-1000kW
- 2.5. Above than 1000kW
Power Braking Resistor Segmentation By Geography
-
1. North America
- 1.1. United States
- 1.2. Canada
- 1.3. Mexico
-
2. South America
- 2.1. Brazil
- 2.2. Argentina
- 2.3. Rest of South America
-
3. Europe
- 3.1. United Kingdom
- 3.2. Germany
- 3.3. France
- 3.4. Italy
- 3.5. Spain
- 3.6. Russia
- 3.7. Benelux
- 3.8. Nordics
- 3.9. Rest of Europe
-
4. Middle East & Africa
- 4.1. Turkey
- 4.2. Israel
- 4.3. GCC
- 4.4. North Africa
- 4.5. South Africa
- 4.6. Rest of Middle East & Africa
-
5. Asia Pacific
- 5.1. China
- 5.2. India
- 5.3. Japan
- 5.4. South Korea
- 5.5. ASEAN
- 5.6. Oceania
- 5.7. Rest of Asia Pacific

Power Braking Resistor REPORT HIGHLIGHTS
| Aspects | Details |
|---|---|
| Study Period | 2019-2033 |
| Base Year | 2024 |
| Estimated Year | 2025 |
| Forecast Period | 2025-2033 |
| Historical Period | 2019-2024 |
| Growth Rate | CAGR of XX% from 2019-2033 |
| Segmentation |
|
Table of Contents
- 1. Introduction
- 1.1. Research Scope
- 1.2. Market Segmentation
- 1.3. Research Methodology
- 1.4. Definitions and Assumptions
- 2. Executive Summary
- 2.1. Introduction
- 3. Market Dynamics
- 3.1. Introduction
- 3.2. Market Drivers
- 3.3. Market Restrains
- 3.4. Market Trends
- 4. Market Factor Analysis
- 4.1. Porters Five Forces
- 4.2. Supply/Value Chain
- 4.3. PESTEL analysis
- 4.4. Market Entropy
- 4.5. Patent/Trademark Analysis
- 5. Global Power Braking Resistor Analysis, Insights and Forecast, 2019-2031
- 5.1. Market Analysis, Insights and Forecast - by Application
- 5.1.1. Locomotive
- 5.1.2. High-Bay Storage
- 5.1.3. Machine Tools
- 5.1.4. Lift Construction
- 5.1.5. Others
- 5.2. Market Analysis, Insights and Forecast - by Types
- 5.2.1. Less than 100 kW
- 5.2.2. 100kW-500kW
- 5.2.3. 500kW-800kW
- 5.2.4. 800kW-1000kW
- 5.2.5. Above than 1000kW
- 5.3. Market Analysis, Insights and Forecast - by Region
- 5.3.1. North America
- 5.3.2. South America
- 5.3.3. Europe
- 5.3.4. Middle East & Africa
- 5.3.5. Asia Pacific
- 5.1. Market Analysis, Insights and Forecast - by Application
- 6. North America Power Braking Resistor Analysis, Insights and Forecast, 2019-2031
- 6.1. Market Analysis, Insights and Forecast - by Application
- 6.1.1. Locomotive
- 6.1.2. High-Bay Storage
- 6.1.3. Machine Tools
- 6.1.4. Lift Construction
- 6.1.5. Others
- 6.2. Market Analysis, Insights and Forecast - by Types
- 6.2.1. Less than 100 kW
- 6.2.2. 100kW-500kW
- 6.2.3. 500kW-800kW
- 6.2.4. 800kW-1000kW
- 6.2.5. Above than 1000kW
- 6.1. Market Analysis, Insights and Forecast - by Application
- 7. South America Power Braking Resistor Analysis, Insights and Forecast, 2019-2031
- 7.1. Market Analysis, Insights and Forecast - by Application
- 7.1.1. Locomotive
- 7.1.2. High-Bay Storage
- 7.1.3. Machine Tools
- 7.1.4. Lift Construction
- 7.1.5. Others
- 7.2. Market Analysis, Insights and Forecast - by Types
- 7.2.1. Less than 100 kW
- 7.2.2. 100kW-500kW
- 7.2.3. 500kW-800kW
- 7.2.4. 800kW-1000kW
- 7.2.5. Above than 1000kW
- 7.1. Market Analysis, Insights and Forecast - by Application
- 8. Europe Power Braking Resistor Analysis, Insights and Forecast, 2019-2031
- 8.1. Market Analysis, Insights and Forecast - by Application
- 8.1.1. Locomotive
- 8.1.2. High-Bay Storage
- 8.1.3. Machine Tools
- 8.1.4. Lift Construction
- 8.1.5. Others
- 8.2. Market Analysis, Insights and Forecast - by Types
- 8.2.1. Less than 100 kW
- 8.2.2. 100kW-500kW
- 8.2.3. 500kW-800kW
- 8.2.4. 800kW-1000kW
- 8.2.5. Above than 1000kW
- 8.1. Market Analysis, Insights and Forecast - by Application
- 9. Middle East & Africa Power Braking Resistor Analysis, Insights and Forecast, 2019-2031
- 9.1. Market Analysis, Insights and Forecast - by Application
- 9.1.1. Locomotive
- 9.1.2. High-Bay Storage
- 9.1.3. Machine Tools
- 9.1.4. Lift Construction
- 9.1.5. Others
- 9.2. Market Analysis, Insights and Forecast - by Types
- 9.2.1. Less than 100 kW
- 9.2.2. 100kW-500kW
- 9.2.3. 500kW-800kW
- 9.2.4. 800kW-1000kW
- 9.2.5. Above than 1000kW
- 9.1. Market Analysis, Insights and Forecast - by Application
- 10. Asia Pacific Power Braking Resistor Analysis, Insights and Forecast, 2019-2031
- 10.1. Market Analysis, Insights and Forecast - by Application
- 10.1.1. Locomotive
- 10.1.2. High-Bay Storage
- 10.1.3. Machine Tools
- 10.1.4. Lift Construction
- 10.1.5. Others
- 10.2. Market Analysis, Insights and Forecast - by Types
- 10.2.1. Less than 100 kW
- 10.2.2. 100kW-500kW
- 10.2.3. 500kW-800kW
- 10.2.4. 800kW-1000kW
- 10.2.5. Above than 1000kW
- 10.1. Market Analysis, Insights and Forecast - by Application
- 11. Competitive Analysis
- 11.1. Global Market Share Analysis 2024
- 11.2. Company Profiles
- 11.2.1 Sandvik AB
- 11.2.1.1. Overview
- 11.2.1.2. Products
- 11.2.1.3. SWOT Analysis
- 11.2.1.4. Recent Developments
- 11.2.1.5. Financials (Based on Availability)
- 11.2.2 Cressall (Telema SpA)
- 11.2.2.1. Overview
- 11.2.2.2. Products
- 11.2.2.3. SWOT Analysis
- 11.2.2.4. Recent Developments
- 11.2.2.5. Financials (Based on Availability)
- 11.2.3 FRIZLEN
- 11.2.3.1. Overview
- 11.2.3.2. Products
- 11.2.3.3. SWOT Analysis
- 11.2.3.4. Recent Developments
- 11.2.3.5. Financials (Based on Availability)
- 11.2.4 REO
- 11.2.4.1. Overview
- 11.2.4.2. Products
- 11.2.4.3. SWOT Analysis
- 11.2.4.4. Recent Developments
- 11.2.4.5. Financials (Based on Availability)
- 11.2.5 Post Glover
- 11.2.5.1. Overview
- 11.2.5.2. Products
- 11.2.5.3. SWOT Analysis
- 11.2.5.4. Recent Developments
- 11.2.5.5. Financials (Based on Availability)
- 11.2.6 Eaton
- 11.2.6.1. Overview
- 11.2.6.2. Products
- 11.2.6.3. SWOT Analysis
- 11.2.6.4. Recent Developments
- 11.2.6.5. Financials (Based on Availability)
- 11.2.7 Powerohm (Hubbell)
- 11.2.7.1. Overview
- 11.2.7.2. Products
- 11.2.7.3. SWOT Analysis
- 11.2.7.4. Recent Developments
- 11.2.7.5. Financials (Based on Availability)
- 11.2.8 Toshiba
- 11.2.8.1. Overview
- 11.2.8.2. Products
- 11.2.8.3. SWOT Analysis
- 11.2.8.4. Recent Developments
- 11.2.8.5. Financials (Based on Availability)
- 11.2.9 ABB
- 11.2.9.1. Overview
- 11.2.9.2. Products
- 11.2.9.3. SWOT Analysis
- 11.2.9.4. Recent Developments
- 11.2.9.5. Financials (Based on Availability)
- 11.2.10 Siemens
- 11.2.10.1. Overview
- 11.2.10.2. Products
- 11.2.10.3. SWOT Analysis
- 11.2.10.4. Recent Developments
- 11.2.10.5. Financials (Based on Availability)
- 11.2.11 Rockwell
- 11.2.11.1. Overview
- 11.2.11.2. Products
- 11.2.11.3. SWOT Analysis
- 11.2.11.4. Recent Developments
- 11.2.11.5. Financials (Based on Availability)
- 11.2.12 Schneider Electric
- 11.2.12.1. Overview
- 11.2.12.2. Products
- 11.2.12.3. SWOT Analysis
- 11.2.12.4. Recent Developments
- 11.2.12.5. Financials (Based on Availability)
- 11.2.13 Yaskawa
- 11.2.13.1. Overview
- 11.2.13.2. Products
- 11.2.13.3. SWOT Analysis
- 11.2.13.4. Recent Developments
- 11.2.13.5. Financials (Based on Availability)
- 11.2.14 Danfoss
- 11.2.14.1. Overview
- 11.2.14.2. Products
- 11.2.14.3. SWOT Analysis
- 11.2.14.4. Recent Developments
- 11.2.14.5. Financials (Based on Availability)
- 11.2.15 Mitsubishi Electric
- 11.2.15.1. Overview
- 11.2.15.2. Products
- 11.2.15.3. SWOT Analysis
- 11.2.15.4. Recent Developments
- 11.2.15.5. Financials (Based on Availability)
- 11.2.16 Nidec
- 11.2.16.1. Overview
- 11.2.16.2. Products
- 11.2.16.3. SWOT Analysis
- 11.2.16.4. Recent Developments
- 11.2.16.5. Financials (Based on Availability)
- 11.2.17 Vishay
- 11.2.17.1. Overview
- 11.2.17.2. Products
- 11.2.17.3. SWOT Analysis
- 11.2.17.4. Recent Developments
- 11.2.17.5. Financials (Based on Availability)
- 11.2.18 Delta
- 11.2.18.1. Overview
- 11.2.18.2. Products
- 11.2.18.3. SWOT Analysis
- 11.2.18.4. Recent Developments
- 11.2.18.5. Financials (Based on Availability)
- 11.2.19 Hitachi
- 11.2.19.1. Overview
- 11.2.19.2. Products
- 11.2.19.3. SWOT Analysis
- 11.2.19.4. Recent Developments
- 11.2.19.5. Financials (Based on Availability)
- 11.2.20 Omron
- 11.2.20.1. Overview
- 11.2.20.2. Products
- 11.2.20.3. SWOT Analysis
- 11.2.20.4. Recent Developments
- 11.2.20.5. Financials (Based on Availability)
- 11.2.21 Transfab TMS
- 11.2.21.1. Overview
- 11.2.21.2. Products
- 11.2.21.3. SWOT Analysis
- 11.2.21.4. Recent Developments
- 11.2.21.5. Financials (Based on Availability)
- 11.2.22 Hilkar
- 11.2.22.1. Overview
- 11.2.22.2. Products
- 11.2.22.3. SWOT Analysis
- 11.2.22.4. Recent Developments
- 11.2.22.5. Financials (Based on Availability)
- 11.2.1 Sandvik AB
List of Figures
- Figure 1: Global Power Braking Resistor Revenue Breakdown (million, %) by Region 2024 & 2032
- Figure 2: Global Power Braking Resistor Volume Breakdown (K, %) by Region 2024 & 2032
- Figure 3: North America Power Braking Resistor Revenue (million), by Application 2024 & 2032
- Figure 4: North America Power Braking Resistor Volume (K), by Application 2024 & 2032
- Figure 5: North America Power Braking Resistor Revenue Share (%), by Application 2024 & 2032
- Figure 6: North America Power Braking Resistor Volume Share (%), by Application 2024 & 2032
- Figure 7: North America Power Braking Resistor Revenue (million), by Types 2024 & 2032
- Figure 8: North America Power Braking Resistor Volume (K), by Types 2024 & 2032
- Figure 9: North America Power Braking Resistor Revenue Share (%), by Types 2024 & 2032
- Figure 10: North America Power Braking Resistor Volume Share (%), by Types 2024 & 2032
- Figure 11: North America Power Braking Resistor Revenue (million), by Country 2024 & 2032
- Figure 12: North America Power Braking Resistor Volume (K), by Country 2024 & 2032
- Figure 13: North America Power Braking Resistor Revenue Share (%), by Country 2024 & 2032
- Figure 14: North America Power Braking Resistor Volume Share (%), by Country 2024 & 2032
- Figure 15: South America Power Braking Resistor Revenue (million), by Application 2024 & 2032
- Figure 16: South America Power Braking Resistor Volume (K), by Application 2024 & 2032
- Figure 17: South America Power Braking Resistor Revenue Share (%), by Application 2024 & 2032
- Figure 18: South America Power Braking Resistor Volume Share (%), by Application 2024 & 2032
- Figure 19: South America Power Braking Resistor Revenue (million), by Types 2024 & 2032
- Figure 20: South America Power Braking Resistor Volume (K), by Types 2024 & 2032
- Figure 21: South America Power Braking Resistor Revenue Share (%), by Types 2024 & 2032
- Figure 22: South America Power Braking Resistor Volume Share (%), by Types 2024 & 2032
- Figure 23: South America Power Braking Resistor Revenue (million), by Country 2024 & 2032
- Figure 24: South America Power Braking Resistor Volume (K), by Country 2024 & 2032
- Figure 25: South America Power Braking Resistor Revenue Share (%), by Country 2024 & 2032
- Figure 26: South America Power Braking Resistor Volume Share (%), by Country 2024 & 2032
- Figure 27: Europe Power Braking Resistor Revenue (million), by Application 2024 & 2032
- Figure 28: Europe Power Braking Resistor Volume (K), by Application 2024 & 2032
- Figure 29: Europe Power Braking Resistor Revenue Share (%), by Application 2024 & 2032
- Figure 30: Europe Power Braking Resistor Volume Share (%), by Application 2024 & 2032
- Figure 31: Europe Power Braking Resistor Revenue (million), by Types 2024 & 2032
- Figure 32: Europe Power Braking Resistor Volume (K), by Types 2024 & 2032
- Figure 33: Europe Power Braking Resistor Revenue Share (%), by Types 2024 & 2032
- Figure 34: Europe Power Braking Resistor Volume Share (%), by Types 2024 & 2032
- Figure 35: Europe Power Braking Resistor Revenue (million), by Country 2024 & 2032
- Figure 36: Europe Power Braking Resistor Volume (K), by Country 2024 & 2032
- Figure 37: Europe Power Braking Resistor Revenue Share (%), by Country 2024 & 2032
- Figure 38: Europe Power Braking Resistor Volume Share (%), by Country 2024 & 2032
- Figure 39: Middle East & Africa Power Braking Resistor Revenue (million), by Application 2024 & 2032
- Figure 40: Middle East & Africa Power Braking Resistor Volume (K), by Application 2024 & 2032
- Figure 41: Middle East & Africa Power Braking Resistor Revenue Share (%), by Application 2024 & 2032
- Figure 42: Middle East & Africa Power Braking Resistor Volume Share (%), by Application 2024 & 2032
- Figure 43: Middle East & Africa Power Braking Resistor Revenue (million), by Types 2024 & 2032
- Figure 44: Middle East & Africa Power Braking Resistor Volume (K), by Types 2024 & 2032
- Figure 45: Middle East & Africa Power Braking Resistor Revenue Share (%), by Types 2024 & 2032
- Figure 46: Middle East & Africa Power Braking Resistor Volume Share (%), by Types 2024 & 2032
- Figure 47: Middle East & Africa Power Braking Resistor Revenue (million), by Country 2024 & 2032
- Figure 48: Middle East & Africa Power Braking Resistor Volume (K), by Country 2024 & 2032
- Figure 49: Middle East & Africa Power Braking Resistor Revenue Share (%), by Country 2024 & 2032
- Figure 50: Middle East & Africa Power Braking Resistor Volume Share (%), by Country 2024 & 2032
- Figure 51: Asia Pacific Power Braking Resistor Revenue (million), by Application 2024 & 2032
- Figure 52: Asia Pacific Power Braking Resistor Volume (K), by Application 2024 & 2032
- Figure 53: Asia Pacific Power Braking Resistor Revenue Share (%), by Application 2024 & 2032
- Figure 54: Asia Pacific Power Braking Resistor Volume Share (%), by Application 2024 & 2032
- Figure 55: Asia Pacific Power Braking Resistor Revenue (million), by Types 2024 & 2032
- Figure 56: Asia Pacific Power Braking Resistor Volume (K), by Types 2024 & 2032
- Figure 57: Asia Pacific Power Braking Resistor Revenue Share (%), by Types 2024 & 2032
- Figure 58: Asia Pacific Power Braking Resistor Volume Share (%), by Types 2024 & 2032
- Figure 59: Asia Pacific Power Braking Resistor Revenue (million), by Country 2024 & 2032
- Figure 60: Asia Pacific Power Braking Resistor Volume (K), by Country 2024 & 2032
- Figure 61: Asia Pacific Power Braking Resistor Revenue Share (%), by Country 2024 & 2032
- Figure 62: Asia Pacific Power Braking Resistor Volume Share (%), by Country 2024 & 2032
List of Tables
- Table 1: Global Power Braking Resistor Revenue million Forecast, by Region 2019 & 2032
- Table 2: Global Power Braking Resistor Volume K Forecast, by Region 2019 & 2032
- Table 3: Global Power Braking Resistor Revenue million Forecast, by Application 2019 & 2032
- Table 4: Global Power Braking Resistor Volume K Forecast, by Application 2019 & 2032
- Table 5: Global Power Braking Resistor Revenue million Forecast, by Types 2019 & 2032
- Table 6: Global Power Braking Resistor Volume K Forecast, by Types 2019 & 2032
- Table 7: Global Power Braking Resistor Revenue million Forecast, by Region 2019 & 2032
- Table 8: Global Power Braking Resistor Volume K Forecast, by Region 2019 & 2032
- Table 9: Global Power Braking Resistor Revenue million Forecast, by Application 2019 & 2032
- Table 10: Global Power Braking Resistor Volume K Forecast, by Application 2019 & 2032
- Table 11: Global Power Braking Resistor Revenue million Forecast, by Types 2019 & 2032
- Table 12: Global Power Braking Resistor Volume K Forecast, by Types 2019 & 2032
- Table 13: Global Power Braking Resistor Revenue million Forecast, by Country 2019 & 2032
- Table 14: Global Power Braking Resistor Volume K Forecast, by Country 2019 & 2032
- Table 15: United States Power Braking Resistor Revenue (million) Forecast, by Application 2019 & 2032
- Table 16: United States Power Braking Resistor Volume (K) Forecast, by Application 2019 & 2032
- Table 17: Canada Power Braking Resistor Revenue (million) Forecast, by Application 2019 & 2032
- Table 18: Canada Power Braking Resistor Volume (K) Forecast, by Application 2019 & 2032
- Table 19: Mexico Power Braking Resistor Revenue (million) Forecast, by Application 2019 & 2032
- Table 20: Mexico Power Braking Resistor Volume (K) Forecast, by Application 2019 & 2032
- Table 21: Global Power Braking Resistor Revenue million Forecast, by Application 2019 & 2032
- Table 22: Global Power Braking Resistor Volume K Forecast, by Application 2019 & 2032
- Table 23: Global Power Braking Resistor Revenue million Forecast, by Types 2019 & 2032
- Table 24: Global Power Braking Resistor Volume K Forecast, by Types 2019 & 2032
- Table 25: Global Power Braking Resistor Revenue million Forecast, by Country 2019 & 2032
- Table 26: Global Power Braking Resistor Volume K Forecast, by Country 2019 & 2032
- Table 27: Brazil Power Braking Resistor Revenue (million) Forecast, by Application 2019 & 2032
- Table 28: Brazil Power Braking Resistor Volume (K) Forecast, by Application 2019 & 2032
- Table 29: Argentina Power Braking Resistor Revenue (million) Forecast, by Application 2019 & 2032
- Table 30: Argentina Power Braking Resistor Volume (K) Forecast, by Application 2019 & 2032
- Table 31: Rest of South America Power Braking Resistor Revenue (million) Forecast, by Application 2019 & 2032
- Table 32: Rest of South America Power Braking Resistor Volume (K) Forecast, by Application 2019 & 2032
- Table 33: Global Power Braking Resistor Revenue million Forecast, by Application 2019 & 2032
- Table 34: Global Power Braking Resistor Volume K Forecast, by Application 2019 & 2032
- Table 35: Global Power Braking Resistor Revenue million Forecast, by Types 2019 & 2032
- Table 36: Global Power Braking Resistor Volume K Forecast, by Types 2019 & 2032
- Table 37: Global Power Braking Resistor Revenue million Forecast, by Country 2019 & 2032
- Table 38: Global Power Braking Resistor Volume K Forecast, by Country 2019 & 2032
- Table 39: United Kingdom Power Braking Resistor Revenue (million) Forecast, by Application 2019 & 2032
- Table 40: United Kingdom Power Braking Resistor Volume (K) Forecast, by Application 2019 & 2032
- Table 41: Germany Power Braking Resistor Revenue (million) Forecast, by Application 2019 & 2032
- Table 42: Germany Power Braking Resistor Volume (K) Forecast, by Application 2019 & 2032
- Table 43: France Power Braking Resistor Revenue (million) Forecast, by Application 2019 & 2032
- Table 44: France Power Braking Resistor Volume (K) Forecast, by Application 2019 & 2032
- Table 45: Italy Power Braking Resistor Revenue (million) Forecast, by Application 2019 & 2032
- Table 46: Italy Power Braking Resistor Volume (K) Forecast, by Application 2019 & 2032
- Table 47: Spain Power Braking Resistor Revenue (million) Forecast, by Application 2019 & 2032
- Table 48: Spain Power Braking Resistor Volume (K) Forecast, by Application 2019 & 2032
- Table 49: Russia Power Braking Resistor Revenue (million) Forecast, by Application 2019 & 2032
- Table 50: Russia Power Braking Resistor Volume (K) Forecast, by Application 2019 & 2032
- Table 51: Benelux Power Braking Resistor Revenue (million) Forecast, by Application 2019 & 2032
- Table 52: Benelux Power Braking Resistor Volume (K) Forecast, by Application 2019 & 2032
- Table 53: Nordics Power Braking Resistor Revenue (million) Forecast, by Application 2019 & 2032
- Table 54: Nordics Power Braking Resistor Volume (K) Forecast, by Application 2019 & 2032
- Table 55: Rest of Europe Power Braking Resistor Revenue (million) Forecast, by Application 2019 & 2032
- Table 56: Rest of Europe Power Braking Resistor Volume (K) Forecast, by Application 2019 & 2032
- Table 57: Global Power Braking Resistor Revenue million Forecast, by Application 2019 & 2032
- Table 58: Global Power Braking Resistor Volume K Forecast, by Application 2019 & 2032
- Table 59: Global Power Braking Resistor Revenue million Forecast, by Types 2019 & 2032
- Table 60: Global Power Braking Resistor Volume K Forecast, by Types 2019 & 2032
- Table 61: Global Power Braking Resistor Revenue million Forecast, by Country 2019 & 2032
- Table 62: Global Power Braking Resistor Volume K Forecast, by Country 2019 & 2032
- Table 63: Turkey Power Braking Resistor Revenue (million) Forecast, by Application 2019 & 2032
- Table 64: Turkey Power Braking Resistor Volume (K) Forecast, by Application 2019 & 2032
- Table 65: Israel Power Braking Resistor Revenue (million) Forecast, by Application 2019 & 2032
- Table 66: Israel Power Braking Resistor Volume (K) Forecast, by Application 2019 & 2032
- Table 67: GCC Power Braking Resistor Revenue (million) Forecast, by Application 2019 & 2032
- Table 68: GCC Power Braking Resistor Volume (K) Forecast, by Application 2019 & 2032
- Table 69: North Africa Power Braking Resistor Revenue (million) Forecast, by Application 2019 & 2032
- Table 70: North Africa Power Braking Resistor Volume (K) Forecast, by Application 2019 & 2032
- Table 71: South Africa Power Braking Resistor Revenue (million) Forecast, by Application 2019 & 2032
- Table 72: South Africa Power Braking Resistor Volume (K) Forecast, by Application 2019 & 2032
- Table 73: Rest of Middle East & Africa Power Braking Resistor Revenue (million) Forecast, by Application 2019 & 2032
- Table 74: Rest of Middle East & Africa Power Braking Resistor Volume (K) Forecast, by Application 2019 & 2032
- Table 75: Global Power Braking Resistor Revenue million Forecast, by Application 2019 & 2032
- Table 76: Global Power Braking Resistor Volume K Forecast, by Application 2019 & 2032
- Table 77: Global Power Braking Resistor Revenue million Forecast, by Types 2019 & 2032
- Table 78: Global Power Braking Resistor Volume K Forecast, by Types 2019 & 2032
- Table 79: Global Power Braking Resistor Revenue million Forecast, by Country 2019 & 2032
- Table 80: Global Power Braking Resistor Volume K Forecast, by Country 2019 & 2032
- Table 81: China Power Braking Resistor Revenue (million) Forecast, by Application 2019 & 2032
- Table 82: China Power Braking Resistor Volume (K) Forecast, by Application 2019 & 2032
- Table 83: India Power Braking Resistor Revenue (million) Forecast, by Application 2019 & 2032
- Table 84: India Power Braking Resistor Volume (K) Forecast, by Application 2019 & 2032
- Table 85: Japan Power Braking Resistor Revenue (million) Forecast, by Application 2019 & 2032
- Table 86: Japan Power Braking Resistor Volume (K) Forecast, by Application 2019 & 2032
- Table 87: South Korea Power Braking Resistor Revenue (million) Forecast, by Application 2019 & 2032
- Table 88: South Korea Power Braking Resistor Volume (K) Forecast, by Application 2019 & 2032
- Table 89: ASEAN Power Braking Resistor Revenue (million) Forecast, by Application 2019 & 2032
- Table 90: ASEAN Power Braking Resistor Volume (K) Forecast, by Application 2019 & 2032
- Table 91: Oceania Power Braking Resistor Revenue (million) Forecast, by Application 2019 & 2032
- Table 92: Oceania Power Braking Resistor Volume (K) Forecast, by Application 2019 & 2032
- Table 93: Rest of Asia Pacific Power Braking Resistor Revenue (million) Forecast, by Application 2019 & 2032
- Table 94: Rest of Asia Pacific Power Braking Resistor Volume (K) Forecast, by Application 2019 & 2032
Frequently Asked Questions
1. What is the projected Compound Annual Growth Rate (CAGR) of the Power Braking Resistor?
The projected CAGR is approximately XX%.
2. Which companies are prominent players in the Power Braking Resistor?
Key companies in the market include Sandvik AB, Cressall (Telema SpA), FRIZLEN, REO, Post Glover, Eaton, Powerohm (Hubbell), Toshiba, ABB, Siemens, Rockwell, Schneider Electric, Yaskawa, Danfoss, Mitsubishi Electric, Nidec, Vishay, Delta, Hitachi, Omron, Transfab TMS, Hilkar.
3. What are the main segments of the Power Braking Resistor?
The market segments include Application, Types.
4. Can you provide details about the market size?
The market size is estimated to be USD XXX million as of 2022.
5. What are some drivers contributing to market growth?
N/A
6. What are the notable trends driving market growth?
N/A
7. Are there any restraints impacting market growth?
N/A
8. Can you provide examples of recent developments in the market?
N/A
9. What pricing options are available for accessing the report?
Pricing options include single-user, multi-user, and enterprise licenses priced at USD 3350.00, USD 5025.00, and USD 6700.00 respectively.
10. Is the market size provided in terms of value or volume?
The market size is provided in terms of value, measured in million and volume, measured in K.
11. Are there any specific market keywords associated with the report?
Yes, the market keyword associated with the report is "Power Braking Resistor," which aids in identifying and referencing the specific market segment covered.
12. How do I determine which pricing option suits my needs best?
The pricing options vary based on user requirements and access needs. Individual users may opt for single-user licenses, while businesses requiring broader access may choose multi-user or enterprise licenses for cost-effective access to the report.
13. Are there any additional resources or data provided in the Power Braking Resistor report?
While the report offers comprehensive insights, it's advisable to review the specific contents or supplementary materials provided to ascertain if additional resources or data are available.
14. How can I stay updated on further developments or reports in the Power Braking Resistor?
To stay informed about further developments, trends, and reports in the Power Braking Resistor, consider subscribing to industry newsletters, following relevant companies and organizations, or regularly checking reputable industry news sources and publications.
Methodology
Step 1 - Identification of Relevant Samples Size from Population Database


Step 2 - Approaches for Defining Global Market Size (Value, Volume* & Price*)

Note*: In applicable scenarios
Step 3 - Data Sources
Primary Research
- Web Analytics
- Survey Reports
- Research Institute
- Latest Research Reports
- Opinion Leaders
Secondary Research
- Annual Reports
- White Paper
- Latest Press Release
- Industry Association
- Paid Database
- Investor Presentations

Step 4 - Data Triangulation
Involves using different sources of information in order to increase the validity of a study
These sources are likely to be stakeholders in a program - participants, other researchers, program staff, other community members, and so on.
Then we put all data in single framework & apply various statistical tools to find out the dynamic on the market.
During the analysis stage, feedback from the stakeholder groups would be compared to determine areas of agreement as well as areas of divergence
