

Key Insights
The global prepreg market, valued at approximately 13.2 billion in 2024, is projected for significant expansion, driven by a compound annual growth rate (CAGR) of 6.92% from 2024 to 2033. Key growth catalysts include escalating demand for lightweight, high-strength materials across aerospace & defense, automotive, and wind energy sectors, prioritizing fuel efficiency, performance, and safety. Technological advancements in resin and fiber technology, enhancing prepreg durability, toughness, and processability, further stimulate market growth. The electronics industry's adoption of prepregs for printed circuit boards also presents a substantial opportunity. Market restraints involve the higher cost of prepregs compared to alternatives and manufacturing complexities. Competitive dynamics and regional growth, particularly in Asia Pacific, will shape market evolution.
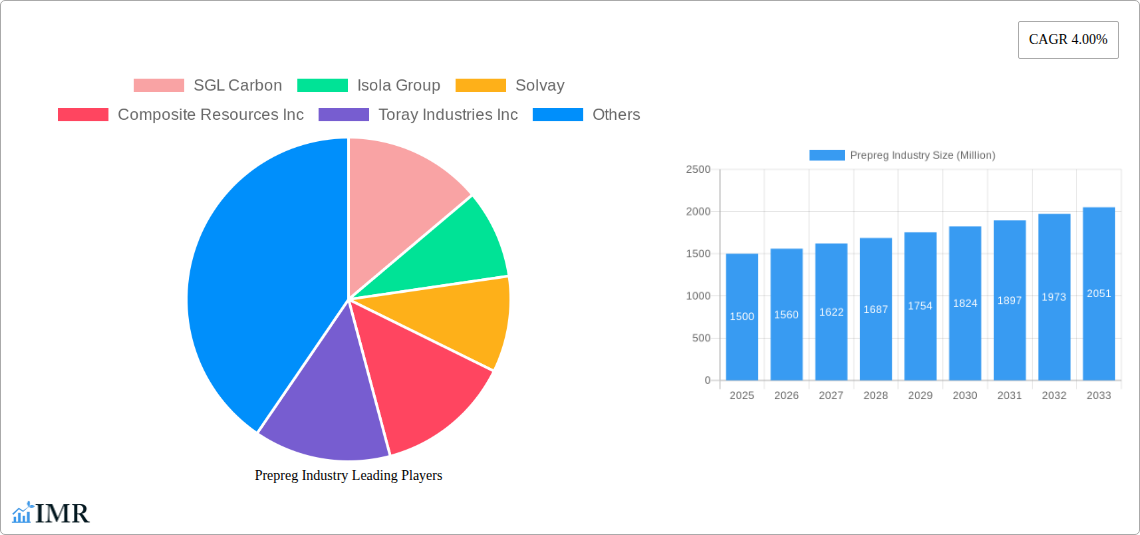
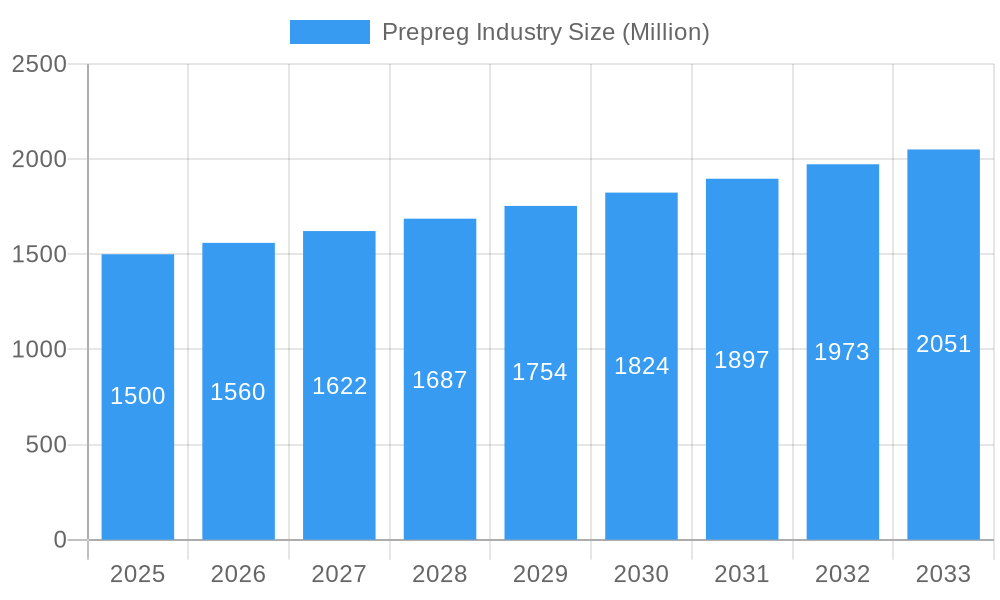
Prepreg Industry Market Size (In Billion)
Market segmentation highlights the dominance of thermoset resins due to their superior strength and heat resistance, with thermoplastic resins gaining traction for their recyclability. Carbon fiber leads as the primary fiber type, prized for its strength-to-weight ratio, while glass and aramid fibers serve specific application needs based on cost and performance. Aerospace & defense is the leading end-user segment, followed by automotive and wind energy. Future market trajectory will be influenced by high-performance material development, innovative manufacturing, and the pursuit of sustainable, cost-effective solutions.
Prepreg Industry Company Market Share
Prepreg Industry Market Report: 2019-2033
This comprehensive report provides an in-depth analysis of the prepreg industry, encompassing market dynamics, growth trends, regional segmentation, product landscape, key players, and future outlook. The report covers the period from 2019 to 2033, with a focus on the forecast period from 2025 to 2033, using 2025 as the base year. Market values are presented in millions of units.
Prepreg Industry Market Dynamics & Structure
The prepreg market is characterized by moderate concentration, with several key players holding significant market share. Technological innovation, particularly in advanced fiber materials and resin systems, is a major driver. Stringent regulatory frameworks concerning environmental impact and safety influence manufacturing processes. Competitive substitutes include alternative composite materials and traditional manufacturing methods. End-user demographics are shifting towards industries demanding high-performance and lightweight materials. M&A activity has been moderate, reflecting strategic consolidation within the sector.
- Market Concentration: Moderately concentrated, with the top 5 players holding approximately xx% of the global market share in 2025.
- Technological Innovation: Focus on high-strength, lightweight materials, improved processing techniques, and sustainable resin systems.
- Regulatory Landscape: Stringent environmental regulations and safety standards impacting manufacturing and disposal.
- Competitive Substitutes: Alternative composite materials like pultrusion and other manufacturing processes.
- M&A Activity: xx major mergers and acquisitions recorded between 2019 and 2024, primarily focused on expanding product portfolios and geographical reach.
- Innovation Barriers: High R&D costs, complex material science, and long product development cycles.
Prepreg Industry Growth Trends & Insights
The prepreg market experienced robust growth during the historical period (2019-2024), driven by increasing demand from key end-use sectors like aerospace and automotive. The market is projected to maintain a healthy Compound Annual Growth Rate (CAGR) of xx% during the forecast period (2025-2033), reaching a market value of xx million units by 2033. Adoption rates are increasing across various sectors, particularly in applications requiring high strength-to-weight ratios and improved durability. Technological disruptions, such as the introduction of advanced fiber types and resin systems, are accelerating market growth. Consumer behavior shifts towards sustainability are influencing the demand for eco-friendly prepreg materials. Market penetration is expected to increase significantly in emerging economies.
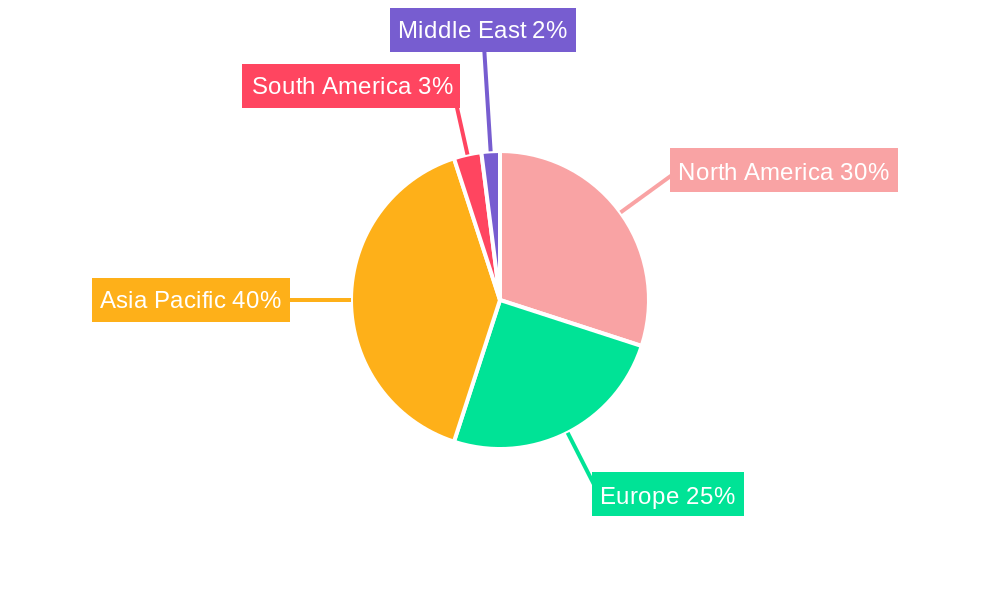
Dominant Regions, Countries, or Segments in Prepreg Industry
North America currently holds the largest market share, driven by a strong aerospace and defense sector. However, Asia-Pacific is projected to witness the fastest growth rate during the forecast period due to expanding automotive and wind energy industries. Within product segments, carbon fiber prepregs dominate the market, owing to superior mechanical properties. The aerospace and defense sector represents the largest end-user industry, followed by the automotive sector.
- Leading Region: North America (Market Share: xx% in 2025)
- Fastest Growing Region: Asia-Pacific (CAGR: xx% from 2025-2033)
- Dominant Fiber Type: Carbon Fiber (Market Share: xx% in 2025)
- Largest End-User Industry: Aerospace and Defense (Market Share: xx% in 2025)
- Key Growth Drivers: Government initiatives promoting renewable energy (Wind Turbine), increasing demand for lightweight vehicles (Automotive), advancements in aerospace technology (Aerospace & Defense)
Prepreg Industry Product Landscape
Prepreg products are continuously evolving, with innovations focused on enhancing mechanical properties, improving processability, and increasing sustainability. New resin systems and fiber types are being developed to meet the demanding requirements of various applications. Unique selling propositions include superior strength-to-weight ratios, improved fatigue resistance, and enhanced durability. Technological advancements are driving the adoption of prepreg materials in high-performance applications.
Key Drivers, Barriers & Challenges in Prepreg Industry
Key Drivers: Growing demand from aerospace and automotive sectors, increasing adoption in renewable energy applications (wind turbines), and advancements in materials science leading to improved performance characteristics. Government investments in infrastructure projects are also providing a substantial boost.
Key Challenges: High raw material costs, supply chain disruptions, stringent environmental regulations, and intense competition from alternative materials. The volatility of raw material prices presents a significant challenge, potentially impacting profitability.
Emerging Opportunities in Prepreg Industry
Untapped markets in developing economies, the growing adoption of prepregs in the electric vehicle industry, and the increasing demand for high-performance composites in sports and leisure applications present significant opportunities for growth. Innovations in bio-based resins and recycled fiber materials offer avenues for sustainable prepreg production.
Growth Accelerators in the Prepreg Industry Industry
Technological breakthroughs in fiber and resin technology, strategic partnerships between material suppliers and manufacturers, and expansion into new geographical markets are key accelerators for long-term growth. Increased investment in R&D, focused on developing next-generation materials, will significantly contribute to market expansion.
Key Players Shaping the Prepreg Industry Market
- SGL Carbon
- Isola Group
- Solvay
- Composite Resources Inc
- Toray Industries Inc
- Sunrez Corporation
- Ventec International Group
- Axiom Materials
- Yokohama Aerospace America Inc
- Renegade Materials Corporation
- Park Eletrochemical Corp
- Mitsubishi Chemical Carbon Fiber and Composites Inc
- Hexcel Corporation
- Koninklijke Ten Cate BV
- Gurit
- TEIJIN LIMITED
- Zoltek
- *List Not Exhaustive
Notable Milestones in Prepreg Industry Sector
- 2020: Introduction of a new bio-based resin system by Solvay.
- 2021: Strategic partnership between Toray and an automotive manufacturer for the development of lightweight vehicles.
- 2022: Acquisition of a smaller prepreg manufacturer by Hexcel Corporation.
- 2023: Launch of a new high-strength carbon fiber prepreg by SGL Carbon.
- 2024: Implementation of new sustainable manufacturing processes by several key players.
In-Depth Prepreg Industry Market Outlook
The prepreg market is poised for significant growth over the next decade. Continued advancements in materials science, coupled with rising demand from key end-use sectors, will drive market expansion. Strategic partnerships and investments in R&D will play a critical role in shaping the future landscape. The focus on sustainability and the development of eco-friendly materials will further fuel market growth. The adoption of prepregs in emerging applications, such as drone technology and space exploration, presents additional opportunities for market expansion.
Prepreg Industry Segmentation
-
1. Resin Type
- 1.1. Thermoset
- 1.2. Thermoplastic
-
2. Fiber Type
- 2.1. Carbon
- 2.2. Glass
- 2.3. Aramid
-
3. End-user Industry
- 3.1. Aerospace and Defense
- 3.2. Automotive
- 3.3. Electrical and Electronics
- 3.4. Wind Turbine
- 3.5. Leisure
- 3.6. Other End-user Industries
Prepreg Industry Segmentation By Geography
-
1. Asia Pacific
- 1.1. China
- 1.2. India
- 1.3. Japan
- 1.4. South Korea
- 1.5. Rest of Asia Pacific
-
2. North America
- 2.1. United States
- 2.2. Canada
- 2.3. Mexico
-
3. Europe
- 3.1. Germany
- 3.2. United Kingdom
- 3.3. Italy
- 3.4. France
- 3.5. Rest of Europe
-
4. South America
- 4.1. Brazil
- 4.2. Argentina
- 4.3. Rest of South America
- 5. Middle East
-
6. Saudi Arabia
- 6.1. South Africa
- 6.2. Rest of Middle East
Prepreg Industry Regional Market Share
Geographic Coverage of Prepreg Industry
Prepreg Industry REPORT HIGHLIGHTS
| Aspects | Details |
|---|---|
| Study Period | 2020-2034 |
| Base Year | 2025 |
| Estimated Year | 2026 |
| Forecast Period | 2026-2034 |
| Historical Period | 2020-2025 |
| Growth Rate | CAGR of 6.92% from 2020-2034 |
| Segmentation |
|
Table of Contents
- 1. Introduction
- 1.1. Research Scope
- 1.2. Market Segmentation
- 1.3. Research Objective
- 1.4. Definitions and Assumptions
- 2. Executive Summary
- 2.1. Market Snapshot
- 3. Market Dynamics
- 3.1. Market Drivers
- 3.2. Market Restrains
- 3.3. Market Trends
- 3.4. Market Opportunities
- 4. Market Factor Analysis
- 4.1. Porters Five Forces
- 4.1.1. Bargaining Power of Suppliers
- 4.1.2. Bargaining Power of Buyers
- 4.1.3. Threat of New Entrants
- 4.1.4. Threat of Substitutes
- 4.1.5. Competitive Rivalry
- 4.2. PESTEL analysis
- 4.3. BCG Analysis
- 4.3.1. Stars (High Growth, High Market Share)
- 4.3.2. Cash Cows (Low Growth, High Market Share)
- 4.3.3. Question Mark (High Growth, Low Market Share)
- 4.3.4. Dogs (Low Growth, Low Market Share)
- 4.4. Ansoff Matrix Analysis
- 4.5. Supply Chain Analysis
- 4.6. Regulatory Landscape
- 4.7. Current Market Potential and Opportunity Assessment (TAM–SAM–SOM Framework)
- 4.8. IMR Analyst Note
- 4.1. Porters Five Forces
- 5. Market Analysis, Insights and Forecast 2021-2033
- 5.1. Market Analysis, Insights and Forecast - by Resin Type
- 5.1.1. Thermoset
- 5.1.2. Thermoplastic
- 5.2. Market Analysis, Insights and Forecast - by Fiber Type
- 5.2.1. Carbon
- 5.2.2. Glass
- 5.2.3. Aramid
- 5.3. Market Analysis, Insights and Forecast - by End-user Industry
- 5.3.1. Aerospace and Defense
- 5.3.2. Automotive
- 5.3.3. Electrical and Electronics
- 5.3.4. Wind Turbine
- 5.3.5. Leisure
- 5.3.6. Other End-user Industries
- 5.4. Market Analysis, Insights and Forecast - by Region
- 5.4.1. Asia Pacific
- 5.4.2. North America
- 5.4.3. Europe
- 5.4.4. South America
- 5.4.5. Middle East
- 5.4.6. Saudi Arabia
- 5.1. Market Analysis, Insights and Forecast - by Resin Type
- 6. Global Prepreg Industry Analysis, Insights and Forecast, 2021-2033
- 6.1. Market Analysis, Insights and Forecast - by Resin Type
- 6.1.1. Thermoset
- 6.1.2. Thermoplastic
- 6.2. Market Analysis, Insights and Forecast - by Fiber Type
- 6.2.1. Carbon
- 6.2.2. Glass
- 6.2.3. Aramid
- 6.3. Market Analysis, Insights and Forecast - by End-user Industry
- 6.3.1. Aerospace and Defense
- 6.3.2. Automotive
- 6.3.3. Electrical and Electronics
- 6.3.4. Wind Turbine
- 6.3.5. Leisure
- 6.3.6. Other End-user Industries
- 6.1. Market Analysis, Insights and Forecast - by Resin Type
- 7. Asia Pacific Prepreg Industry Analysis, Insights and Forecast, 2020-2032
- 7.1. Market Analysis, Insights and Forecast - by Resin Type
- 7.1.1. Thermoset
- 7.1.2. Thermoplastic
- 7.2. Market Analysis, Insights and Forecast - by Fiber Type
- 7.2.1. Carbon
- 7.2.2. Glass
- 7.2.3. Aramid
- 7.3. Market Analysis, Insights and Forecast - by End-user Industry
- 7.3.1. Aerospace and Defense
- 7.3.2. Automotive
- 7.3.3. Electrical and Electronics
- 7.3.4. Wind Turbine
- 7.3.5. Leisure
- 7.3.6. Other End-user Industries
- 7.1. Market Analysis, Insights and Forecast - by Resin Type
- 8. North America Prepreg Industry Analysis, Insights and Forecast, 2020-2032
- 8.1. Market Analysis, Insights and Forecast - by Resin Type
- 8.1.1. Thermoset
- 8.1.2. Thermoplastic
- 8.2. Market Analysis, Insights and Forecast - by Fiber Type
- 8.2.1. Carbon
- 8.2.2. Glass
- 8.2.3. Aramid
- 8.3. Market Analysis, Insights and Forecast - by End-user Industry
- 8.3.1. Aerospace and Defense
- 8.3.2. Automotive
- 8.3.3. Electrical and Electronics
- 8.3.4. Wind Turbine
- 8.3.5. Leisure
- 8.3.6. Other End-user Industries
- 8.1. Market Analysis, Insights and Forecast - by Resin Type
- 9. Europe Prepreg Industry Analysis, Insights and Forecast, 2020-2032
- 9.1. Market Analysis, Insights and Forecast - by Resin Type
- 9.1.1. Thermoset
- 9.1.2. Thermoplastic
- 9.2. Market Analysis, Insights and Forecast - by Fiber Type
- 9.2.1. Carbon
- 9.2.2. Glass
- 9.2.3. Aramid
- 9.3. Market Analysis, Insights and Forecast - by End-user Industry
- 9.3.1. Aerospace and Defense
- 9.3.2. Automotive
- 9.3.3. Electrical and Electronics
- 9.3.4. Wind Turbine
- 9.3.5. Leisure
- 9.3.6. Other End-user Industries
- 9.1. Market Analysis, Insights and Forecast - by Resin Type
- 10. South America Prepreg Industry Analysis, Insights and Forecast, 2020-2032
- 10.1. Market Analysis, Insights and Forecast - by Resin Type
- 10.1.1. Thermoset
- 10.1.2. Thermoplastic
- 10.2. Market Analysis, Insights and Forecast - by Fiber Type
- 10.2.1. Carbon
- 10.2.2. Glass
- 10.2.3. Aramid
- 10.3. Market Analysis, Insights and Forecast - by End-user Industry
- 10.3.1. Aerospace and Defense
- 10.3.2. Automotive
- 10.3.3. Electrical and Electronics
- 10.3.4. Wind Turbine
- 10.3.5. Leisure
- 10.3.6. Other End-user Industries
- 10.1. Market Analysis, Insights and Forecast - by Resin Type
- 11. Middle East Prepreg Industry Analysis, Insights and Forecast, 2020-2032
- 11.1. Market Analysis, Insights and Forecast - by Resin Type
- 11.1.1. Thermoset
- 11.1.2. Thermoplastic
- 11.2. Market Analysis, Insights and Forecast - by Fiber Type
- 11.2.1. Carbon
- 11.2.2. Glass
- 11.2.3. Aramid
- 11.3. Market Analysis, Insights and Forecast - by End-user Industry
- 11.3.1. Aerospace and Defense
- 11.3.2. Automotive
- 11.3.3. Electrical and Electronics
- 11.3.4. Wind Turbine
- 11.3.5. Leisure
- 11.3.6. Other End-user Industries
- 11.1. Market Analysis, Insights and Forecast - by Resin Type
- 12. Saudi Arabia Prepreg Industry Analysis, Insights and Forecast, 2020-2032
- 12.1. Market Analysis, Insights and Forecast - by Resin Type
- 12.1.1. Thermoset
- 12.1.2. Thermoplastic
- 12.2. Market Analysis, Insights and Forecast - by Fiber Type
- 12.2.1. Carbon
- 12.2.2. Glass
- 12.2.3. Aramid
- 12.3. Market Analysis, Insights and Forecast - by End-user Industry
- 12.3.1. Aerospace and Defense
- 12.3.2. Automotive
- 12.3.3. Electrical and Electronics
- 12.3.4. Wind Turbine
- 12.3.5. Leisure
- 12.3.6. Other End-user Industries
- 12.1. Market Analysis, Insights and Forecast - by Resin Type
- 13. Competitive Analysis
- 13.1. Company Profiles
- 13.1.1 SGL Carbon
- 13.1.1.1. Company Overview
- 13.1.1.2. Products
- 13.1.1.3. Company Financials
- 13.1.1.4. SWOT Analysis
- 13.1.2 Isola Group
- 13.1.2.1. Company Overview
- 13.1.2.2. Products
- 13.1.2.3. Company Financials
- 13.1.2.4. SWOT Analysis
- 13.1.3 Solvay
- 13.1.3.1. Company Overview
- 13.1.3.2. Products
- 13.1.3.3. Company Financials
- 13.1.3.4. SWOT Analysis
- 13.1.4 Composite Resources Inc
- 13.1.4.1. Company Overview
- 13.1.4.2. Products
- 13.1.4.3. Company Financials
- 13.1.4.4. SWOT Analysis
- 13.1.5 Toray Industries Inc
- 13.1.5.1. Company Overview
- 13.1.5.2. Products
- 13.1.5.3. Company Financials
- 13.1.5.4. SWOT Analysis
- 13.1.6 Sunrez Corporation
- 13.1.6.1. Company Overview
- 13.1.6.2. Products
- 13.1.6.3. Company Financials
- 13.1.6.4. SWOT Analysis
- 13.1.7 Ventec International Group
- 13.1.7.1. Company Overview
- 13.1.7.2. Products
- 13.1.7.3. Company Financials
- 13.1.7.4. SWOT Analysis
- 13.1.8 Axiom Materials
- 13.1.8.1. Company Overview
- 13.1.8.2. Products
- 13.1.8.3. Company Financials
- 13.1.8.4. SWOT Analysis
- 13.1.9 Yokohama Aerospace America Inc
- 13.1.9.1. Company Overview
- 13.1.9.2. Products
- 13.1.9.3. Company Financials
- 13.1.9.4. SWOT Analysis
- 13.1.10 Renegade Materials Corporation
- 13.1.10.1. Company Overview
- 13.1.10.2. Products
- 13.1.10.3. Company Financials
- 13.1.10.4. SWOT Analysis
- 13.1.11 Park Eletrochemical Corp
- 13.1.11.1. Company Overview
- 13.1.11.2. Products
- 13.1.11.3. Company Financials
- 13.1.11.4. SWOT Analysis
- 13.1.12 Mitsubishi Chemical Carbon Fiber and Composites Inc
- 13.1.12.1. Company Overview
- 13.1.12.2. Products
- 13.1.12.3. Company Financials
- 13.1.12.4. SWOT Analysis
- 13.1.13 Hexcel Corporation
- 13.1.13.1. Company Overview
- 13.1.13.2. Products
- 13.1.13.3. Company Financials
- 13.1.13.4. SWOT Analysis
- 13.1.14 Koninklijke Ten Cate BV
- 13.1.14.1. Company Overview
- 13.1.14.2. Products
- 13.1.14.3. Company Financials
- 13.1.14.4. SWOT Analysis
- 13.1.15 Gurit
- 13.1.15.1. Company Overview
- 13.1.15.2. Products
- 13.1.15.3. Company Financials
- 13.1.15.4. SWOT Analysis
- 13.1.16 TEIJIN LIMITED
- 13.1.16.1. Company Overview
- 13.1.16.2. Products
- 13.1.16.3. Company Financials
- 13.1.16.4. SWOT Analysis
- 13.1.17 Zoltek*List Not Exhaustive
- 13.1.17.1. Company Overview
- 13.1.17.2. Products
- 13.1.17.3. Company Financials
- 13.1.17.4. SWOT Analysis
- 13.1.1 SGL Carbon
- 13.2. Market Entropy
- 13.2.1 Company's Key Areas Served
- 13.2.2 Recent Developments
- 13.3. Company Market Share Analysis 2025
- 13.3.1 Top 5 Companies Market Share Analysis
- 13.3.2 Top 3 Companies Market Share Analysis
- 13.4. List of Potential Customers
- 14. Research Methodology
List of Figures
- Figure 1: Global Prepreg Industry Revenue Breakdown (billion, %) by Region 2025 & 2033
- Figure 2: Global Prepreg Industry Volume Breakdown (K Tons, %) by Region 2025 & 2033
- Figure 3: Asia Pacific Prepreg Industry Revenue (billion), by Resin Type 2025 & 2033
- Figure 4: Asia Pacific Prepreg Industry Volume (K Tons), by Resin Type 2025 & 2033
- Figure 5: Asia Pacific Prepreg Industry Revenue Share (%), by Resin Type 2025 & 2033
- Figure 6: Asia Pacific Prepreg Industry Volume Share (%), by Resin Type 2025 & 2033
- Figure 7: Asia Pacific Prepreg Industry Revenue (billion), by Fiber Type 2025 & 2033
- Figure 8: Asia Pacific Prepreg Industry Volume (K Tons), by Fiber Type 2025 & 2033
- Figure 9: Asia Pacific Prepreg Industry Revenue Share (%), by Fiber Type 2025 & 2033
- Figure 10: Asia Pacific Prepreg Industry Volume Share (%), by Fiber Type 2025 & 2033
- Figure 11: Asia Pacific Prepreg Industry Revenue (billion), by End-user Industry 2025 & 2033
- Figure 12: Asia Pacific Prepreg Industry Volume (K Tons), by End-user Industry 2025 & 2033
- Figure 13: Asia Pacific Prepreg Industry Revenue Share (%), by End-user Industry 2025 & 2033
- Figure 14: Asia Pacific Prepreg Industry Volume Share (%), by End-user Industry 2025 & 2033
- Figure 15: Asia Pacific Prepreg Industry Revenue (billion), by Country 2025 & 2033
- Figure 16: Asia Pacific Prepreg Industry Volume (K Tons), by Country 2025 & 2033
- Figure 17: Asia Pacific Prepreg Industry Revenue Share (%), by Country 2025 & 2033
- Figure 18: Asia Pacific Prepreg Industry Volume Share (%), by Country 2025 & 2033
- Figure 19: North America Prepreg Industry Revenue (billion), by Resin Type 2025 & 2033
- Figure 20: North America Prepreg Industry Volume (K Tons), by Resin Type 2025 & 2033
- Figure 21: North America Prepreg Industry Revenue Share (%), by Resin Type 2025 & 2033
- Figure 22: North America Prepreg Industry Volume Share (%), by Resin Type 2025 & 2033
- Figure 23: North America Prepreg Industry Revenue (billion), by Fiber Type 2025 & 2033
- Figure 24: North America Prepreg Industry Volume (K Tons), by Fiber Type 2025 & 2033
- Figure 25: North America Prepreg Industry Revenue Share (%), by Fiber Type 2025 & 2033
- Figure 26: North America Prepreg Industry Volume Share (%), by Fiber Type 2025 & 2033
- Figure 27: North America Prepreg Industry Revenue (billion), by End-user Industry 2025 & 2033
- Figure 28: North America Prepreg Industry Volume (K Tons), by End-user Industry 2025 & 2033
- Figure 29: North America Prepreg Industry Revenue Share (%), by End-user Industry 2025 & 2033
- Figure 30: North America Prepreg Industry Volume Share (%), by End-user Industry 2025 & 2033
- Figure 31: North America Prepreg Industry Revenue (billion), by Country 2025 & 2033
- Figure 32: North America Prepreg Industry Volume (K Tons), by Country 2025 & 2033
- Figure 33: North America Prepreg Industry Revenue Share (%), by Country 2025 & 2033
- Figure 34: North America Prepreg Industry Volume Share (%), by Country 2025 & 2033
- Figure 35: Europe Prepreg Industry Revenue (billion), by Resin Type 2025 & 2033
- Figure 36: Europe Prepreg Industry Volume (K Tons), by Resin Type 2025 & 2033
- Figure 37: Europe Prepreg Industry Revenue Share (%), by Resin Type 2025 & 2033
- Figure 38: Europe Prepreg Industry Volume Share (%), by Resin Type 2025 & 2033
- Figure 39: Europe Prepreg Industry Revenue (billion), by Fiber Type 2025 & 2033
- Figure 40: Europe Prepreg Industry Volume (K Tons), by Fiber Type 2025 & 2033
- Figure 41: Europe Prepreg Industry Revenue Share (%), by Fiber Type 2025 & 2033
- Figure 42: Europe Prepreg Industry Volume Share (%), by Fiber Type 2025 & 2033
- Figure 43: Europe Prepreg Industry Revenue (billion), by End-user Industry 2025 & 2033
- Figure 44: Europe Prepreg Industry Volume (K Tons), by End-user Industry 2025 & 2033
- Figure 45: Europe Prepreg Industry Revenue Share (%), by End-user Industry 2025 & 2033
- Figure 46: Europe Prepreg Industry Volume Share (%), by End-user Industry 2025 & 2033
- Figure 47: Europe Prepreg Industry Revenue (billion), by Country 2025 & 2033
- Figure 48: Europe Prepreg Industry Volume (K Tons), by Country 2025 & 2033
- Figure 49: Europe Prepreg Industry Revenue Share (%), by Country 2025 & 2033
- Figure 50: Europe Prepreg Industry Volume Share (%), by Country 2025 & 2033
- Figure 51: South America Prepreg Industry Revenue (billion), by Resin Type 2025 & 2033
- Figure 52: South America Prepreg Industry Volume (K Tons), by Resin Type 2025 & 2033
- Figure 53: South America Prepreg Industry Revenue Share (%), by Resin Type 2025 & 2033
- Figure 54: South America Prepreg Industry Volume Share (%), by Resin Type 2025 & 2033
- Figure 55: South America Prepreg Industry Revenue (billion), by Fiber Type 2025 & 2033
- Figure 56: South America Prepreg Industry Volume (K Tons), by Fiber Type 2025 & 2033
- Figure 57: South America Prepreg Industry Revenue Share (%), by Fiber Type 2025 & 2033
- Figure 58: South America Prepreg Industry Volume Share (%), by Fiber Type 2025 & 2033
- Figure 59: South America Prepreg Industry Revenue (billion), by End-user Industry 2025 & 2033
- Figure 60: South America Prepreg Industry Volume (K Tons), by End-user Industry 2025 & 2033
- Figure 61: South America Prepreg Industry Revenue Share (%), by End-user Industry 2025 & 2033
- Figure 62: South America Prepreg Industry Volume Share (%), by End-user Industry 2025 & 2033
- Figure 63: South America Prepreg Industry Revenue (billion), by Country 2025 & 2033
- Figure 64: South America Prepreg Industry Volume (K Tons), by Country 2025 & 2033
- Figure 65: South America Prepreg Industry Revenue Share (%), by Country 2025 & 2033
- Figure 66: South America Prepreg Industry Volume Share (%), by Country 2025 & 2033
- Figure 67: Middle East Prepreg Industry Revenue (billion), by Resin Type 2025 & 2033
- Figure 68: Middle East Prepreg Industry Volume (K Tons), by Resin Type 2025 & 2033
- Figure 69: Middle East Prepreg Industry Revenue Share (%), by Resin Type 2025 & 2033
- Figure 70: Middle East Prepreg Industry Volume Share (%), by Resin Type 2025 & 2033
- Figure 71: Middle East Prepreg Industry Revenue (billion), by Fiber Type 2025 & 2033
- Figure 72: Middle East Prepreg Industry Volume (K Tons), by Fiber Type 2025 & 2033
- Figure 73: Middle East Prepreg Industry Revenue Share (%), by Fiber Type 2025 & 2033
- Figure 74: Middle East Prepreg Industry Volume Share (%), by Fiber Type 2025 & 2033
- Figure 75: Middle East Prepreg Industry Revenue (billion), by End-user Industry 2025 & 2033
- Figure 76: Middle East Prepreg Industry Volume (K Tons), by End-user Industry 2025 & 2033
- Figure 77: Middle East Prepreg Industry Revenue Share (%), by End-user Industry 2025 & 2033
- Figure 78: Middle East Prepreg Industry Volume Share (%), by End-user Industry 2025 & 2033
- Figure 79: Middle East Prepreg Industry Revenue (billion), by Country 2025 & 2033
- Figure 80: Middle East Prepreg Industry Volume (K Tons), by Country 2025 & 2033
- Figure 81: Middle East Prepreg Industry Revenue Share (%), by Country 2025 & 2033
- Figure 82: Middle East Prepreg Industry Volume Share (%), by Country 2025 & 2033
- Figure 83: Saudi Arabia Prepreg Industry Revenue (billion), by Resin Type 2025 & 2033
- Figure 84: Saudi Arabia Prepreg Industry Volume (K Tons), by Resin Type 2025 & 2033
- Figure 85: Saudi Arabia Prepreg Industry Revenue Share (%), by Resin Type 2025 & 2033
- Figure 86: Saudi Arabia Prepreg Industry Volume Share (%), by Resin Type 2025 & 2033
- Figure 87: Saudi Arabia Prepreg Industry Revenue (billion), by Fiber Type 2025 & 2033
- Figure 88: Saudi Arabia Prepreg Industry Volume (K Tons), by Fiber Type 2025 & 2033
- Figure 89: Saudi Arabia Prepreg Industry Revenue Share (%), by Fiber Type 2025 & 2033
- Figure 90: Saudi Arabia Prepreg Industry Volume Share (%), by Fiber Type 2025 & 2033
- Figure 91: Saudi Arabia Prepreg Industry Revenue (billion), by End-user Industry 2025 & 2033
- Figure 92: Saudi Arabia Prepreg Industry Volume (K Tons), by End-user Industry 2025 & 2033
- Figure 93: Saudi Arabia Prepreg Industry Revenue Share (%), by End-user Industry 2025 & 2033
- Figure 94: Saudi Arabia Prepreg Industry Volume Share (%), by End-user Industry 2025 & 2033
- Figure 95: Saudi Arabia Prepreg Industry Revenue (billion), by Country 2025 & 2033
- Figure 96: Saudi Arabia Prepreg Industry Volume (K Tons), by Country 2025 & 2033
- Figure 97: Saudi Arabia Prepreg Industry Revenue Share (%), by Country 2025 & 2033
- Figure 98: Saudi Arabia Prepreg Industry Volume Share (%), by Country 2025 & 2033
List of Tables
- Table 1: Global Prepreg Industry Revenue billion Forecast, by Resin Type 2020 & 2033
- Table 2: Global Prepreg Industry Volume K Tons Forecast, by Resin Type 2020 & 2033
- Table 3: Global Prepreg Industry Revenue billion Forecast, by Fiber Type 2020 & 2033
- Table 4: Global Prepreg Industry Volume K Tons Forecast, by Fiber Type 2020 & 2033
- Table 5: Global Prepreg Industry Revenue billion Forecast, by End-user Industry 2020 & 2033
- Table 6: Global Prepreg Industry Volume K Tons Forecast, by End-user Industry 2020 & 2033
- Table 7: Global Prepreg Industry Revenue billion Forecast, by Region 2020 & 2033
- Table 8: Global Prepreg Industry Volume K Tons Forecast, by Region 2020 & 2033
- Table 9: Global Prepreg Industry Revenue billion Forecast, by Resin Type 2020 & 2033
- Table 10: Global Prepreg Industry Volume K Tons Forecast, by Resin Type 2020 & 2033
- Table 11: Global Prepreg Industry Revenue billion Forecast, by Fiber Type 2020 & 2033
- Table 12: Global Prepreg Industry Volume K Tons Forecast, by Fiber Type 2020 & 2033
- Table 13: Global Prepreg Industry Revenue billion Forecast, by End-user Industry 2020 & 2033
- Table 14: Global Prepreg Industry Volume K Tons Forecast, by End-user Industry 2020 & 2033
- Table 15: Global Prepreg Industry Revenue billion Forecast, by Country 2020 & 2033
- Table 16: Global Prepreg Industry Volume K Tons Forecast, by Country 2020 & 2033
- Table 17: China Prepreg Industry Revenue (billion) Forecast, by Application 2020 & 2033
- Table 18: China Prepreg Industry Volume (K Tons) Forecast, by Application 2020 & 2033
- Table 19: India Prepreg Industry Revenue (billion) Forecast, by Application 2020 & 2033
- Table 20: India Prepreg Industry Volume (K Tons) Forecast, by Application 2020 & 2033
- Table 21: Japan Prepreg Industry Revenue (billion) Forecast, by Application 2020 & 2033
- Table 22: Japan Prepreg Industry Volume (K Tons) Forecast, by Application 2020 & 2033
- Table 23: South Korea Prepreg Industry Revenue (billion) Forecast, by Application 2020 & 2033
- Table 24: South Korea Prepreg Industry Volume (K Tons) Forecast, by Application 2020 & 2033
- Table 25: Rest of Asia Pacific Prepreg Industry Revenue (billion) Forecast, by Application 2020 & 2033
- Table 26: Rest of Asia Pacific Prepreg Industry Volume (K Tons) Forecast, by Application 2020 & 2033
- Table 27: Global Prepreg Industry Revenue billion Forecast, by Resin Type 2020 & 2033
- Table 28: Global Prepreg Industry Volume K Tons Forecast, by Resin Type 2020 & 2033
- Table 29: Global Prepreg Industry Revenue billion Forecast, by Fiber Type 2020 & 2033
- Table 30: Global Prepreg Industry Volume K Tons Forecast, by Fiber Type 2020 & 2033
- Table 31: Global Prepreg Industry Revenue billion Forecast, by End-user Industry 2020 & 2033
- Table 32: Global Prepreg Industry Volume K Tons Forecast, by End-user Industry 2020 & 2033
- Table 33: Global Prepreg Industry Revenue billion Forecast, by Country 2020 & 2033
- Table 34: Global Prepreg Industry Volume K Tons Forecast, by Country 2020 & 2033
- Table 35: United States Prepreg Industry Revenue (billion) Forecast, by Application 2020 & 2033
- Table 36: United States Prepreg Industry Volume (K Tons) Forecast, by Application 2020 & 2033
- Table 37: Canada Prepreg Industry Revenue (billion) Forecast, by Application 2020 & 2033
- Table 38: Canada Prepreg Industry Volume (K Tons) Forecast, by Application 2020 & 2033
- Table 39: Mexico Prepreg Industry Revenue (billion) Forecast, by Application 2020 & 2033
- Table 40: Mexico Prepreg Industry Volume (K Tons) Forecast, by Application 2020 & 2033
- Table 41: Global Prepreg Industry Revenue billion Forecast, by Resin Type 2020 & 2033
- Table 42: Global Prepreg Industry Volume K Tons Forecast, by Resin Type 2020 & 2033
- Table 43: Global Prepreg Industry Revenue billion Forecast, by Fiber Type 2020 & 2033
- Table 44: Global Prepreg Industry Volume K Tons Forecast, by Fiber Type 2020 & 2033
- Table 45: Global Prepreg Industry Revenue billion Forecast, by End-user Industry 2020 & 2033
- Table 46: Global Prepreg Industry Volume K Tons Forecast, by End-user Industry 2020 & 2033
- Table 47: Global Prepreg Industry Revenue billion Forecast, by Country 2020 & 2033
- Table 48: Global Prepreg Industry Volume K Tons Forecast, by Country 2020 & 2033
- Table 49: Germany Prepreg Industry Revenue (billion) Forecast, by Application 2020 & 2033
- Table 50: Germany Prepreg Industry Volume (K Tons) Forecast, by Application 2020 & 2033
- Table 51: United Kingdom Prepreg Industry Revenue (billion) Forecast, by Application 2020 & 2033
- Table 52: United Kingdom Prepreg Industry Volume (K Tons) Forecast, by Application 2020 & 2033
- Table 53: Italy Prepreg Industry Revenue (billion) Forecast, by Application 2020 & 2033
- Table 54: Italy Prepreg Industry Volume (K Tons) Forecast, by Application 2020 & 2033
- Table 55: France Prepreg Industry Revenue (billion) Forecast, by Application 2020 & 2033
- Table 56: France Prepreg Industry Volume (K Tons) Forecast, by Application 2020 & 2033
- Table 57: Rest of Europe Prepreg Industry Revenue (billion) Forecast, by Application 2020 & 2033
- Table 58: Rest of Europe Prepreg Industry Volume (K Tons) Forecast, by Application 2020 & 2033
- Table 59: Global Prepreg Industry Revenue billion Forecast, by Resin Type 2020 & 2033
- Table 60: Global Prepreg Industry Volume K Tons Forecast, by Resin Type 2020 & 2033
- Table 61: Global Prepreg Industry Revenue billion Forecast, by Fiber Type 2020 & 2033
- Table 62: Global Prepreg Industry Volume K Tons Forecast, by Fiber Type 2020 & 2033
- Table 63: Global Prepreg Industry Revenue billion Forecast, by End-user Industry 2020 & 2033
- Table 64: Global Prepreg Industry Volume K Tons Forecast, by End-user Industry 2020 & 2033
- Table 65: Global Prepreg Industry Revenue billion Forecast, by Country 2020 & 2033
- Table 66: Global Prepreg Industry Volume K Tons Forecast, by Country 2020 & 2033
- Table 67: Brazil Prepreg Industry Revenue (billion) Forecast, by Application 2020 & 2033
- Table 68: Brazil Prepreg Industry Volume (K Tons) Forecast, by Application 2020 & 2033
- Table 69: Argentina Prepreg Industry Revenue (billion) Forecast, by Application 2020 & 2033
- Table 70: Argentina Prepreg Industry Volume (K Tons) Forecast, by Application 2020 & 2033
- Table 71: Rest of South America Prepreg Industry Revenue (billion) Forecast, by Application 2020 & 2033
- Table 72: Rest of South America Prepreg Industry Volume (K Tons) Forecast, by Application 2020 & 2033
- Table 73: Global Prepreg Industry Revenue billion Forecast, by Resin Type 2020 & 2033
- Table 74: Global Prepreg Industry Volume K Tons Forecast, by Resin Type 2020 & 2033
- Table 75: Global Prepreg Industry Revenue billion Forecast, by Fiber Type 2020 & 2033
- Table 76: Global Prepreg Industry Volume K Tons Forecast, by Fiber Type 2020 & 2033
- Table 77: Global Prepreg Industry Revenue billion Forecast, by End-user Industry 2020 & 2033
- Table 78: Global Prepreg Industry Volume K Tons Forecast, by End-user Industry 2020 & 2033
- Table 79: Global Prepreg Industry Revenue billion Forecast, by Country 2020 & 2033
- Table 80: Global Prepreg Industry Volume K Tons Forecast, by Country 2020 & 2033
- Table 81: Global Prepreg Industry Revenue billion Forecast, by Resin Type 2020 & 2033
- Table 82: Global Prepreg Industry Volume K Tons Forecast, by Resin Type 2020 & 2033
- Table 83: Global Prepreg Industry Revenue billion Forecast, by Fiber Type 2020 & 2033
- Table 84: Global Prepreg Industry Volume K Tons Forecast, by Fiber Type 2020 & 2033
- Table 85: Global Prepreg Industry Revenue billion Forecast, by End-user Industry 2020 & 2033
- Table 86: Global Prepreg Industry Volume K Tons Forecast, by End-user Industry 2020 & 2033
- Table 87: Global Prepreg Industry Revenue billion Forecast, by Country 2020 & 2033
- Table 88: Global Prepreg Industry Volume K Tons Forecast, by Country 2020 & 2033
- Table 89: South Africa Prepreg Industry Revenue (billion) Forecast, by Application 2020 & 2033
- Table 90: South Africa Prepreg Industry Volume (K Tons) Forecast, by Application 2020 & 2033
- Table 91: Rest of Middle East Prepreg Industry Revenue (billion) Forecast, by Application 2020 & 2033
- Table 92: Rest of Middle East Prepreg Industry Volume (K Tons) Forecast, by Application 2020 & 2033
Frequently Asked Questions
1. What is the projected Compound Annual Growth Rate (CAGR) of the Prepreg Industry?
The projected CAGR is approximately 6.92%.
2. Which companies are prominent players in the Prepreg Industry?
Key companies in the market include SGL Carbon, Isola Group, Solvay, Composite Resources Inc, Toray Industries Inc, Sunrez Corporation, Ventec International Group, Axiom Materials, Yokohama Aerospace America Inc, Renegade Materials Corporation, Park Eletrochemical Corp, Mitsubishi Chemical Carbon Fiber and Composites Inc, Hexcel Corporation, Koninklijke Ten Cate BV, Gurit, TEIJIN LIMITED, Zoltek*List Not Exhaustive.
3. What are the main segments of the Prepreg Industry?
The market segments include Resin Type, Fiber Type, End-user Industry.
4. Can you provide details about the market size?
The market size is estimated to be USD 13.2 billion as of 2022.
5. What are some drivers contributing to market growth?
Growing Demand from the Aerospace and Defense Sector; Growing Demand from the Wind Sector; Increased Adoption of Carbon Prepreg.
6. What are the notable trends driving market growth?
Aerospace and Defense Industry to Drive the Market.
7. Are there any restraints impacting market growth?
Autoclave and Maintenance Constraints.
8. Can you provide examples of recent developments in the market?
N/A
9. What pricing options are available for accessing the report?
Pricing options include single-user, multi-user, and enterprise licenses priced at USD 4750, USD 5250, and USD 8750 respectively.
10. Is the market size provided in terms of value or volume?
The market size is provided in terms of value, measured in billion and volume, measured in K Tons.
11. Are there any specific market keywords associated with the report?
Yes, the market keyword associated with the report is "Prepreg Industry," which aids in identifying and referencing the specific market segment covered.
12. How do I determine which pricing option suits my needs best?
The pricing options vary based on user requirements and access needs. Individual users may opt for single-user licenses, while businesses requiring broader access may choose multi-user or enterprise licenses for cost-effective access to the report.
13. Are there any additional resources or data provided in the Prepreg Industry report?
While the report offers comprehensive insights, it's advisable to review the specific contents or supplementary materials provided to ascertain if additional resources or data are available.
14. How can I stay updated on further developments or reports in the Prepreg Industry?
To stay informed about further developments, trends, and reports in the Prepreg Industry, consider subscribing to industry newsletters, following relevant companies and organizations, or regularly checking reputable industry news sources and publications.
Methodology
Step 1 - Identification of Relevant Samples Size from Population Database


Step 2 - Approaches for Defining Global Market Size (Value, Volume* & Price*)

Note*: In applicable scenarios
Step 3 - Data Sources
Primary Research
- Web Analytics
- Survey Reports
- Research Institute
- Latest Research Reports
- Opinion Leaders
Secondary Research
- Annual Reports
- White Paper
- Latest Press Release
- Industry Association
- Paid Database
- Investor Presentations

Step 4 - Data Triangulation
Involves using different sources of information in order to increase the validity of a study
These sources are likely to be stakeholders in a program - participants, other researchers, program staff, other community members, and so on.
Then we put all data in single framework & apply various statistical tools to find out the dynamic on the market.
During the analysis stage, feedback from the stakeholder groups would be compared to determine areas of agreement as well as areas of divergence