

Key Insights
The global PropTech market is poised for significant expansion, projected to reach approximately \$50,000 million by 2025, with a robust Compound Annual Growth Rate (CAGR) of around 18% anticipated over the forecast period (2025-2033). This growth is fueled by the increasing adoption of digital solutions across the real estate value chain, from property management and transactions to construction and investment. The "Smart Cities" initiative, driving demand for intelligent infrastructure and streamlined urban living, is a pivotal catalyst. Furthermore, the burgeoning popularity of online real estate platforms and virtual tours, accelerated by recent global events, has democratized property access and enhanced user experience, thereby widening the market's reach. The demand for integrated property management software, encompassing everything from tenant screening and rent collection to maintenance scheduling and financial reporting, is a key driver, particularly for large enterprises seeking operational efficiency. Simultaneously, the growing accessibility and affordability of cloud-based solutions are empowering small and medium enterprises (SMEs) to leverage advanced PropTech tools, leveling the playing field.

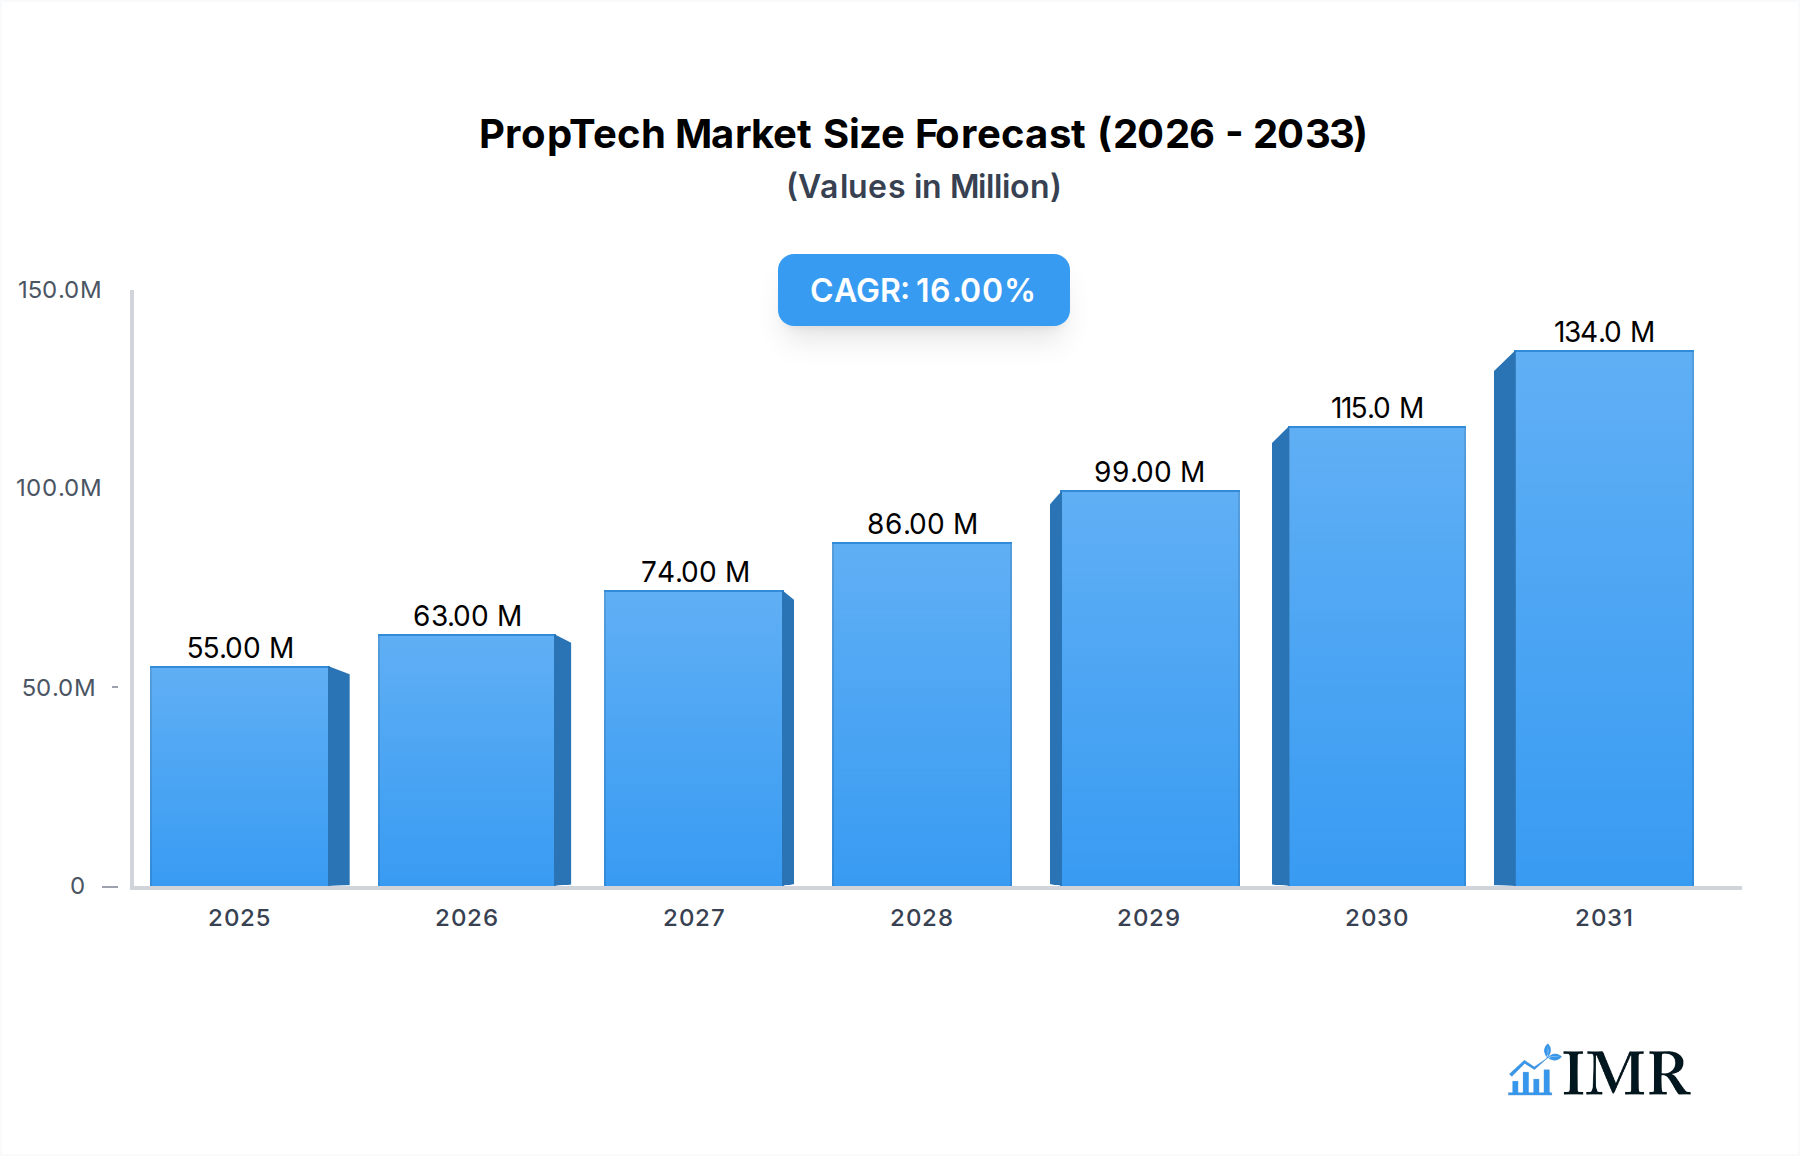
PropTech Market Size (In Million)
The PropTech landscape is characterized by innovation and diversification. Trends such as the integration of Artificial Intelligence (AI) for predictive analytics in property valuation and investment, the use of blockchain for secure and transparent property transactions, and the rise of the Internet of Things (IoT) for smart building management are reshaping how properties are bought, sold, managed, and experienced. The increasing emphasis on sustainability and energy efficiency in buildings is also spurring the adoption of PropTech solutions that monitor and optimize resource consumption. While the market presents immense opportunities, certain restraints need consideration. Data security and privacy concerns, alongside the initial investment costs associated with implementing advanced technologies, can pose challenges. Moreover, the fragmented nature of the real estate industry and resistance to change from traditional stakeholders may slow down the pace of adoption in some segments. However, the overwhelming benefits of enhanced efficiency, improved decision-making, and superior customer engagement are expected to drive sustained growth across all segments and regions.
PropTech Company Market Share
PropTech Market Report: Unlocking the Future of Real Estate Technology
This comprehensive PropTech market report offers an in-depth analysis of the rapidly evolving real estate technology landscape. Examining market dynamics, growth trends, regional dominance, product innovations, key drivers, emerging opportunities, and strategic outlook, this report equips industry professionals with the actionable intelligence needed to navigate and capitalize on the future of real estate. This study covers the Study Period: 2019–2033, with Base Year: 2025, Estimated Year: 2025, and a Forecast Period: 2025–2033, alongside a thorough review of the Historical Period: 2019–2024. We explore the intricate interplay between parent and child markets, providing granular insights into segments like Application: Large Enterprises, Small and Medium Enterprises, and Types: On-premise, Cloud-based.
PropTech Market Dynamics & Structure
The PropTech market is characterized by dynamic growth driven by technological innovation and evolving consumer demands. Market concentration varies, with some areas dominated by a few key players while others exhibit a more fragmented landscape. Technological innovation is the primary engine, fueled by advancements in AI, IoT, blockchain, and data analytics, enabling more efficient property management, transactions, and investments. Regulatory frameworks are increasingly adapting to accommodate digital solutions, fostering trust and security. Competitive product substitutes are emerging rapidly, pushing companies to differentiate through superior functionality and user experience. End-user demographics are shifting, with a growing adoption of digital platforms by both individual buyers/renters and large institutional investors. Mergers and acquisitions (M&A) are a significant trend, as larger companies acquire innovative startups to expand their service offerings and market reach.
- Market Concentration: Moderately concentrated, with a growing number of specialized niche players alongside established giants.
- Technological Innovation Drivers: AI-powered property valuation, IoT for smart building management, blockchain for secure transactions, and big data analytics for market insights.
- Regulatory Frameworks: Evolving to support digital signatures, online property listings, and data privacy in real estate transactions.
- Competitive Product Substitutes: Increasing competition from AI-driven recommendation engines, virtual tour platforms, and automated property management software.
- End-User Demographics: Growing adoption by millennials and Gen Z for property search and rental, and by institutional investors for portfolio management and analytics.
- M&A Trends: Active M&A landscape, with strategic acquisitions aimed at consolidating market share and acquiring innovative technologies. For instance, the acquisition volume of PropTech startups reached approximately $2,500 million in 2023, indicating significant consolidation.
PropTech Growth Trends & Insights
The PropTech market is experiencing robust and sustained growth, projected to reach an estimated market size of $55,000 million in 2025 and expand to an impressive $120,000 million by 2033, exhibiting a Compound Annual Growth Rate (CAGR) of approximately 10.2% during the forecast period. This expansion is driven by an increasing rate of adoption of digital solutions across the real estate value chain, from property search and acquisition to management and investment. Technological disruptions are fundamentally reshaping traditional real estate practices, leading to enhanced efficiency, transparency, and accessibility for all stakeholders. Consumer behavior shifts are also pivotal, with a growing preference for seamless online experiences, data-driven decision-making, and personalized services in their property journeys. The integration of AI for predictive analytics and property valuation is gaining traction, while IoT devices are revolutionizing property management by enabling remote monitoring and control of building systems, leading to cost savings and improved tenant satisfaction. The rise of virtual and augmented reality technologies is transforming property tours, allowing potential buyers and renters to experience properties remotely with unprecedented realism. Furthermore, the increasing digitization of real estate transactions, including online contracting and payment systems, is streamlining processes and reducing transaction times. The demand for cloud-based solutions continues to surge, offering scalability, flexibility, and cost-effectiveness for businesses of all sizes. The increasing focus on sustainability and green building initiatives is also creating new avenues for PropTech innovation, with technologies that optimize energy consumption and reduce environmental impact. The market penetration of these digital solutions is rapidly increasing, moving beyond early adopters to mainstream adoption across residential, commercial, and industrial real estate sectors. The shift from on-premise solutions to cloud-based platforms is a significant trend, driven by the need for greater agility and accessibility. The overall market penetration is estimated to have grown from 35% in 2019 to 60% in 2024, with further acceleration anticipated.
Dominant Regions, Countries, or Segments in PropTech
The Cloud-based segment is emerging as the dominant force in the PropTech market, driven by its inherent scalability, flexibility, and cost-effectiveness, making it an attractive proposition for both Large Enterprises and Small and Medium Enterprises. This segment is projected to capture a substantial market share of approximately 65% by 2025 and grow at an accelerated pace throughout the forecast period. The widespread adoption of cloud infrastructure by real estate firms of all sizes is a key driver. It allows for seamless access to data and applications from anywhere, facilitating remote work and collaboration, which has become increasingly important in the modern business environment. Cloud-based solutions also offer robust security features and regular software updates, reducing the burden on in-house IT departments and ensuring compliance with evolving data protection regulations. For Large Enterprises, cloud solutions provide the necessary power for sophisticated analytics, AI-driven insights, and managing vast property portfolios. Companies like Zillow Group and Compass leverage cloud-based platforms to offer a wide array of services, from property listings and valuations to brokerage services. On the other hand, Small and Medium Enterprises benefit from the affordability and ease of deployment of cloud solutions, enabling them to compete effectively with larger players without significant upfront investments in hardware and software. Platforms like Guesty and ManageCasa offer cloud-based property management tools that are tailored to the needs of smaller businesses. The market share for cloud-based PropTech solutions is estimated to have been around $25,000 million in 2024 and is expected to more than double by 2033.
- Dominant Segment (Type): Cloud-based
- Key Drivers: Scalability, flexibility, cost-effectiveness, enhanced accessibility, robust security, ease of deployment, reduced IT overhead.
- Dominant Segment (Application): Large Enterprises
- Key Drivers: Need for sophisticated analytics, portfolio management, AI-driven insights, large-scale data processing capabilities.
- Market Share (Large Enterprises, Cloud-based): Estimated at 40% of the total cloud-based market in 2025.
- Growth Potential: Significant, driven by digital transformation initiatives and the demand for advanced PropTech solutions.
- Key Drivers for Cloud Dominance:
- Digital Transformation: Real estate companies are actively digitizing their operations, with cloud being the foundational technology.
- Remote Work Enablement: Cloud platforms facilitate seamless remote operations and collaboration among dispersed teams.
- Data Analytics & AI Integration: Cloud environments are crucial for processing the vast amounts of data required for AI and advanced analytics in real estate.
- Cost Efficiency: Pay-as-you-go models and reduced infrastructure costs make cloud solutions financially attractive.
PropTech Product Landscape
The PropTech product landscape is marked by a surge in innovative solutions designed to streamline every facet of the real estate industry. Product innovations span across property search and discovery platforms, advanced property management software, AI-powered valuation tools, and immersive virtual tour technologies. Companies like Zumper are enhancing their platforms with sophisticated search filters and AI-driven recommendations to improve user experience for renters and buyers. OpenDoor Technologies continues to redefine the iBuying model with its technology-driven approach to property transactions. Reonomy offers powerful data aggregation and analytics for commercial real estate, empowering investors and brokers with actionable insights. Guesty provides a comprehensive cloud-based solution for short-term rental property management, automating key operational tasks. HoloBuilder is revolutionizing construction documentation with its 360° photo and video technology for site progress tracking. Zillow Group's broad ecosystem of tools caters to various stages of the homeownership journey, from searching and financing to selling. ManageCasa offers an integrated property management system for residential landlords. Ascendix Technologies provides CRM and business development tools tailored for real estate professionals. Compass is leveraging technology to empower its agents and enhance the client experience. NoBroker is disrupting the Indian real estate market by eliminating brokers and facilitating direct transactions. Rethink Solutions offers data-driven insights for real estate investment. Anyone Home provides lead management and communication tools for property managers. Knotel offers flexible office space solutions powered by technology. Cloud Kitchens, while not directly a PropTech, leverages real estate technology for its distributed network of culinary spaces. These products are characterized by their focus on data intelligence, automation, user-centric design, and seamless integration capabilities, driving performance metrics such as transaction speed, operational efficiency, and customer satisfaction.
Key Drivers, Barriers & Challenges in PropTech
Key Drivers: The PropTech market is propelled by a confluence of technological advancements, economic imperatives, and supportive policy shifts. Key drivers include the relentless pace of digital transformation across industries, demanding more efficient and transparent real estate processes. The increasing demand for data-driven decision-making fuels the adoption of AI and analytics platforms, enabling better investment strategies and property management. Government initiatives promoting smart cities and sustainable development also create a favorable environment for PropTech innovations. The growing adoption of remote work and the rise of the gig economy are further boosting demand for flexible and technologically adept real estate solutions. For example, the global investment in PropTech reached an estimated $5,000 million in 2023, a testament to these driving forces.
Barriers & Challenges: Despite its growth, the PropTech sector faces significant barriers and challenges that can impede widespread adoption. Data security and privacy concerns remain paramount, with the sensitive nature of real estate transactions requiring robust protective measures. Regulatory hurdles and the often-slow pace of legal adaptation to new technologies can create friction. The high cost of implementing certain advanced technologies can be a barrier, especially for smaller businesses. Furthermore, resistance to change from traditional stakeholders and the need for significant workforce upskilling present ongoing challenges. Supply chain issues, particularly for hardware components in IoT devices, can also impact product availability and development timelines.
Emerging Opportunities in PropTech
Emerging opportunities in PropTech are abundant, driven by evolving consumer preferences and untapped market potential. The growing demand for sustainable and green buildings presents a significant avenue for PropTech solutions that focus on energy efficiency, smart waste management, and environmental impact tracking. The burgeoning co-living and co-working space market, amplified by the need for flexible and community-oriented living and working arrangements, offers substantial growth potential for integrated PropTech platforms that manage bookings, amenities, and community engagement. The metaverse and Web3 technologies are opening up entirely new frontiers for virtual real estate transactions, digital property ownership, and immersive property experiences. Personalized PropTech solutions, leveraging AI to tailor property recommendations, financial advice, and management services to individual user needs, are also gaining traction. The integration of PropTech with other emerging technologies, such as blockchain for fractional ownership and smart contracts, promises to further democratize real estate investment.
Growth Accelerators in the PropTech Industry
The PropTech industry's long-term growth is being significantly accelerated by several key factors. The continuous advancement and widespread adoption of Artificial Intelligence (AI) and Machine Learning (ML) are revolutionizing property valuation, predictive analytics, and personalized customer experiences. Strategic partnerships between technology providers, real estate firms, and financial institutions are fostering innovation and expanding market reach. For instance, collaborations between AI companies and mortgage lenders are streamlining the loan application process. The ongoing digitization of real estate transactions, including the development of more secure and efficient online platforms for buying, selling, and leasing, acts as a major growth accelerator. Furthermore, the increasing global focus on urban development and smart cities is driving demand for PropTech solutions that enhance urban living, optimize infrastructure management, and promote sustainability. The expansion into emerging markets with a burgeoning middle class and increasing real estate activity also presents substantial growth opportunities.
Key Players Shaping the PropTech Market
- eSelf AI
- VuHome.ai
- Structurely
- Ask the Agent
- EliseAI
- Placeform
- Loft47
- Matterport
- Soul Machines
- UneeQ
- Others
Notable Milestones in PropTech Sector
- 2019: Zumper acquires Apartment List's rental lead generation business, expanding its reach in the rental market.
- 2020: OpenDoor Technologies goes public via SPAC, marking a significant milestone for the iBuying sector.
- 2020: Guesty secures significant funding to enhance its vacation rental property management platform.
- 2021: HoloBuilder is acquired by Procore Technologies, integrating construction technology further.
- 2021: Compass's IPO brings a high-profile tech-focused brokerage into the public eye.
- 2022: Zillow Group launches new AI-powered tools for home buyers and sellers, enhancing its market intelligence.
- 2022: NoBroker raises substantial funding to fuel its expansion and introduce new services in India.
- 2023: Reonomy announces integration with CoStar Group's data platform, enhancing its commercial real estate analytics.
- 2023: ManageCasa introduces advanced AI features for property management automation.
- 2024 (Q1): Ascendix Technologies launches a new CRM module for commercial real estate brokers focused on deal management.
In-Depth PropTech Market Outlook
The future of the PropTech market is exceptionally promising, driven by sustained technological innovation and an ever-increasing demand for digital solutions in real estate. Growth accelerators such as the widespread adoption of AI and ML for predictive analytics and personalized services will continue to shape the industry. Strategic partnerships between technology developers, real estate agencies, and financial institutions will foster ecosystem growth and innovation. The ongoing digitization of real estate transactions, coupled with the expansion into emerging markets, is poised to unlock significant market potential. The market outlook points towards a future where PropTech is not merely an add-on but an integral component of the real estate value chain, creating more efficient, transparent, and accessible property markets globally.
PropTech Segmentation
- By Type
- ConTech
- Smart Real Estate
- Shared Economy Real Estate
- FinTech
- By Property Type
- Property Type
- Commercial Property
- By Deployment
- Cloud-Based
- On-Premises
- By End User
- Property Managers
- Real Estate Agents/Brokers
- Real Estate Investors
- Landlords
- Tenants
- Others
PropTech Segmentation By Geography
- 1. North America
- 1.1. United States
- 1.2. Canada
- 1.3. Mexico
- 2. South America
- 2.1. Brazil
- 2.2. Argentina
- 2.3. Rest of South America
- 3. Europe
- 3.1. United Kingdom
- 3.2. Germany
- 3.3. France
- 3.4. Italy
- 3.5. Spain
- 3.6. Russia
- 3.7. Benelux
- 3.8. Nordics
- 3.9. Rest of Europe
- 4. Middle East & Africa
- 4.1. Turkey
- 4.2. Israel
- 4.3. GCC
- 4.4. North Africa
- 4.5. South Africa
- 4.6. Rest of Middle East & Africa
- 5. Asia Pacific
- 5.1. China
- 5.2. India
- 5.3. Japan
- 5.4. South Korea
- 5.5. ASEAN
- 5.6. Oceania
- 5.7. Rest of Asia Pacific
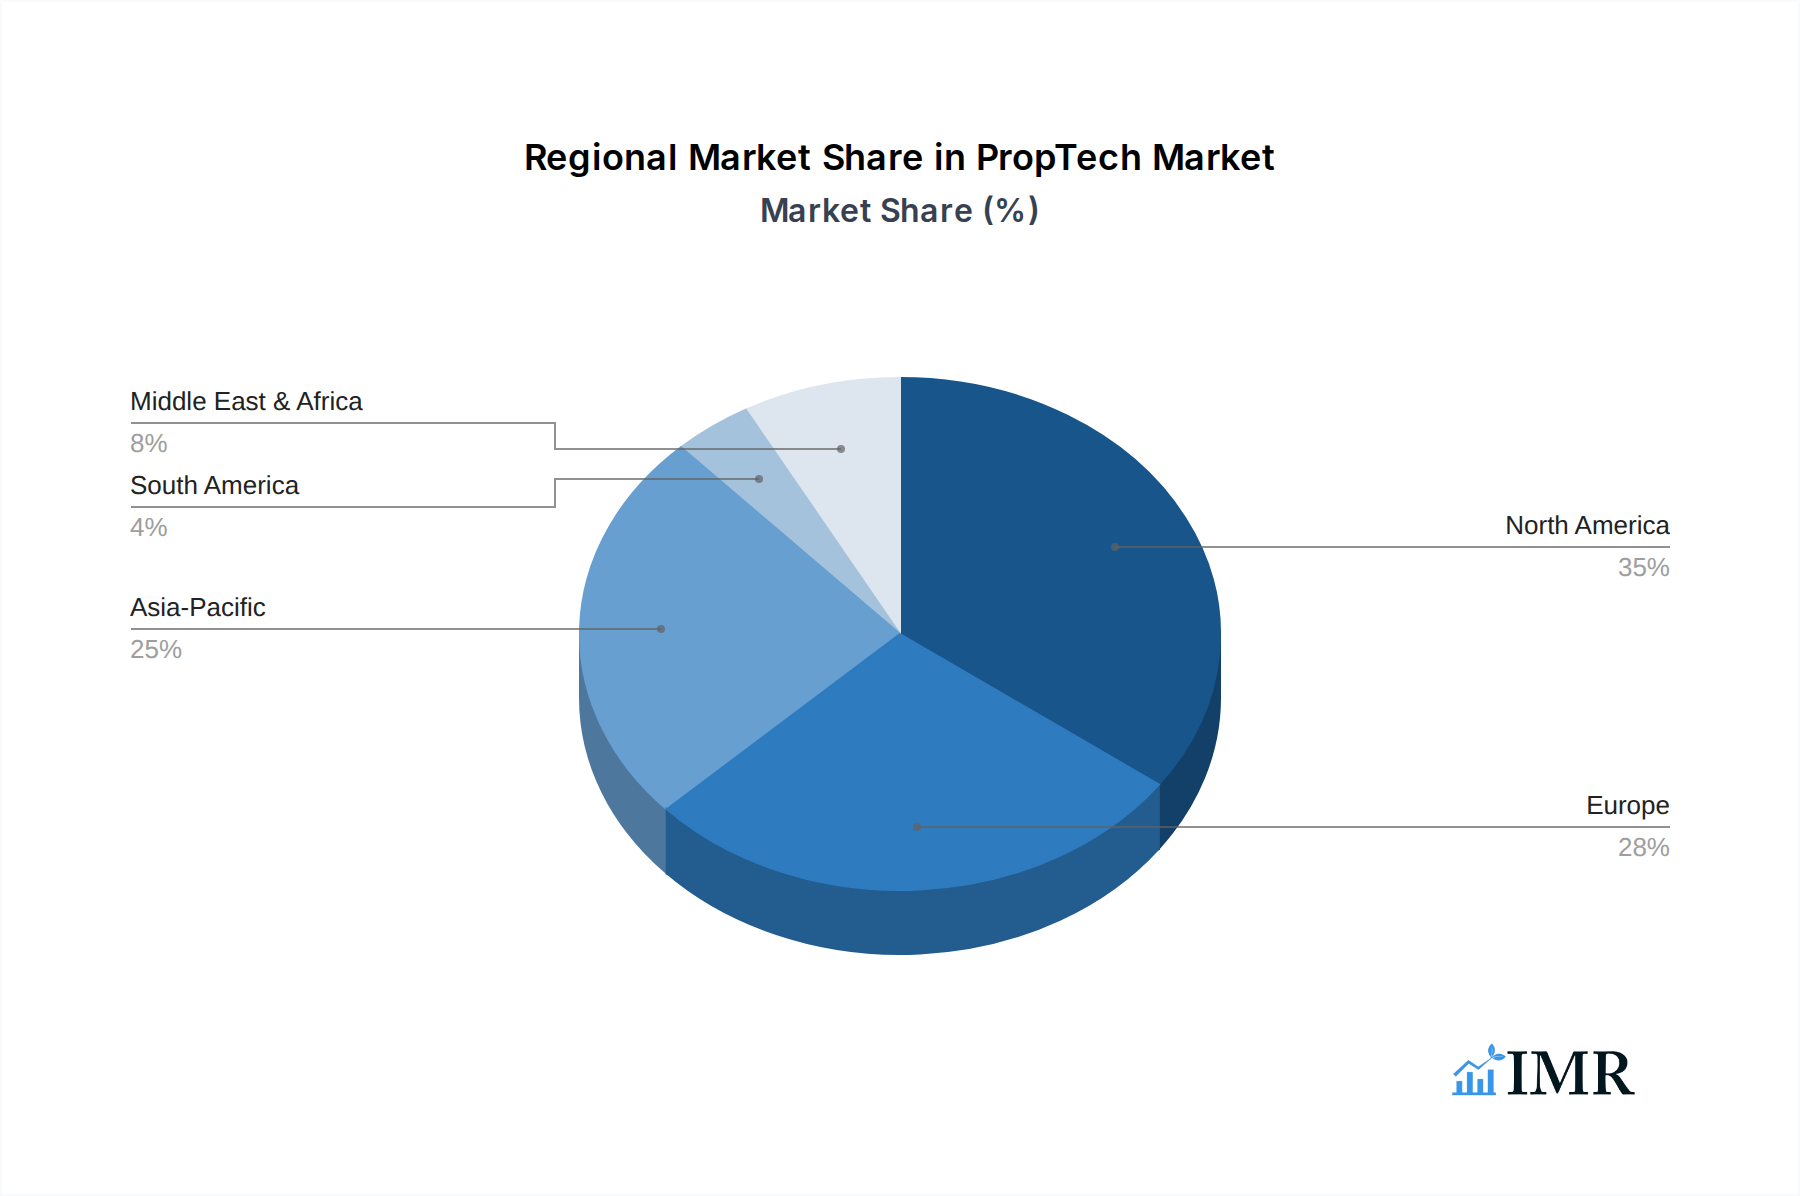
PropTech Regional Market Share
Geographic Coverage of PropTech
PropTech REPORT HIGHLIGHTS
| Aspects | Details |
|---|---|
| Study Period | 2020-2034 |
| Base Year | 2025 |
| Estimated Year | 2026 |
| Forecast Period | 2026-2034 |
| Historical Period | 2020-2025 |
| Growth Rate | CAGR of 16.1% from 2020-2034 |
| Segmentation |
|
Table of Contents
- 1. Introduction
- 1.1. Research Scope
- 1.2. Market Segmentation
- 1.3. Research Objective
- 1.4. Definitions and Assumptions
- 2. Executive Summary
- 2.1. Market Snapshot
- 3. Market Dynamics
- 3.1. Market Drivers
- 3.2. Market Restrains
- 3.3. Market Trends
- 3.4. Market Opportunities
- 4. Market Factor Analysis
- 4.1. Porters Five Forces
- 4.1.1. Bargaining Power of Suppliers
- 4.1.2. Bargaining Power of Buyers
- 4.1.3. Threat of New Entrants
- 4.1.4. Threat of Substitutes
- 4.1.5. Competitive Rivalry
- 4.2. PESTEL analysis
- 4.3. BCG Analysis
- 4.3.1. Stars (High Growth, High Market Share)
- 4.3.2. Cash Cows (Low Growth, High Market Share)
- 4.3.3. Question Mark (High Growth, Low Market Share)
- 4.3.4. Dogs (Low Growth, Low Market Share)
- 4.4. Ansoff Matrix Analysis
- 4.5. Supply Chain Analysis
- 4.6. Regulatory Landscape
- 4.7. Current Market Potential and Opportunity Assessment (TAM–SAM–SOM Framework)
- 4.8. IMR Analyst Note
- 4.1. Porters Five Forces
- 5. Market Analysis, Insights and Forecast 2021-2033
- 5.1. Market Analysis, Insights and Forecast - by Type
- 5.1.1. ConTech
- 5.1.2. Smart Real Estate
- 5.1.3. Shared Economy Real Estate
- 5.1.4. FinTech
- 5.2. Market Analysis, Insights and Forecast - by Property Type
- 5.2.1. Residential Property
- 5.2.2. Commercial Property
- 5.3. Market Analysis, Insights and Forecast - by Deployment
- 5.3.1. Cloud-Based
- 5.3.2. On-Premises
- 5.4. Market Analysis, Insights and Forecast - by End User
- 5.4.1. Property Managers
- 5.4.2. Real Estate Agents/Brokers
- 5.4.3. Real Estate Investors
- 5.4.4. Landlords
- 5.4.5. Tenants
- 5.4.6. Others
- 5.5. Market Analysis, Insights and Forecast - by Region
- 5.5.1. North America
- 5.5.2. South America
- 5.5.3. Europe
- 5.5.4. Middle East & Africa
- 5.5.5. Asia Pacific
- 5.1. Market Analysis, Insights and Forecast - by Type
- 6. Global PropTech Analysis, Insights and Forecast, 2021-2033
- 6.1. Market Analysis, Insights and Forecast - by Type
- 6.1.1. ConTech
- 6.1.2. Smart Real Estate
- 6.1.3. Shared Economy Real Estate
- 6.1.4. FinTech
- 6.2. Market Analysis, Insights and Forecast - by Property Type
- 6.2.1. Residential Property
- 6.2.2. Commercial Property
- 6.3. Market Analysis, Insights and Forecast - by Deployment
- 6.3.1. Cloud-Based
- 6.3.2. On-Premises
- 6.4. Market Analysis, Insights and Forecast - by End User
- 6.4.1. Property Managers
- 6.4.2. Real Estate Agents/Brokers
- 6.4.3. Real Estate Investors
- 6.4.4. Landlords
- 6.4.5. Tenants
- 6.4.6. Others
- 6.1. Market Analysis, Insights and Forecast - by Type
- 7. North America PropTech Analysis, Insights and Forecast, 2020-2032
- 7.1. Market Analysis, Insights and Forecast - by Type
- 7.1.1. ConTech
- 7.1.2. Smart Real Estate
- 7.1.3. Shared Economy Real Estate
- 7.1.4. FinTech
- 7.2. Market Analysis, Insights and Forecast - by Property Type
- 7.2.1. Residential Property
- 7.2.2. Commercial Property
- 7.3. Market Analysis, Insights and Forecast - by Deployment
- 7.3.1. Cloud-Based
- 7.3.2. On-Premises
- 7.4. Market Analysis, Insights and Forecast - by End User
- 7.4.1. Property Managers
- 7.4.2. Real Estate Agents/Brokers
- 7.4.3. Real Estate Investors
- 7.4.4. Landlords
- 7.4.5. Tenants
- 7.4.6. Others
- 7.1. Market Analysis, Insights and Forecast - by Type
- 8. South America PropTech Analysis, Insights and Forecast, 2020-2032
- 8.1. Market Analysis, Insights and Forecast - by Type
- 8.1.1. ConTech
- 8.1.2. Smart Real Estate
- 8.1.3. Shared Economy Real Estate
- 8.1.4. FinTech
- 8.2. Market Analysis, Insights and Forecast - by Property Type
- 8.2.1. Residential Property
- 8.2.2. Commercial Property
- 8.3. Market Analysis, Insights and Forecast - by Deployment
- 8.3.1. Cloud-Based
- 8.3.2. On-Premises
- 8.4. Market Analysis, Insights and Forecast - by End User
- 8.4.1. Property Managers
- 8.4.2. Real Estate Agents/Brokers
- 8.4.3. Real Estate Investors
- 8.4.4. Landlords
- 8.4.5. Tenants
- 8.4.6. Others
- 8.1. Market Analysis, Insights and Forecast - by Type
- 9. Europe PropTech Analysis, Insights and Forecast, 2020-2032
- 9.1. Market Analysis, Insights and Forecast - by Type
- 9.1.1. ConTech
- 9.1.2. Smart Real Estate
- 9.1.3. Shared Economy Real Estate
- 9.1.4. FinTech
- 9.2. Market Analysis, Insights and Forecast - by Property Type
- 9.2.1. Residential Property
- 9.2.2. Commercial Property
- 9.3. Market Analysis, Insights and Forecast - by Deployment
- 9.3.1. Cloud-Based
- 9.3.2. On-Premises
- 9.4. Market Analysis, Insights and Forecast - by End User
- 9.4.1. Property Managers
- 9.4.2. Real Estate Agents/Brokers
- 9.4.3. Real Estate Investors
- 9.4.4. Landlords
- 9.4.5. Tenants
- 9.4.6. Others
- 9.1. Market Analysis, Insights and Forecast - by Type
- 10. Middle East & Africa PropTech Analysis, Insights and Forecast, 2020-2032
- 10.1. Market Analysis, Insights and Forecast - by Type
- 10.1.1. ConTech
- 10.1.2. Smart Real Estate
- 10.1.3. Shared Economy Real Estate
- 10.1.4. FinTech
- 10.2. Market Analysis, Insights and Forecast - by Property Type
- 10.2.1. Residential Property
- 10.2.2. Commercial Property
- 10.3. Market Analysis, Insights and Forecast - by Deployment
- 10.3.1. Cloud-Based
- 10.3.2. On-Premises
- 10.4. Market Analysis, Insights and Forecast - by End User
- 10.4.1. Property Managers
- 10.4.2. Real Estate Agents/Brokers
- 10.4.3. Real Estate Investors
- 10.4.4. Landlords
- 10.4.5. Tenants
- 10.4.6. Others
- 10.1. Market Analysis, Insights and Forecast - by Type
- 11. Asia Pacific PropTech Analysis, Insights and Forecast, 2020-2032
- 11.1. Market Analysis, Insights and Forecast - by Type
- 11.1.1. ConTech
- 11.1.2. Smart Real Estate
- 11.1.3. Shared Economy Real Estate
- 11.1.4. FinTech
- 11.2. Market Analysis, Insights and Forecast - by Property Type
- 11.2.1. Residential Property
- 11.2.2. Commercial Property
- 11.3. Market Analysis, Insights and Forecast - by Deployment
- 11.3.1. Cloud-Based
- 11.3.2. On-Premises
- 11.4. Market Analysis, Insights and Forecast - by End User
- 11.4.1. Property Managers
- 11.4.2. Real Estate Agents/Brokers
- 11.4.3. Real Estate Investors
- 11.4.4. Landlords
- 11.4.5. Tenants
- 11.4.6. Others
- 11.1. Market Analysis, Insights and Forecast - by Type
- 12. Competitive Analysis
- 12.1. Company Profiles
- 12.1.1 eSelf AI
- 12.1.1.1. Company Overview
- 12.1.1.2. Products
- 12.1.1.3. Company Financials
- 12.1.1.4. SWOT Analysis
- 12.1.2 VuHome.ai
- 12.1.2.1. Company Overview
- 12.1.2.2. Products
- 12.1.2.3. Company Financials
- 12.1.2.4. SWOT Analysis
- 12.1.3 Structurely
- 12.1.3.1. Company Overview
- 12.1.3.2. Products
- 12.1.3.3. Company Financials
- 12.1.3.4. SWOT Analysis
- 12.1.4 Ask the Agent
- 12.1.4.1. Company Overview
- 12.1.4.2. Products
- 12.1.4.3. Company Financials
- 12.1.4.4. SWOT Analysis
- 12.1.5 EliseAI
- 12.1.5.1. Company Overview
- 12.1.5.2. Products
- 12.1.5.3. Company Financials
- 12.1.5.4. SWOT Analysis
- 12.1.6 Placeform
- 12.1.6.1. Company Overview
- 12.1.6.2. Products
- 12.1.6.3. Company Financials
- 12.1.6.4. SWOT Analysis
- 12.1.7 Loft47
- 12.1.7.1. Company Overview
- 12.1.7.2. Products
- 12.1.7.3. Company Financials
- 12.1.7.4. SWOT Analysis
- 12.1.8 Matterport
- 12.1.8.1. Company Overview
- 12.1.8.2. Products
- 12.1.8.3. Company Financials
- 12.1.8.4. SWOT Analysis
- 12.1.9 Soul Machines
- 12.1.9.1. Company Overview
- 12.1.9.2. Products
- 12.1.9.3. Company Financials
- 12.1.9.4. SWOT Analysis
- 12.1.10 UneeQ
- 12.1.10.1. Company Overview
- 12.1.10.2. Products
- 12.1.10.3. Company Financials
- 12.1.10.4. SWOT Analysis
- 12.1.11 Others
- 12.1.11.1. Company Overview
- 12.1.11.2. Products
- 12.1.11.3. Company Financials
- 12.1.11.4. SWOT Analysis
- 12.1.1 eSelf AI
- 12.2. Market Entropy
- 12.2.1 Company's Key Areas Served
- 12.2.2 Recent Developments
- 12.3. Company Market Share Analysis 2025
- 12.3.1 Top 5 Companies Market Share Analysis
- 12.3.2 Top 3 Companies Market Share Analysis
- 12.4. List of Potential Customers
- 13. Research Methodology
List of Figures
- Figure 1: Global PropTech Revenue Breakdown (billion, %) by Region 2025 & 2033
- Figure 2: North America PropTech Revenue (billion), by Type 2025 & 2033
- Figure 3: North America PropTech Revenue Share (%), by Type 2025 & 2033
- Figure 4: North America PropTech Revenue (billion), by Property Type 2025 & 2033
- Figure 5: North America PropTech Revenue Share (%), by Property Type 2025 & 2033
- Figure 6: North America PropTech Revenue (billion), by Deployment 2025 & 2033
- Figure 7: North America PropTech Revenue Share (%), by Deployment 2025 & 2033
- Figure 8: North America PropTech Revenue (billion), by End User 2025 & 2033
- Figure 9: North America PropTech Revenue Share (%), by End User 2025 & 2033
- Figure 10: North America PropTech Revenue (billion), by Country 2025 & 2033
- Figure 11: North America PropTech Revenue Share (%), by Country 2025 & 2033
- Figure 12: South America PropTech Revenue (billion), by Type 2025 & 2033
- Figure 13: South America PropTech Revenue Share (%), by Type 2025 & 2033
- Figure 14: South America PropTech Revenue (billion), by Property Type 2025 & 2033
- Figure 15: South America PropTech Revenue Share (%), by Property Type 2025 & 2033
- Figure 16: South America PropTech Revenue (billion), by Deployment 2025 & 2033
- Figure 17: South America PropTech Revenue Share (%), by Deployment 2025 & 2033
- Figure 18: South America PropTech Revenue (billion), by End User 2025 & 2033
- Figure 19: South America PropTech Revenue Share (%), by End User 2025 & 2033
- Figure 20: South America PropTech Revenue (billion), by Country 2025 & 2033
- Figure 21: South America PropTech Revenue Share (%), by Country 2025 & 2033
- Figure 22: Europe PropTech Revenue (billion), by Type 2025 & 2033
- Figure 23: Europe PropTech Revenue Share (%), by Type 2025 & 2033
- Figure 24: Europe PropTech Revenue (billion), by Property Type 2025 & 2033
- Figure 25: Europe PropTech Revenue Share (%), by Property Type 2025 & 2033
- Figure 26: Europe PropTech Revenue (billion), by Deployment 2025 & 2033
- Figure 27: Europe PropTech Revenue Share (%), by Deployment 2025 & 2033
- Figure 28: Europe PropTech Revenue (billion), by End User 2025 & 2033
- Figure 29: Europe PropTech Revenue Share (%), by End User 2025 & 2033
- Figure 30: Europe PropTech Revenue (billion), by Country 2025 & 2033
- Figure 31: Europe PropTech Revenue Share (%), by Country 2025 & 2033
- Figure 32: Middle East & Africa PropTech Revenue (billion), by Type 2025 & 2033
- Figure 33: Middle East & Africa PropTech Revenue Share (%), by Type 2025 & 2033
- Figure 34: Middle East & Africa PropTech Revenue (billion), by Property Type 2025 & 2033
- Figure 35: Middle East & Africa PropTech Revenue Share (%), by Property Type 2025 & 2033
- Figure 36: Middle East & Africa PropTech Revenue (billion), by Deployment 2025 & 2033
- Figure 37: Middle East & Africa PropTech Revenue Share (%), by Deployment 2025 & 2033
- Figure 38: Middle East & Africa PropTech Revenue (billion), by End User 2025 & 2033
- Figure 39: Middle East & Africa PropTech Revenue Share (%), by End User 2025 & 2033
- Figure 40: Middle East & Africa PropTech Revenue (billion), by Country 2025 & 2033
- Figure 41: Middle East & Africa PropTech Revenue Share (%), by Country 2025 & 2033
- Figure 42: Asia Pacific PropTech Revenue (billion), by Type 2025 & 2033
- Figure 43: Asia Pacific PropTech Revenue Share (%), by Type 2025 & 2033
- Figure 44: Asia Pacific PropTech Revenue (billion), by Property Type 2025 & 2033
- Figure 45: Asia Pacific PropTech Revenue Share (%), by Property Type 2025 & 2033
- Figure 46: Asia Pacific PropTech Revenue (billion), by Deployment 2025 & 2033
- Figure 47: Asia Pacific PropTech Revenue Share (%), by Deployment 2025 & 2033
- Figure 48: Asia Pacific PropTech Revenue (billion), by End User 2025 & 2033
- Figure 49: Asia Pacific PropTech Revenue Share (%), by End User 2025 & 2033
- Figure 50: Asia Pacific PropTech Revenue (billion), by Country 2025 & 2033
- Figure 51: Asia Pacific PropTech Revenue Share (%), by Country 2025 & 2033
List of Tables
- Table 1: Global PropTech Revenue billion Forecast, by Type 2020 & 2033
- Table 2: Global PropTech Revenue billion Forecast, by Property Type 2020 & 2033
- Table 3: Global PropTech Revenue billion Forecast, by Deployment 2020 & 2033
- Table 4: Global PropTech Revenue billion Forecast, by End User 2020 & 2033
- Table 5: Global PropTech Revenue billion Forecast, by Region 2020 & 2033
- Table 6: Global PropTech Revenue billion Forecast, by Type 2020 & 2033
- Table 7: Global PropTech Revenue billion Forecast, by Property Type 2020 & 2033
- Table 8: Global PropTech Revenue billion Forecast, by Deployment 2020 & 2033
- Table 9: Global PropTech Revenue billion Forecast, by End User 2020 & 2033
- Table 10: Global PropTech Revenue billion Forecast, by Country 2020 & 2033
- Table 11: United States PropTech Revenue (billion) Forecast, by Application 2020 & 2033
- Table 12: Canada PropTech Revenue (billion) Forecast, by Application 2020 & 2033
- Table 13: Mexico PropTech Revenue (billion) Forecast, by Application 2020 & 2033
- Table 14: Global PropTech Revenue billion Forecast, by Type 2020 & 2033
- Table 15: Global PropTech Revenue billion Forecast, by Property Type 2020 & 2033
- Table 16: Global PropTech Revenue billion Forecast, by Deployment 2020 & 2033
- Table 17: Global PropTech Revenue billion Forecast, by End User 2020 & 2033
- Table 18: Global PropTech Revenue billion Forecast, by Country 2020 & 2033
- Table 19: Brazil PropTech Revenue (billion) Forecast, by Application 2020 & 2033
- Table 20: Argentina PropTech Revenue (billion) Forecast, by Application 2020 & 2033
- Table 21: Rest of South America PropTech Revenue (billion) Forecast, by Application 2020 & 2033
- Table 22: Global PropTech Revenue billion Forecast, by Type 2020 & 2033
- Table 23: Global PropTech Revenue billion Forecast, by Property Type 2020 & 2033
- Table 24: Global PropTech Revenue billion Forecast, by Deployment 2020 & 2033
- Table 25: Global PropTech Revenue billion Forecast, by End User 2020 & 2033
- Table 26: Global PropTech Revenue billion Forecast, by Country 2020 & 2033
- Table 27: United Kingdom PropTech Revenue (billion) Forecast, by Application 2020 & 2033
- Table 28: Germany PropTech Revenue (billion) Forecast, by Application 2020 & 2033
- Table 29: France PropTech Revenue (billion) Forecast, by Application 2020 & 2033
- Table 30: Italy PropTech Revenue (billion) Forecast, by Application 2020 & 2033
- Table 31: Spain PropTech Revenue (billion) Forecast, by Application 2020 & 2033
- Table 32: Russia PropTech Revenue (billion) Forecast, by Application 2020 & 2033
- Table 33: Benelux PropTech Revenue (billion) Forecast, by Application 2020 & 2033
- Table 34: Nordics PropTech Revenue (billion) Forecast, by Application 2020 & 2033
- Table 35: Rest of Europe PropTech Revenue (billion) Forecast, by Application 2020 & 2033
- Table 36: Global PropTech Revenue billion Forecast, by Type 2020 & 2033
- Table 37: Global PropTech Revenue billion Forecast, by Property Type 2020 & 2033
- Table 38: Global PropTech Revenue billion Forecast, by Deployment 2020 & 2033
- Table 39: Global PropTech Revenue billion Forecast, by End User 2020 & 2033
- Table 40: Global PropTech Revenue billion Forecast, by Country 2020 & 2033
- Table 41: Turkey PropTech Revenue (billion) Forecast, by Application 2020 & 2033
- Table 42: Israel PropTech Revenue (billion) Forecast, by Application 2020 & 2033
- Table 43: GCC PropTech Revenue (billion) Forecast, by Application 2020 & 2033
- Table 44: North Africa PropTech Revenue (billion) Forecast, by Application 2020 & 2033
- Table 45: South Africa PropTech Revenue (billion) Forecast, by Application 2020 & 2033
- Table 46: Rest of Middle East & Africa PropTech Revenue (billion) Forecast, by Application 2020 & 2033
- Table 47: Global PropTech Revenue billion Forecast, by Type 2020 & 2033
- Table 48: Global PropTech Revenue billion Forecast, by Property Type 2020 & 2033
- Table 49: Global PropTech Revenue billion Forecast, by Deployment 2020 & 2033
- Table 50: Global PropTech Revenue billion Forecast, by End User 2020 & 2033
- Table 51: Global PropTech Revenue billion Forecast, by Country 2020 & 2033
- Table 52: China PropTech Revenue (billion) Forecast, by Application 2020 & 2033
- Table 53: India PropTech Revenue (billion) Forecast, by Application 2020 & 2033
- Table 54: Japan PropTech Revenue (billion) Forecast, by Application 2020 & 2033
- Table 55: South Korea PropTech Revenue (billion) Forecast, by Application 2020 & 2033
- Table 56: ASEAN PropTech Revenue (billion) Forecast, by Application 2020 & 2033
- Table 57: Oceania PropTech Revenue (billion) Forecast, by Application 2020 & 2033
- Table 58: Rest of Asia Pacific PropTech Revenue (billion) Forecast, by Application 2020 & 2033
Frequently Asked Questions
1. What is the projected Compound Annual Growth Rate (CAGR) of the PropTech?
The projected CAGR is approximately 16.1%.
2. Which companies are prominent players in the PropTech?
Key companies in the market include eSelf AI, VuHome.ai, Structurely, Ask the Agent, EliseAI, Placeform, Loft47, Matterport, Soul Machines, UneeQ, Others.
3. What are the main segments of the PropTech?
The market segments include Type, Property Type, Deployment, End User.
4. Can you provide details about the market size?
The market size is estimated to be USD 47.08 billion as of 2022.
5. What are some drivers contributing to market growth?
N/A
6. What are the notable trends driving market growth?
N/A
7. Are there any restraints impacting market growth?
N/A
8. Can you provide examples of recent developments in the market?
N/A
9. What pricing options are available for accessing the report?
Pricing options include single-user, multi-user, and enterprise licenses priced at USD 2900.00, USD 4350.00, and USD 5800.00 respectively.
10. Is the market size provided in terms of value or volume?
The market size is provided in terms of value, measured in billion.
11. Are there any specific market keywords associated with the report?
Yes, the market keyword associated with the report is "PropTech," which aids in identifying and referencing the specific market segment covered.
12. How do I determine which pricing option suits my needs best?
The pricing options vary based on user requirements and access needs. Individual users may opt for single-user licenses, while businesses requiring broader access may choose multi-user or enterprise licenses for cost-effective access to the report.
13. Are there any additional resources or data provided in the PropTech report?
While the report offers comprehensive insights, it's advisable to review the specific contents or supplementary materials provided to ascertain if additional resources or data are available.
14. How can I stay updated on further developments or reports in the PropTech?
To stay informed about further developments, trends, and reports in the PropTech, consider subscribing to industry newsletters, following relevant companies and organizations, or regularly checking reputable industry news sources and publications.
Methodology
Step 1 - Identification of Relevant Samples Size from Population Database


Step 2 - Approaches for Defining Global Market Size (Value, Volume* & Price*)

Note*: In applicable scenarios
Step 3 - Data Sources
Primary Research
- Web Analytics
- Survey Reports
- Research Institute
- Latest Research Reports
- Opinion Leaders
Secondary Research
- Annual Reports
- White Paper
- Latest Press Release
- Industry Association
- Paid Database
- Investor Presentations

Step 4 - Data Triangulation
Involves using different sources of information in order to increase the validity of a study
These sources are likely to be stakeholders in a program - participants, other researchers, program staff, other community members, and so on.
Then we put all data in single framework & apply various statistical tools to find out the dynamic on the market.
During the analysis stage, feedback from the stakeholder groups would be compared to determine areas of agreement as well as areas of divergence