

Key Insights
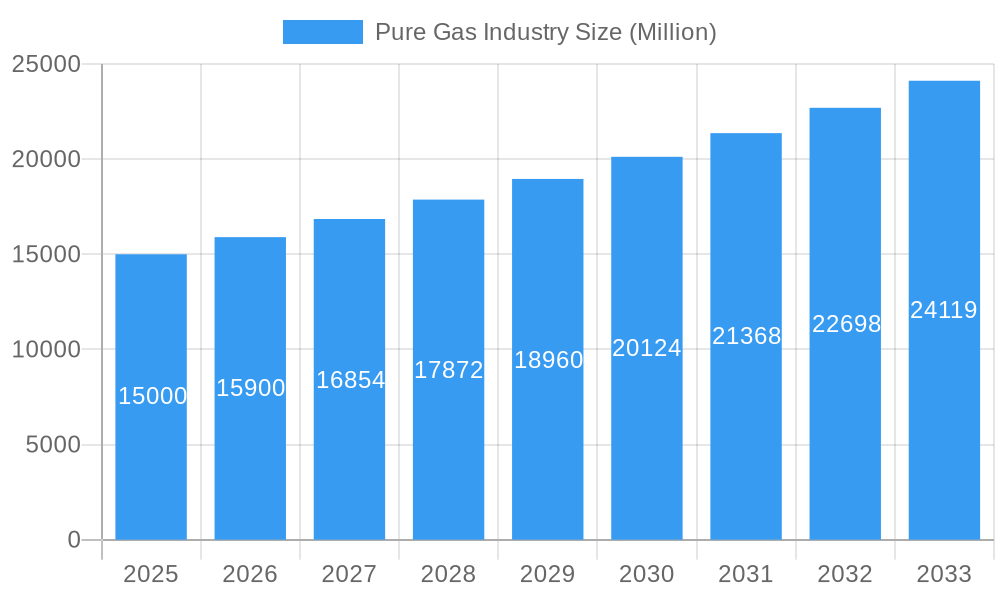
The global pure gas market, encompassing high-purity atmospheric, noble, and carbon gases, is projected for substantial expansion. The market is anticipated to reach $119.11 billion by 2025, growing at a Compound Annual Growth Rate (CAGR) of 4.4% from 2025 to 2033. This growth is propelled by escalating demand from the electronics sector for advanced manufacturing, advancements in healthcare applications, and the integral role of pure gases in renewable energy initiatives. Increased industrial automation and adherence to stringent quality standards further bolster market expansion. While supply chain volatility and raw material costs present challenges, continuous technological innovation and robust global demand ensure a positive market outlook.
Pure Gas Industry Market Size (In Billion)
Market segmentation highlights the dominance of high-purity atmospheric gases, followed by noble and carbon gases. Key applications include insulation and lighting, demonstrating the broad utility of pure gases. Geographically, the Asia-Pacific region, led by China and India, is expected to exhibit significant growth due to rapid industrialization. Mature markets in North America and Europe remain key contributors. The competitive landscape features major players such as Air Products and Chemicals Inc., Linde plc, and Air Liquide, alongside regional entities. Strategic collaborations, technological breakthroughs, and mergers and acquisitions will likely define future competitive trends.
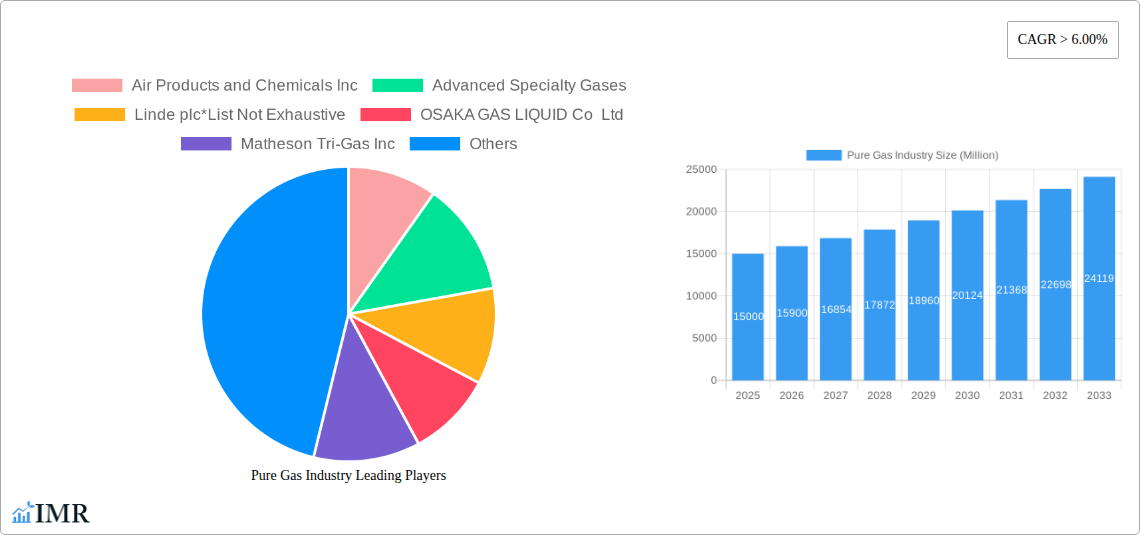
Pure Gas Industry Company Market Share
Pure Gas Industry Market Report: 2019-2033
This comprehensive report provides an in-depth analysis of the Pure Gas industry, encompassing market dynamics, growth trends, regional dominance, product landscape, key players, and future outlook. With a study period spanning 2019-2033, a base year of 2025, and a forecast period of 2025-2033, this report offers invaluable insights for industry professionals, investors, and strategic decision-makers. The report leverages extensive data analysis to provide a clear and concise understanding of the Pure Gas market's evolution and future potential.
Pure Gas Industry Market Dynamics & Structure
The Pure Gas industry, encompassing parent markets like industrial gases and child markets such as high-purity gases for specific applications, is characterized by moderate concentration. Key players like Air Products and Chemicals Inc, Linde plc, Air Liquide, and Messer Group hold significant market share, while smaller players compete through niche product offerings and regional focus. Technological innovation, particularly in gas purification and delivery systems, is a major driver, while stringent regulatory frameworks related to safety and environmental impact influence market practices. The industry also sees competitive pressure from product substitutes in specific applications, leading to continuous improvement in product quality and cost-effectiveness. Mergers and acquisitions (M&A) activity has been moderate, with larger players consolidating their market presence through strategic acquisitions of smaller companies.
- Market Concentration: xx% controlled by top 5 players in 2024.
- M&A Deal Volume (2019-2024): xx deals, totaling xx Million USD.
- Innovation Barriers: High R&D investment and stringent safety regulations.
- End-User Demographics: Increasing demand from electronics, healthcare, and energy sectors.
Pure Gas Industry Growth Trends & Insights
The Pure Gas industry has witnessed consistent growth over the past five years, driven by increasing demand across various end-use sectors. The market size, estimated at xx Million units in 2025, is projected to reach xx Million units by 2033, exhibiting a Compound Annual Growth Rate (CAGR) of xx%. This growth is primarily attributed to technological advancements leading to improved gas purity and efficiency, coupled with rising adoption rates across key applications, including electronics manufacturing, medical treatments, and energy production. Consumer behavior shifts towards environmentally friendly technologies have also fueled demand for certain types of pure gases. Market penetration in emerging economies remains relatively low, presenting significant growth potential.
Dominant Regions, Countries, or Segments in Pure Gas Industry
North America and Europe currently dominate the Pure Gas industry, driven by robust industrial activity and high technological adoption rates. However, Asia-Pacific is experiencing rapid growth, with China and India leading the charge. Within product types, High-Purity Atmospheric Gases hold the largest market share, followed by Noble Gases and Carbon Gases. In terms of applications, the Electronics and Medical and Healthcare sectors are key growth drivers, exhibiting high demand for high-purity gases.
- Key Drivers (Asia-Pacific): Rapid industrialization, rising disposable incomes, and supportive government policies.
- Dominance Factors (North America): Established industrial base, strong technological capabilities, and high R&D investment.
- Growth Potential (Emerging Markets): Untapped demand, rising industrialization, and increasing healthcare spending.
Pure Gas Industry Product Landscape
The Pure Gas industry offers a diverse range of products, characterized by varying levels of purity, application-specific formulations, and delivery systems. Continuous innovation focuses on enhancing purity levels, improving efficiency, and reducing environmental impact. Unique selling propositions often center on superior purity, tailored gas mixtures for specific applications, and reliable delivery systems. Technological advancements involve cryogenic separation techniques, membrane separation, and advanced purification technologies.
Key Drivers, Barriers & Challenges in Pure Gas Industry
Key Drivers: Growing demand from various sectors (electronics, healthcare, energy), technological advancements, and supportive government policies promoting cleaner energy technologies. For example, the increasing use of semiconductors in electronics significantly boosts the demand for high-purity gases in the manufacturing process.
Key Challenges: Fluctuations in raw material prices, stringent safety and environmental regulations (potentially increasing production costs), and intense competition among established players. Supply chain disruptions and the energy crisis can also significantly influence production costs and market stability. For example, a shortage of helium, a critical noble gas, can significantly impact the cost and availability of various pure gas products.
Emerging Opportunities in Pure Gas Industry
Untapped markets in emerging economies, innovative applications in advanced materials and clean energy technologies, and evolving consumer preferences towards sustainable products present significant opportunities. The development of new applications, like utilizing rare gases in next-generation lighting and quantum computing, also signifies huge untapped market potentials.
Growth Accelerators in the Pure Gas Industry
Technological breakthroughs in gas purification and delivery systems, strategic partnerships to expand market reach, and successful market expansion strategies in emerging economies are key catalysts for long-term growth. The development of novel applications and the increasing focus on sustainability will further drive industry expansion.
Key Players Shaping the Pure Gas Industry Market
- Air Products and Chemicals Inc
- Advanced Specialty Gases
- Linde plc
- OSAKA GAS LIQUID Co Ltd
- Matheson Tri-Gas Inc
- Iwatani Corporation
- American Welding & Gas
- Messer Group
- Air Liquide
- Airgas Inc
Notable Milestones in Pure Gas Industry Sector
- 2020: Linde plc and Praxair merger creates a global leader in industrial gases.
- 2022: Several key players announce investments in renewable energy-powered production facilities.
- 2023: Significant advancements in gas purification technologies are showcased at industry conferences. (Specific examples require further research and will vary based on actual data).
In-Depth Pure Gas Industry Market Outlook
The Pure Gas industry is poised for sustained growth, driven by technological advancements, increasing demand from various sectors, and the expansion into emerging markets. Strategic partnerships, investments in sustainable production practices, and innovation in product offerings will be key to long-term success. The potential for disruptive technologies and new applications across diverse industries guarantees a dynamic and promising market outlook for the next decade.
Pure Gas Industry Segmentation
-
1. Product Type
- 1.1. High-Purity Atmospheric Gases
- 1.2. Noble Gases
- 1.3. Carbon Gases
- 1.4. Other Product Types
-
2. Application
- 2.1. Insulation
- 2.2. Lighting
- 2.3. Coolant
- 2.4. Other Applications
-
3. End-user Industry
- 3.1. Electronics
- 3.2. Metal Production
- 3.3. Chemicals
- 3.4. Energy and Power
- 3.5. Medical and Healthcare
- 3.6. Food and Beverages
- 3.7. Other End-user Industries
Pure Gas Industry Segmentation By Geography
-
1. Asia Pacific
- 1.1. China
- 1.2. India
- 1.3. Japan
- 1.4. South Korea
- 1.5. ASEAN Countries
- 1.6. Rest of Asia Pacific
-
2. North America
- 2.1. United States
- 2.2. Canada
- 2.3. Mexico
-
3. Europe
- 3.1. Germany
- 3.2. United Kingdom
- 3.3. Italy
- 3.4. France
- 3.5. Rest of Europe
-
4. South America
- 4.1. Brazil
- 4.2. Argentina
- 4.3. Rest of South America
-
5. Middle East and Africa
- 5.1. Saudi Arabia
- 5.2. South Africa
- 5.3. Rest of Middle East and Africa
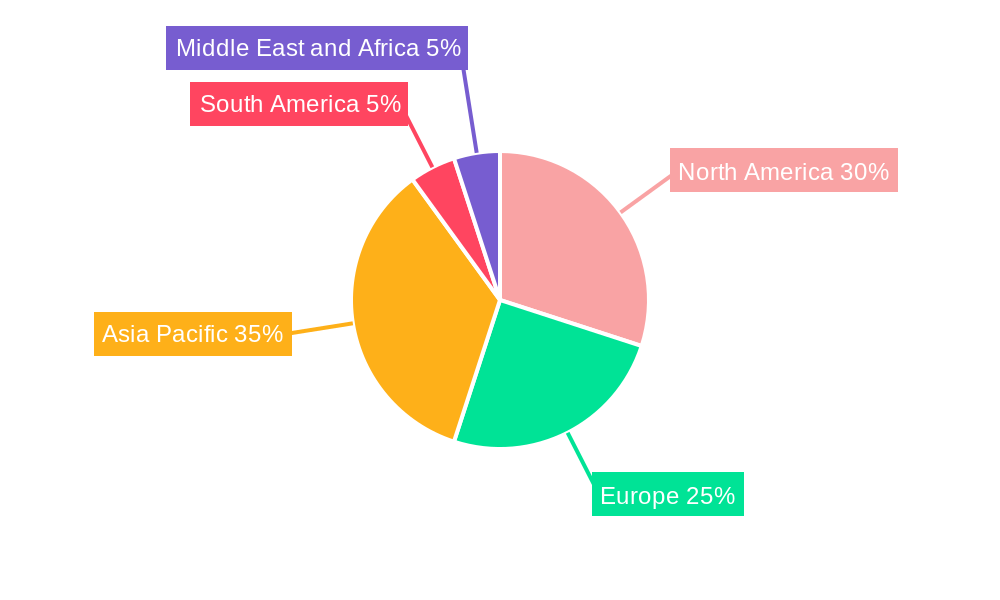
Pure Gas Industry Regional Market Share
Geographic Coverage of Pure Gas Industry
Pure Gas Industry REPORT HIGHLIGHTS
| Aspects | Details |
|---|---|
| Study Period | 2020-2034 |
| Base Year | 2025 |
| Estimated Year | 2026 |
| Forecast Period | 2026-2034 |
| Historical Period | 2020-2025 |
| Growth Rate | CAGR of 4.4% from 2020-2034 |
| Segmentation |
|
Table of Contents
- 1. Introduction
- 1.1. Research Scope
- 1.2. Market Segmentation
- 1.3. Research Objective
- 1.4. Definitions and Assumptions
- 2. Executive Summary
- 2.1. Market Snapshot
- 3. Market Dynamics
- 3.1. Market Drivers
- 3.2. Market Restrains
- 3.3. Market Trends
- 3.4. Market Opportunities
- 4. Market Factor Analysis
- 4.1. Porters Five Forces
- 4.1.1. Bargaining Power of Suppliers
- 4.1.2. Bargaining Power of Buyers
- 4.1.3. Threat of New Entrants
- 4.1.4. Threat of Substitutes
- 4.1.5. Competitive Rivalry
- 4.2. PESTEL analysis
- 4.3. BCG Analysis
- 4.3.1. Stars (High Growth, High Market Share)
- 4.3.2. Cash Cows (Low Growth, High Market Share)
- 4.3.3. Question Mark (High Growth, Low Market Share)
- 4.3.4. Dogs (Low Growth, Low Market Share)
- 4.4. Ansoff Matrix Analysis
- 4.5. Supply Chain Analysis
- 4.6. Regulatory Landscape
- 4.7. Current Market Potential and Opportunity Assessment (TAM–SAM–SOM Framework)
- 4.8. IMR Analyst Note
- 4.1. Porters Five Forces
- 5. Market Analysis, Insights and Forecast 2021-2033
- 5.1. Market Analysis, Insights and Forecast - by Product Type
- 5.1.1. High-Purity Atmospheric Gases
- 5.1.2. Noble Gases
- 5.1.3. Carbon Gases
- 5.1.4. Other Product Types
- 5.2. Market Analysis, Insights and Forecast - by Application
- 5.2.1. Insulation
- 5.2.2. Lighting
- 5.2.3. Coolant
- 5.2.4. Other Applications
- 5.3. Market Analysis, Insights and Forecast - by End-user Industry
- 5.3.1. Electronics
- 5.3.2. Metal Production
- 5.3.3. Chemicals
- 5.3.4. Energy and Power
- 5.3.5. Medical and Healthcare
- 5.3.6. Food and Beverages
- 5.3.7. Other End-user Industries
- 5.4. Market Analysis, Insights and Forecast - by Region
- 5.4.1. Asia Pacific
- 5.4.2. North America
- 5.4.3. Europe
- 5.4.4. South America
- 5.4.5. Middle East and Africa
- 5.1. Market Analysis, Insights and Forecast - by Product Type
- 6. Global Pure Gas Industry Analysis, Insights and Forecast, 2021-2033
- 6.1. Market Analysis, Insights and Forecast - by Product Type
- 6.1.1. High-Purity Atmospheric Gases
- 6.1.2. Noble Gases
- 6.1.3. Carbon Gases
- 6.1.4. Other Product Types
- 6.2. Market Analysis, Insights and Forecast - by Application
- 6.2.1. Insulation
- 6.2.2. Lighting
- 6.2.3. Coolant
- 6.2.4. Other Applications
- 6.3. Market Analysis, Insights and Forecast - by End-user Industry
- 6.3.1. Electronics
- 6.3.2. Metal Production
- 6.3.3. Chemicals
- 6.3.4. Energy and Power
- 6.3.5. Medical and Healthcare
- 6.3.6. Food and Beverages
- 6.3.7. Other End-user Industries
- 6.1. Market Analysis, Insights and Forecast - by Product Type
- 7. Asia Pacific Pure Gas Industry Analysis, Insights and Forecast, 2020-2032
- 7.1. Market Analysis, Insights and Forecast - by Product Type
- 7.1.1. High-Purity Atmospheric Gases
- 7.1.2. Noble Gases
- 7.1.3. Carbon Gases
- 7.1.4. Other Product Types
- 7.2. Market Analysis, Insights and Forecast - by Application
- 7.2.1. Insulation
- 7.2.2. Lighting
- 7.2.3. Coolant
- 7.2.4. Other Applications
- 7.3. Market Analysis, Insights and Forecast - by End-user Industry
- 7.3.1. Electronics
- 7.3.2. Metal Production
- 7.3.3. Chemicals
- 7.3.4. Energy and Power
- 7.3.5. Medical and Healthcare
- 7.3.6. Food and Beverages
- 7.3.7. Other End-user Industries
- 7.1. Market Analysis, Insights and Forecast - by Product Type
- 8. North America Pure Gas Industry Analysis, Insights and Forecast, 2020-2032
- 8.1. Market Analysis, Insights and Forecast - by Product Type
- 8.1.1. High-Purity Atmospheric Gases
- 8.1.2. Noble Gases
- 8.1.3. Carbon Gases
- 8.1.4. Other Product Types
- 8.2. Market Analysis, Insights and Forecast - by Application
- 8.2.1. Insulation
- 8.2.2. Lighting
- 8.2.3. Coolant
- 8.2.4. Other Applications
- 8.3. Market Analysis, Insights and Forecast - by End-user Industry
- 8.3.1. Electronics
- 8.3.2. Metal Production
- 8.3.3. Chemicals
- 8.3.4. Energy and Power
- 8.3.5. Medical and Healthcare
- 8.3.6. Food and Beverages
- 8.3.7. Other End-user Industries
- 8.1. Market Analysis, Insights and Forecast - by Product Type
- 9. Europe Pure Gas Industry Analysis, Insights and Forecast, 2020-2032
- 9.1. Market Analysis, Insights and Forecast - by Product Type
- 9.1.1. High-Purity Atmospheric Gases
- 9.1.2. Noble Gases
- 9.1.3. Carbon Gases
- 9.1.4. Other Product Types
- 9.2. Market Analysis, Insights and Forecast - by Application
- 9.2.1. Insulation
- 9.2.2. Lighting
- 9.2.3. Coolant
- 9.2.4. Other Applications
- 9.3. Market Analysis, Insights and Forecast - by End-user Industry
- 9.3.1. Electronics
- 9.3.2. Metal Production
- 9.3.3. Chemicals
- 9.3.4. Energy and Power
- 9.3.5. Medical and Healthcare
- 9.3.6. Food and Beverages
- 9.3.7. Other End-user Industries
- 9.1. Market Analysis, Insights and Forecast - by Product Type
- 10. South America Pure Gas Industry Analysis, Insights and Forecast, 2020-2032
- 10.1. Market Analysis, Insights and Forecast - by Product Type
- 10.1.1. High-Purity Atmospheric Gases
- 10.1.2. Noble Gases
- 10.1.3. Carbon Gases
- 10.1.4. Other Product Types
- 10.2. Market Analysis, Insights and Forecast - by Application
- 10.2.1. Insulation
- 10.2.2. Lighting
- 10.2.3. Coolant
- 10.2.4. Other Applications
- 10.3. Market Analysis, Insights and Forecast - by End-user Industry
- 10.3.1. Electronics
- 10.3.2. Metal Production
- 10.3.3. Chemicals
- 10.3.4. Energy and Power
- 10.3.5. Medical and Healthcare
- 10.3.6. Food and Beverages
- 10.3.7. Other End-user Industries
- 10.1. Market Analysis, Insights and Forecast - by Product Type
- 11. Middle East and Africa Pure Gas Industry Analysis, Insights and Forecast, 2020-2032
- 11.1. Market Analysis, Insights and Forecast - by Product Type
- 11.1.1. High-Purity Atmospheric Gases
- 11.1.2. Noble Gases
- 11.1.3. Carbon Gases
- 11.1.4. Other Product Types
- 11.2. Market Analysis, Insights and Forecast - by Application
- 11.2.1. Insulation
- 11.2.2. Lighting
- 11.2.3. Coolant
- 11.2.4. Other Applications
- 11.3. Market Analysis, Insights and Forecast - by End-user Industry
- 11.3.1. Electronics
- 11.3.2. Metal Production
- 11.3.3. Chemicals
- 11.3.4. Energy and Power
- 11.3.5. Medical and Healthcare
- 11.3.6. Food and Beverages
- 11.3.7. Other End-user Industries
- 11.1. Market Analysis, Insights and Forecast - by Product Type
- 12. Competitive Analysis
- 12.1. Company Profiles
- 12.1.1 Air Products and Chemicals Inc
- 12.1.1.1. Company Overview
- 12.1.1.2. Products
- 12.1.1.3. Company Financials
- 12.1.1.4. SWOT Analysis
- 12.1.2 Advanced Specialty Gases
- 12.1.2.1. Company Overview
- 12.1.2.2. Products
- 12.1.2.3. Company Financials
- 12.1.2.4. SWOT Analysis
- 12.1.3 Linde plc*List Not Exhaustive
- 12.1.3.1. Company Overview
- 12.1.3.2. Products
- 12.1.3.3. Company Financials
- 12.1.3.4. SWOT Analysis
- 12.1.4 OSAKA GAS LIQUID Co Ltd
- 12.1.4.1. Company Overview
- 12.1.4.2. Products
- 12.1.4.3. Company Financials
- 12.1.4.4. SWOT Analysis
- 12.1.5 Matheson Tri-Gas Inc
- 12.1.5.1. Company Overview
- 12.1.5.2. Products
- 12.1.5.3. Company Financials
- 12.1.5.4. SWOT Analysis
- 12.1.6 Iwatani Corporation
- 12.1.6.1. Company Overview
- 12.1.6.2. Products
- 12.1.6.3. Company Financials
- 12.1.6.4. SWOT Analysis
- 12.1.7 American Welding & Gas
- 12.1.7.1. Company Overview
- 12.1.7.2. Products
- 12.1.7.3. Company Financials
- 12.1.7.4. SWOT Analysis
- 12.1.8 Messer Group
- 12.1.8.1. Company Overview
- 12.1.8.2. Products
- 12.1.8.3. Company Financials
- 12.1.8.4. SWOT Analysis
- 12.1.9 Air Liquide
- 12.1.9.1. Company Overview
- 12.1.9.2. Products
- 12.1.9.3. Company Financials
- 12.1.9.4. SWOT Analysis
- 12.1.10 Airgas Inc
- 12.1.10.1. Company Overview
- 12.1.10.2. Products
- 12.1.10.3. Company Financials
- 12.1.10.4. SWOT Analysis
- 12.1.1 Air Products and Chemicals Inc
- 12.2. Market Entropy
- 12.2.1 Company's Key Areas Served
- 12.2.2 Recent Developments
- 12.3. Company Market Share Analysis 2025
- 12.3.1 Top 5 Companies Market Share Analysis
- 12.3.2 Top 3 Companies Market Share Analysis
- 12.4. List of Potential Customers
- 13. Research Methodology
List of Figures
- Figure 1: Global Pure Gas Industry Revenue Breakdown (billion, %) by Region 2025 & 2033
- Figure 2: Asia Pacific Pure Gas Industry Revenue (billion), by Product Type 2025 & 2033
- Figure 3: Asia Pacific Pure Gas Industry Revenue Share (%), by Product Type 2025 & 2033
- Figure 4: Asia Pacific Pure Gas Industry Revenue (billion), by Application 2025 & 2033
- Figure 5: Asia Pacific Pure Gas Industry Revenue Share (%), by Application 2025 & 2033
- Figure 6: Asia Pacific Pure Gas Industry Revenue (billion), by End-user Industry 2025 & 2033
- Figure 7: Asia Pacific Pure Gas Industry Revenue Share (%), by End-user Industry 2025 & 2033
- Figure 8: Asia Pacific Pure Gas Industry Revenue (billion), by Country 2025 & 2033
- Figure 9: Asia Pacific Pure Gas Industry Revenue Share (%), by Country 2025 & 2033
- Figure 10: North America Pure Gas Industry Revenue (billion), by Product Type 2025 & 2033
- Figure 11: North America Pure Gas Industry Revenue Share (%), by Product Type 2025 & 2033
- Figure 12: North America Pure Gas Industry Revenue (billion), by Application 2025 & 2033
- Figure 13: North America Pure Gas Industry Revenue Share (%), by Application 2025 & 2033
- Figure 14: North America Pure Gas Industry Revenue (billion), by End-user Industry 2025 & 2033
- Figure 15: North America Pure Gas Industry Revenue Share (%), by End-user Industry 2025 & 2033
- Figure 16: North America Pure Gas Industry Revenue (billion), by Country 2025 & 2033
- Figure 17: North America Pure Gas Industry Revenue Share (%), by Country 2025 & 2033
- Figure 18: Europe Pure Gas Industry Revenue (billion), by Product Type 2025 & 2033
- Figure 19: Europe Pure Gas Industry Revenue Share (%), by Product Type 2025 & 2033
- Figure 20: Europe Pure Gas Industry Revenue (billion), by Application 2025 & 2033
- Figure 21: Europe Pure Gas Industry Revenue Share (%), by Application 2025 & 2033
- Figure 22: Europe Pure Gas Industry Revenue (billion), by End-user Industry 2025 & 2033
- Figure 23: Europe Pure Gas Industry Revenue Share (%), by End-user Industry 2025 & 2033
- Figure 24: Europe Pure Gas Industry Revenue (billion), by Country 2025 & 2033
- Figure 25: Europe Pure Gas Industry Revenue Share (%), by Country 2025 & 2033
- Figure 26: South America Pure Gas Industry Revenue (billion), by Product Type 2025 & 2033
- Figure 27: South America Pure Gas Industry Revenue Share (%), by Product Type 2025 & 2033
- Figure 28: South America Pure Gas Industry Revenue (billion), by Application 2025 & 2033
- Figure 29: South America Pure Gas Industry Revenue Share (%), by Application 2025 & 2033
- Figure 30: South America Pure Gas Industry Revenue (billion), by End-user Industry 2025 & 2033
- Figure 31: South America Pure Gas Industry Revenue Share (%), by End-user Industry 2025 & 2033
- Figure 32: South America Pure Gas Industry Revenue (billion), by Country 2025 & 2033
- Figure 33: South America Pure Gas Industry Revenue Share (%), by Country 2025 & 2033
- Figure 34: Middle East and Africa Pure Gas Industry Revenue (billion), by Product Type 2025 & 2033
- Figure 35: Middle East and Africa Pure Gas Industry Revenue Share (%), by Product Type 2025 & 2033
- Figure 36: Middle East and Africa Pure Gas Industry Revenue (billion), by Application 2025 & 2033
- Figure 37: Middle East and Africa Pure Gas Industry Revenue Share (%), by Application 2025 & 2033
- Figure 38: Middle East and Africa Pure Gas Industry Revenue (billion), by End-user Industry 2025 & 2033
- Figure 39: Middle East and Africa Pure Gas Industry Revenue Share (%), by End-user Industry 2025 & 2033
- Figure 40: Middle East and Africa Pure Gas Industry Revenue (billion), by Country 2025 & 2033
- Figure 41: Middle East and Africa Pure Gas Industry Revenue Share (%), by Country 2025 & 2033
List of Tables
- Table 1: Global Pure Gas Industry Revenue billion Forecast, by Product Type 2020 & 2033
- Table 2: Global Pure Gas Industry Revenue billion Forecast, by Application 2020 & 2033
- Table 3: Global Pure Gas Industry Revenue billion Forecast, by End-user Industry 2020 & 2033
- Table 4: Global Pure Gas Industry Revenue billion Forecast, by Region 2020 & 2033
- Table 5: Global Pure Gas Industry Revenue billion Forecast, by Product Type 2020 & 2033
- Table 6: Global Pure Gas Industry Revenue billion Forecast, by Application 2020 & 2033
- Table 7: Global Pure Gas Industry Revenue billion Forecast, by End-user Industry 2020 & 2033
- Table 8: Global Pure Gas Industry Revenue billion Forecast, by Country 2020 & 2033
- Table 9: China Pure Gas Industry Revenue (billion) Forecast, by Application 2020 & 2033
- Table 10: India Pure Gas Industry Revenue (billion) Forecast, by Application 2020 & 2033
- Table 11: Japan Pure Gas Industry Revenue (billion) Forecast, by Application 2020 & 2033
- Table 12: South Korea Pure Gas Industry Revenue (billion) Forecast, by Application 2020 & 2033
- Table 13: ASEAN Countries Pure Gas Industry Revenue (billion) Forecast, by Application 2020 & 2033
- Table 14: Rest of Asia Pacific Pure Gas Industry Revenue (billion) Forecast, by Application 2020 & 2033
- Table 15: Global Pure Gas Industry Revenue billion Forecast, by Product Type 2020 & 2033
- Table 16: Global Pure Gas Industry Revenue billion Forecast, by Application 2020 & 2033
- Table 17: Global Pure Gas Industry Revenue billion Forecast, by End-user Industry 2020 & 2033
- Table 18: Global Pure Gas Industry Revenue billion Forecast, by Country 2020 & 2033
- Table 19: United States Pure Gas Industry Revenue (billion) Forecast, by Application 2020 & 2033
- Table 20: Canada Pure Gas Industry Revenue (billion) Forecast, by Application 2020 & 2033
- Table 21: Mexico Pure Gas Industry Revenue (billion) Forecast, by Application 2020 & 2033
- Table 22: Global Pure Gas Industry Revenue billion Forecast, by Product Type 2020 & 2033
- Table 23: Global Pure Gas Industry Revenue billion Forecast, by Application 2020 & 2033
- Table 24: Global Pure Gas Industry Revenue billion Forecast, by End-user Industry 2020 & 2033
- Table 25: Global Pure Gas Industry Revenue billion Forecast, by Country 2020 & 2033
- Table 26: Germany Pure Gas Industry Revenue (billion) Forecast, by Application 2020 & 2033
- Table 27: United Kingdom Pure Gas Industry Revenue (billion) Forecast, by Application 2020 & 2033
- Table 28: Italy Pure Gas Industry Revenue (billion) Forecast, by Application 2020 & 2033
- Table 29: France Pure Gas Industry Revenue (billion) Forecast, by Application 2020 & 2033
- Table 30: Rest of Europe Pure Gas Industry Revenue (billion) Forecast, by Application 2020 & 2033
- Table 31: Global Pure Gas Industry Revenue billion Forecast, by Product Type 2020 & 2033
- Table 32: Global Pure Gas Industry Revenue billion Forecast, by Application 2020 & 2033
- Table 33: Global Pure Gas Industry Revenue billion Forecast, by End-user Industry 2020 & 2033
- Table 34: Global Pure Gas Industry Revenue billion Forecast, by Country 2020 & 2033
- Table 35: Brazil Pure Gas Industry Revenue (billion) Forecast, by Application 2020 & 2033
- Table 36: Argentina Pure Gas Industry Revenue (billion) Forecast, by Application 2020 & 2033
- Table 37: Rest of South America Pure Gas Industry Revenue (billion) Forecast, by Application 2020 & 2033
- Table 38: Global Pure Gas Industry Revenue billion Forecast, by Product Type 2020 & 2033
- Table 39: Global Pure Gas Industry Revenue billion Forecast, by Application 2020 & 2033
- Table 40: Global Pure Gas Industry Revenue billion Forecast, by End-user Industry 2020 & 2033
- Table 41: Global Pure Gas Industry Revenue billion Forecast, by Country 2020 & 2033
- Table 42: Saudi Arabia Pure Gas Industry Revenue (billion) Forecast, by Application 2020 & 2033
- Table 43: South Africa Pure Gas Industry Revenue (billion) Forecast, by Application 2020 & 2033
- Table 44: Rest of Middle East and Africa Pure Gas Industry Revenue (billion) Forecast, by Application 2020 & 2033
Frequently Asked Questions
1. What is the projected Compound Annual Growth Rate (CAGR) of the Pure Gas Industry?
The projected CAGR is approximately 4.4%.
2. Which companies are prominent players in the Pure Gas Industry?
Key companies in the market include Air Products and Chemicals Inc, Advanced Specialty Gases, Linde plc*List Not Exhaustive, OSAKA GAS LIQUID Co Ltd, Matheson Tri-Gas Inc, Iwatani Corporation, American Welding & Gas, Messer Group, Air Liquide, Airgas Inc.
3. What are the main segments of the Pure Gas Industry?
The market segments include Product Type, Application, End-user Industry.
4. Can you provide details about the market size?
The market size is estimated to be USD 119.11 billion as of 2022.
5. What are some drivers contributing to market growth?
; Increasing Demand from Electronics Industry; Rising Demand for Solar PV Production.
6. What are the notable trends driving market growth?
Noble Gas Product Type to Dominate the Market.
7. Are there any restraints impacting market growth?
; High Cost of Indium Tin Oxide; Other Restraints.
8. Can you provide examples of recent developments in the market?
N/A
9. What pricing options are available for accessing the report?
Pricing options include single-user, multi-user, and enterprise licenses priced at USD 4750, USD 5250, and USD 8750 respectively.
10. Is the market size provided in terms of value or volume?
The market size is provided in terms of value, measured in billion.
11. Are there any specific market keywords associated with the report?
Yes, the market keyword associated with the report is "Pure Gas Industry," which aids in identifying and referencing the specific market segment covered.
12. How do I determine which pricing option suits my needs best?
The pricing options vary based on user requirements and access needs. Individual users may opt for single-user licenses, while businesses requiring broader access may choose multi-user or enterprise licenses for cost-effective access to the report.
13. Are there any additional resources or data provided in the Pure Gas Industry report?
While the report offers comprehensive insights, it's advisable to review the specific contents or supplementary materials provided to ascertain if additional resources or data are available.
14. How can I stay updated on further developments or reports in the Pure Gas Industry?
To stay informed about further developments, trends, and reports in the Pure Gas Industry, consider subscribing to industry newsletters, following relevant companies and organizations, or regularly checking reputable industry news sources and publications.
Methodology
Step 1 - Identification of Relevant Samples Size from Population Database


Step 2 - Approaches for Defining Global Market Size (Value, Volume* & Price*)

Note*: In applicable scenarios
Step 3 - Data Sources
Primary Research
- Web Analytics
- Survey Reports
- Research Institute
- Latest Research Reports
- Opinion Leaders
Secondary Research
- Annual Reports
- White Paper
- Latest Press Release
- Industry Association
- Paid Database
- Investor Presentations

Step 4 - Data Triangulation
Involves using different sources of information in order to increase the validity of a study
These sources are likely to be stakeholders in a program - participants, other researchers, program staff, other community members, and so on.
Then we put all data in single framework & apply various statistical tools to find out the dynamic on the market.
During the analysis stage, feedback from the stakeholder groups would be compared to determine areas of agreement as well as areas of divergence