

Key Insights
The global RC Power System market is experiencing robust growth, projected to reach a substantial $454 million by 2025, with an impressive Compound Annual Growth Rate (CAGR) of 4.2% anticipated between 2025 and 2033. This expansion is primarily fueled by the increasing sophistication and adoption of remote-controlled vehicles across various applications, from hobbyist endeavors to professional use. The market is characterized by a dynamic interplay of technological advancements and evolving consumer preferences. Key drivers include the growing popularity of drones for photography, surveillance, and delivery services, alongside the sustained demand for high-performance RC cars and aircraft for racing and recreational purposes. Furthermore, the integration of advanced battery technologies and efficient motor systems is enhancing the capabilities and appeal of RC power solutions. The market is segmented by application into Car Model Power System, Aircraft Model Power System, and Ship Model Power System, each witnessing steady growth due to specific niche demands and emerging use cases.
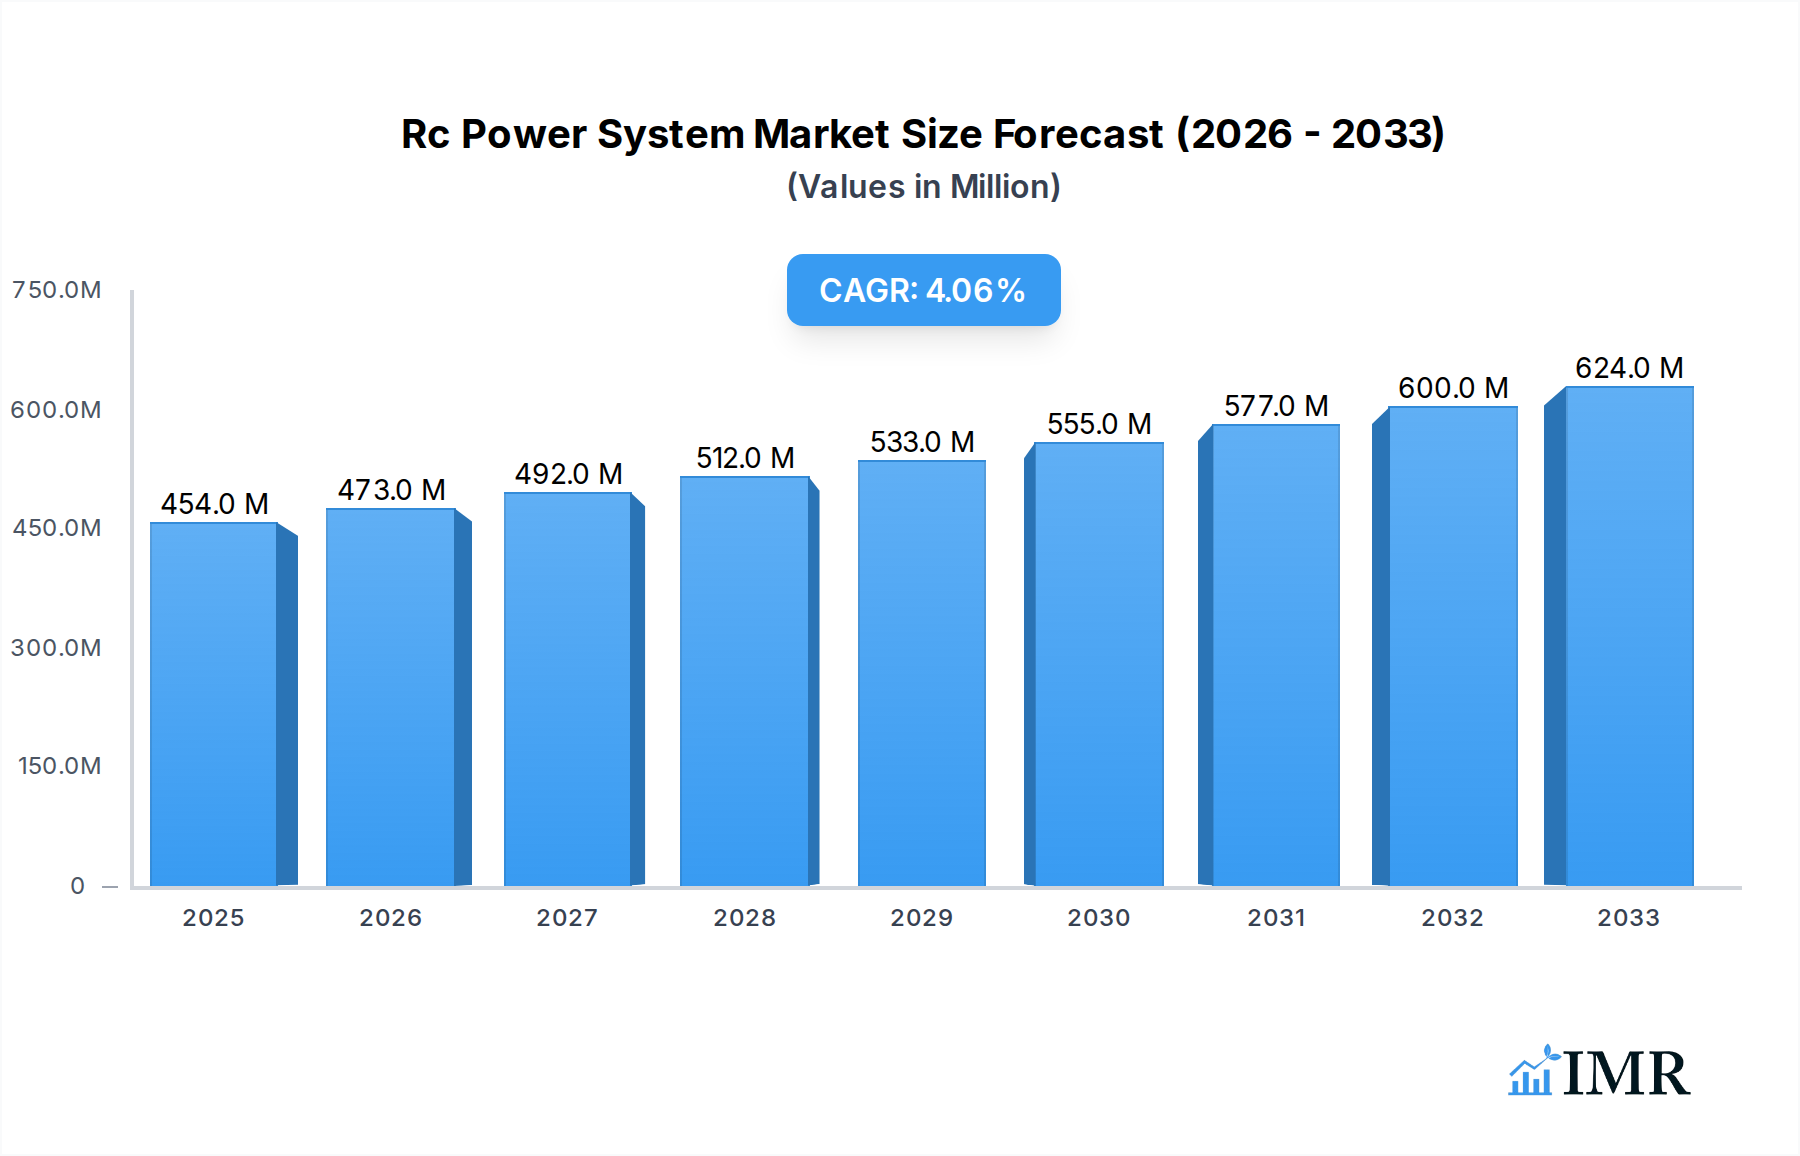
Rc Power System Market Size (In Million)
The market's trajectory is further shaped by distinct segmentation based on product type, encompassing Professional Types, High-end Types, and Economical Types, catering to a broad spectrum of users and budgets. While the market exhibits strong growth potential, certain restraints may influence its pace. These could include the fluctuating costs of raw materials, stringent regulatory frameworks in some regions concerning drone usage, and the inherent technical complexity that might pose a barrier for novice users. However, ongoing innovation, particularly in areas like battery longevity and power efficiency, coupled with expanding online retail channels and the burgeoning maker community, are expected to mitigate these challenges. Key players like HOBBICO, Turnigy, Hobbyking, and SKYRC are at the forefront of this evolution, continually introducing cutting-edge products and solutions to capture market share and drive further innovation within the RC power system landscape.

Rc Power System Company Market Share
This in-depth report provides a critical analysis of the global RC Power System market, spanning the historical period of 2019-2024, the base and estimated year of 2025, and a comprehensive forecast period from 2025-2033. Designed for industry professionals, manufacturers, investors, and stakeholders, this report leverages high-traffic keywords related to "RC Power System," "hobby electronics," "model propulsion," "electric RC," "battery technology," and "ESC for RC" to ensure maximum search engine visibility. We delve into both the parent and child market segments, offering a nuanced understanding of market structure, growth trajectories, and competitive landscapes. All quantitative values are presented in millions of units for clarity and easy comparison.
RC Power System Market Dynamics & Structure
The global RC Power System market exhibits a moderately concentrated structure, with key players like HOBBICO, Turnigy, Hobby king, SKYRC, and Hobbywing Technology holding significant market share. Technological innovation is primarily driven by advancements in battery technology (e.g., LiPo, Li-ion), motor efficiency (e.g., brushless motors), and electronic speed controller (ESC) capabilities, enabling higher performance and longer run times for RC models. Regulatory frameworks, while generally permissive, can impact battery import/export regulations and safety standards. Competitive product substitutes are minimal within the core RC power system segment, though alternative propulsion methods for certain applications might exist. End-user demographics are diverse, ranging from casual hobbyists to professional racers and industrial users, with a growing segment of younger consumers entering the market. Mergers and Acquisitions (M&A) trends are observed, particularly among smaller manufacturers seeking to gain market access or technological expertise.
- Market Concentration: Dominated by a few key players, but with a growing number of specialized niche manufacturers.
- Innovation Drivers:
- Increased energy density and improved safety of LiPo batteries.
- Development of higher KV brushless motors for enhanced speed and torque.
- Advanced ESCs with sophisticated control algorithms and telemetry features.
- Regulatory Impact: Primarily related to battery transportation and safety certifications.
- Competitive Landscape: Characterized by product differentiation in performance, reliability, and price points.
- End-User Segmentation: Casual hobbyists, competitive hobbyists, professional drone operators, industrial applications.
- M&A Activity: Driven by consolidation, acquisition of innovative technologies, and market expansion.
RC Power System Growth Trends & Insights
The RC Power System market has witnessed robust growth driven by escalating demand across its diverse applications, including car, aircraft, and ship models. The compound annual growth rate (CAGR) is projected to remain strong throughout the forecast period, fueled by continuous technological advancements and increasing affordability of high-performance components. The adoption rate of electric RC power systems has significantly outpaced that of internal combustion engines, reflecting a global shift towards cleaner and more efficient technologies. Technological disruptions, such as the integration of AI in battery management systems and the development of more efficient motor designs, are reshaping the market. Consumer behavior is increasingly influenced by factors like online reviews, social media trends, and the desire for greater customization and performance upgrades. The market penetration of advanced power systems in mainstream RC hobbies is steadily increasing, driven by a younger demographic and the growing popularity of competitive RC sports.
- Market Size Evolution: The global RC Power System market is estimated to reach $X,XXX million in 2025, with projected growth to $X,XXX million by 2033.
- CAGR: An estimated CAGR of X.X% is anticipated between 2025 and 2033.
- Adoption Rates: High adoption rates for brushless motor and LiPo battery combinations across all RC segments.
- Technological Disruptions: Miniaturization of components, increased power-to-weight ratios, and smart connectivity.
- Consumer Behavior Shifts: Preference for longer run times, higher speeds, and advanced telemetry data.
- Market Penetration: Significant increase in penetration of professional and high-end types in the hobbyist segment.
Dominant Regions, Countries, or Segments in RC Power System
The Aircraft Model Power System segment is a dominant force in the global RC Power System market, propelled by the burgeoning popularity of drones for aerial photography, racing, and commercial applications. Within this segment, Professional Types and High-end Types are experiencing particularly rapid growth, driven by the demand for advanced performance, precision, and reliability. North America and Asia Pacific are identified as the leading regions, with the United States and China emerging as key countries. Economic policies supporting technological innovation and manufacturing, coupled with robust infrastructure for hobby and drone activities, contribute to their dominance. Market share in the aircraft model segment is substantial, estimated at XX% in 2025, with strong growth potential projected.
Dominant Segment (Application): Aircraft Model Power System.
- Key Drivers: Proliferation of drones for various uses (photography, racing, commercial), increasing demand for high-performance UAVs.
- Market Share (Aircraft Model): Estimated at XX% of the total RC Power System market in 2025.
- Growth Potential: High, driven by ongoing technological advancements and expanding applications.
Dominant Segments (Type): Professional Types and High-end Types.
- Key Drivers: Demand for superior performance, precision control, and enhanced durability from serious hobbyists and commercial operators.
- Market Share (Professional/High-end): Significant and growing portion of the overall market, especially within the aircraft and high-performance car segments.
- Growth Potential: Sustained high growth due to continuous innovation and increasing consumer willingness to invest in premium products.
Leading Regions: North America and Asia Pacific.
- Key Drivers: Strong consumer spending power, established hobbyist communities, supportive government initiatives for technology development.
Leading Countries: United States and China.
- Key Drivers: Large domestic markets for RC products, significant manufacturing capabilities (China), strong R&D investments.
RC Power System Product Landscape
The RC Power System product landscape is characterized by continuous innovation in motor efficiency, battery energy density, and ESC intelligence. Brushless motors, offering superior power-to-weight ratios and longevity, have become standard for professional and high-end applications. High-discharge rate LiPo batteries provide the necessary power for demanding maneuvers, while advanced ESCs incorporate features like regenerative braking and real-time telemetry, offering precise control and valuable performance data. Unique selling propositions revolve around enhanced durability, improved heat dissipation, and seamless integration with modern RC platforms. Technological advancements are focused on miniaturization, increased power output for smaller form factors, and improved battery safety protocols.
Key Drivers, Barriers & Challenges in RC Power System
Key Drivers:
- Technological Advancements: Continuous improvements in battery technology (LiPo, Li-ion), motor efficiency (brushless), and ESC capabilities drive performance and user experience.
- Growing Hobbyist Community: Increasing global interest in RC hobbies, including cars, planes, and boats, fuels demand for power systems.
- Drone Revolution: The widespread adoption of drones for recreational and commercial purposes directly translates to a larger market for lightweight and powerful RC power systems.
- Demand for Higher Performance: Enthusiasts and professionals consistently seek faster speeds, longer run times, and greater control, pushing innovation in power systems.
Key Barriers & Challenges:
- Battery Safety and Lifespan: Concerns regarding LiPo battery safety (thermal runaway) and the finite lifespan of batteries can deter some consumers. The market faces ongoing challenges in developing even safer and more durable battery solutions.
- Cost of High-End Components: Professional and high-end RC power systems can be expensive, creating a barrier for entry-level hobbyists.
- Supply Chain Disruptions: Global supply chain issues, particularly impacting electronic components and raw materials for batteries, can lead to production delays and price fluctuations, impacting the market by an estimated $XX million in potential lost revenue.
- Regulatory Compliance: Evolving regulations for battery transportation and drone usage can pose challenges for manufacturers and users.
Emerging Opportunities in RC Power System
Emerging opportunities lie in the development of more sustainable and eco-friendly power solutions, such as advanced solid-state batteries or highly efficient hybrid power systems for larger RC models. The integration of smart technology and AI for predictive maintenance and autonomous operation in RC systems presents a significant growth avenue. Untapped markets in educational robotics and advanced industrial applications requiring specialized RC power solutions also offer substantial potential. Furthermore, the increasing consumer preference for customization and modular power systems creates opportunities for manufacturers offering flexible and upgradeable solutions.
Growth Accelerators in the RC Power System Industry
Growth accelerators in the RC Power System industry are primarily driven by rapid technological breakthroughs in energy storage and motor design, leading to lighter, more powerful, and more efficient systems. Strategic partnerships between component manufacturers and RC vehicle assemblers are crucial for integrated product development and market penetration. Furthermore, aggressive market expansion strategies into emerging economies and the development of specialized power solutions for niche applications, such as underwater robotics or advanced agricultural drones, are significant growth catalysts.
Key Players Shaping the RC Power System Market
- HOBBICO
- Turnigy
- Hobby king
- SKYRC
- Hobbywing Technology
- Nanchang Sanrui Intelligent Technology Co., Ltd.
- Shanghai Double Sky Model Co., Ltd.
- X-TEAM
- Xiongcai Technology
- Aerogenix
- Shenzhen Feiyingjiale Electronics Co., Ltd.
- Hefei land and air model
- Guangyu Electromechanical (Shanghai) Co., Ltd.
- Huavorui Electronics (Shenzhen) Co., Ltd.
- Rc Alltech Power Systems Pvt. Ltd.
Notable Milestones in RC Power System Sector
- 2019: Significant advancements in LiPo battery energy density and safety features introduced by major manufacturers.
- 2020: Rise of powerful and compact brushless motors for high-performance racing drones, leading to a surge in drone racing popularity.
- 2021: Increased adoption of telemetry systems in ESCs, providing real-time data on battery voltage, current, and temperature.
- 2022: Introduction of more efficient and lighter power systems for professional aerial photography drones, enhancing flight times and payload capacity.
- 2023: Growing focus on sustainable battery technologies and improved recycling processes for RC power system components.
- 2024: Emergence of integrated power management solutions for complex RC vehicles, optimizing performance and efficiency.
In-Depth RC Power System Market Outlook
The future outlook for the RC Power System market is exceptionally bright, driven by sustained innovation and expanding applications. Growth accelerators like advancements in battery technology, particularly in solid-state solutions, and the increasing integration of AI for smarter power management will propel the market forward. Strategic collaborations between leading companies and an emphasis on expanding into emerging markets will unlock new revenue streams. The overall market potential remains substantial, fueled by the enduring appeal of RC hobbies and the continuous emergence of new technological frontiers in areas like autonomous systems and advanced robotics.
Rc Power System Segmentation
-
1. Application
- 1.1. Car Model Power System
- 1.2. Aircraft Model Power System
- 1.3. Ship Model Power System
-
2. Type
- 2.1. Professional Types
- 2.2. High-end Types
- 2.3. Economical Types
Rc Power System Segmentation By Geography
-
1. North America
- 1.1. United States
- 1.2. Canada
- 1.3. Mexico
-
2. South America
- 2.1. Brazil
- 2.2. Argentina
- 2.3. Rest of South America
-
3. Europe
- 3.1. United Kingdom
- 3.2. Germany
- 3.3. France
- 3.4. Italy
- 3.5. Spain
- 3.6. Russia
- 3.7. Benelux
- 3.8. Nordics
- 3.9. Rest of Europe
-
4. Middle East & Africa
- 4.1. Turkey
- 4.2. Israel
- 4.3. GCC
- 4.4. North Africa
- 4.5. South Africa
- 4.6. Rest of Middle East & Africa
-
5. Asia Pacific
- 5.1. China
- 5.2. India
- 5.3. Japan
- 5.4. South Korea
- 5.5. ASEAN
- 5.6. Oceania
- 5.7. Rest of Asia Pacific
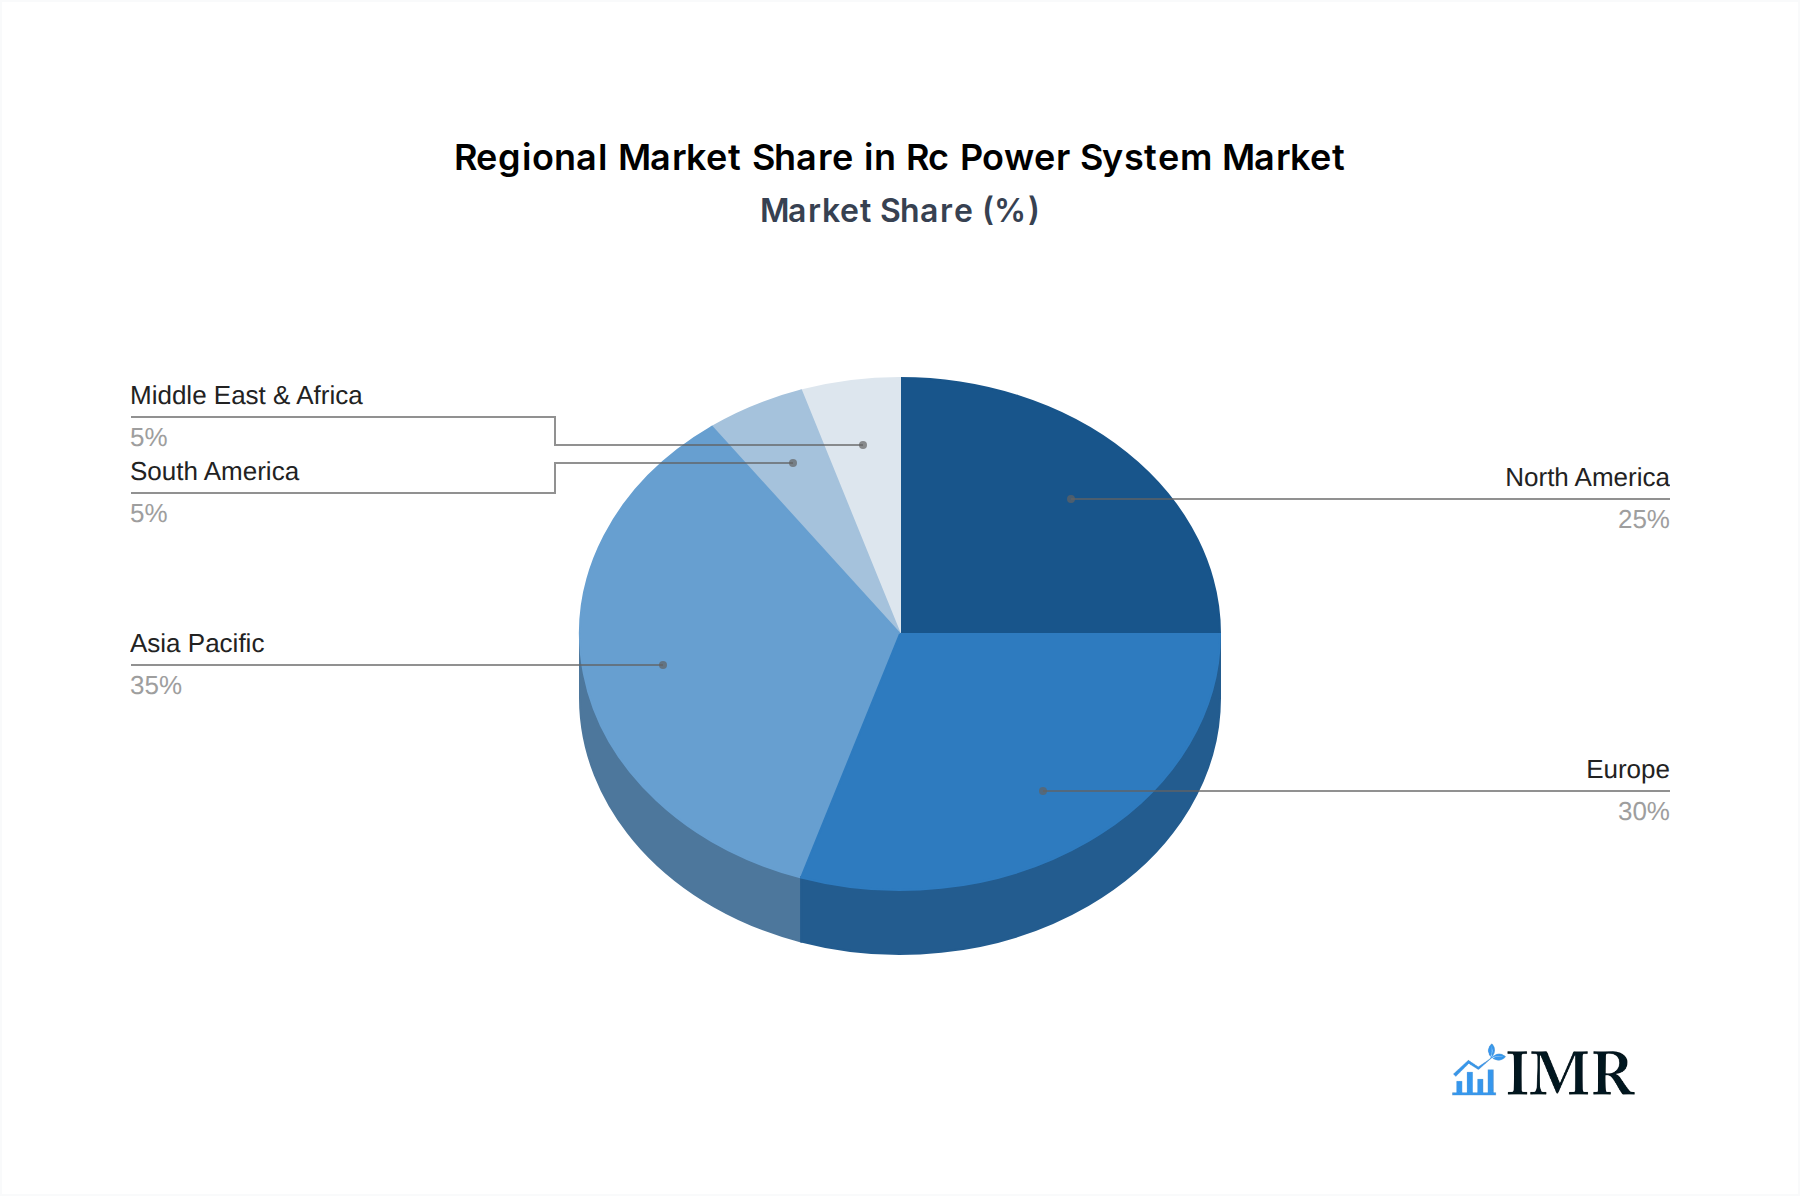
Rc Power System Regional Market Share
Geographic Coverage of Rc Power System
Rc Power System REPORT HIGHLIGHTS
| Aspects | Details |
|---|---|
| Study Period | 2020-2034 |
| Base Year | 2025 |
| Estimated Year | 2026 |
| Forecast Period | 2026-2034 |
| Historical Period | 2020-2025 |
| Growth Rate | CAGR of 4.2% from 2020-2034 |
| Segmentation |
|
Table of Contents
- 1. Introduction
- 1.1. Research Scope
- 1.2. Market Segmentation
- 1.3. Research Methodology
- 1.4. Definitions and Assumptions
- 2. Executive Summary
- 2.1. Introduction
- 3. Market Dynamics
- 3.1. Introduction
- 3.2. Market Drivers
- 3.3. Market Restrains
- 3.4. Market Trends
- 4. Market Factor Analysis
- 4.1. Porters Five Forces
- 4.2. Supply/Value Chain
- 4.3. PESTEL analysis
- 4.4. Market Entropy
- 4.5. Patent/Trademark Analysis
- 5. Global Rc Power System Analysis, Insights and Forecast, 2020-2032
- 5.1. Market Analysis, Insights and Forecast - by Application
- 5.1.1. Car Model Power System
- 5.1.2. Aircraft Model Power System
- 5.1.3. Ship Model Power System
- 5.2. Market Analysis, Insights and Forecast - by Type
- 5.2.1. Professional Types
- 5.2.2. High-end Types
- 5.2.3. Economical Types
- 5.3. Market Analysis, Insights and Forecast - by Region
- 5.3.1. North America
- 5.3.2. South America
- 5.3.3. Europe
- 5.3.4. Middle East & Africa
- 5.3.5. Asia Pacific
- 5.1. Market Analysis, Insights and Forecast - by Application
- 6. North America Rc Power System Analysis, Insights and Forecast, 2020-2032
- 6.1. Market Analysis, Insights and Forecast - by Application
- 6.1.1. Car Model Power System
- 6.1.2. Aircraft Model Power System
- 6.1.3. Ship Model Power System
- 6.2. Market Analysis, Insights and Forecast - by Type
- 6.2.1. Professional Types
- 6.2.2. High-end Types
- 6.2.3. Economical Types
- 6.1. Market Analysis, Insights and Forecast - by Application
- 7. South America Rc Power System Analysis, Insights and Forecast, 2020-2032
- 7.1. Market Analysis, Insights and Forecast - by Application
- 7.1.1. Car Model Power System
- 7.1.2. Aircraft Model Power System
- 7.1.3. Ship Model Power System
- 7.2. Market Analysis, Insights and Forecast - by Type
- 7.2.1. Professional Types
- 7.2.2. High-end Types
- 7.2.3. Economical Types
- 7.1. Market Analysis, Insights and Forecast - by Application
- 8. Europe Rc Power System Analysis, Insights and Forecast, 2020-2032
- 8.1. Market Analysis, Insights and Forecast - by Application
- 8.1.1. Car Model Power System
- 8.1.2. Aircraft Model Power System
- 8.1.3. Ship Model Power System
- 8.2. Market Analysis, Insights and Forecast - by Type
- 8.2.1. Professional Types
- 8.2.2. High-end Types
- 8.2.3. Economical Types
- 8.1. Market Analysis, Insights and Forecast - by Application
- 9. Middle East & Africa Rc Power System Analysis, Insights and Forecast, 2020-2032
- 9.1. Market Analysis, Insights and Forecast - by Application
- 9.1.1. Car Model Power System
- 9.1.2. Aircraft Model Power System
- 9.1.3. Ship Model Power System
- 9.2. Market Analysis, Insights and Forecast - by Type
- 9.2.1. Professional Types
- 9.2.2. High-end Types
- 9.2.3. Economical Types
- 9.1. Market Analysis, Insights and Forecast - by Application
- 10. Asia Pacific Rc Power System Analysis, Insights and Forecast, 2020-2032
- 10.1. Market Analysis, Insights and Forecast - by Application
- 10.1.1. Car Model Power System
- 10.1.2. Aircraft Model Power System
- 10.1.3. Ship Model Power System
- 10.2. Market Analysis, Insights and Forecast - by Type
- 10.2.1. Professional Types
- 10.2.2. High-end Types
- 10.2.3. Economical Types
- 10.1. Market Analysis, Insights and Forecast - by Application
- 11. Competitive Analysis
- 11.1. Global Market Share Analysis 2025
- 11.2. Company Profiles
- 11.2.1 HOBBICO
- 11.2.1.1. Overview
- 11.2.1.2. Products
- 11.2.1.3. SWOT Analysis
- 11.2.1.4. Recent Developments
- 11.2.1.5. Financials (Based on Availability)
- 11.2.2 Turnigy
- 11.2.2.1. Overview
- 11.2.2.2. Products
- 11.2.2.3. SWOT Analysis
- 11.2.2.4. Recent Developments
- 11.2.2.5. Financials (Based on Availability)
- 11.2.3 Hobby king
- 11.2.3.1. Overview
- 11.2.3.2. Products
- 11.2.3.3. SWOT Analysis
- 11.2.3.4. Recent Developments
- 11.2.3.5. Financials (Based on Availability)
- 11.2.4 SKYRC
- 11.2.4.1. Overview
- 11.2.4.2. Products
- 11.2.4.3. SWOT Analysis
- 11.2.4.4. Recent Developments
- 11.2.4.5. Financials (Based on Availability)
- 11.2.5 Hobbywing Technology
- 11.2.5.1. Overview
- 11.2.5.2. Products
- 11.2.5.3. SWOT Analysis
- 11.2.5.4. Recent Developments
- 11.2.5.5. Financials (Based on Availability)
- 11.2.6 Nanchang Sanrui Intelligent Technology Co. Ltd.
- 11.2.6.1. Overview
- 11.2.6.2. Products
- 11.2.6.3. SWOT Analysis
- 11.2.6.4. Recent Developments
- 11.2.6.5. Financials (Based on Availability)
- 11.2.7 Shanghai Double Sky Model Co. Ltd.
- 11.2.7.1. Overview
- 11.2.7.2. Products
- 11.2.7.3. SWOT Analysis
- 11.2.7.4. Recent Developments
- 11.2.7.5. Financials (Based on Availability)
- 11.2.8 X-TEAM
- 11.2.8.1. Overview
- 11.2.8.2. Products
- 11.2.8.3. SWOT Analysis
- 11.2.8.4. Recent Developments
- 11.2.8.5. Financials (Based on Availability)
- 11.2.9 Xiongcai Technology
- 11.2.9.1. Overview
- 11.2.9.2. Products
- 11.2.9.3. SWOT Analysis
- 11.2.9.4. Recent Developments
- 11.2.9.5. Financials (Based on Availability)
- 11.2.10 Aerogenix
- 11.2.10.1. Overview
- 11.2.10.2. Products
- 11.2.10.3. SWOT Analysis
- 11.2.10.4. Recent Developments
- 11.2.10.5. Financials (Based on Availability)
- 11.2.11 Shenzhen Feiyingjiale Electronics Co. Ltd.
- 11.2.11.1. Overview
- 11.2.11.2. Products
- 11.2.11.3. SWOT Analysis
- 11.2.11.4. Recent Developments
- 11.2.11.5. Financials (Based on Availability)
- 11.2.12 Hefei land and air model
- 11.2.12.1. Overview
- 11.2.12.2. Products
- 11.2.12.3. SWOT Analysis
- 11.2.12.4. Recent Developments
- 11.2.12.5. Financials (Based on Availability)
- 11.2.13 Guangyu Electromechanical (Shanghai) Co. Ltd.
- 11.2.13.1. Overview
- 11.2.13.2. Products
- 11.2.13.3. SWOT Analysis
- 11.2.13.4. Recent Developments
- 11.2.13.5. Financials (Based on Availability)
- 11.2.14 Huavorui Electronics (Shenzhen) Co. Ltd.
- 11.2.14.1. Overview
- 11.2.14.2. Products
- 11.2.14.3. SWOT Analysis
- 11.2.14.4. Recent Developments
- 11.2.14.5. Financials (Based on Availability)
- 11.2.15 Rc Alltech Power Systems Pvt. Ltd.
- 11.2.15.1. Overview
- 11.2.15.2. Products
- 11.2.15.3. SWOT Analysis
- 11.2.15.4. Recent Developments
- 11.2.15.5. Financials (Based on Availability)
- 11.2.1 HOBBICO
List of Figures
- Figure 1: Global Rc Power System Revenue Breakdown (million, %) by Region 2025 & 2033
- Figure 2: Global Rc Power System Volume Breakdown (K, %) by Region 2025 & 2033
- Figure 3: North America Rc Power System Revenue (million), by Application 2025 & 2033
- Figure 4: North America Rc Power System Volume (K), by Application 2025 & 2033
- Figure 5: North America Rc Power System Revenue Share (%), by Application 2025 & 2033
- Figure 6: North America Rc Power System Volume Share (%), by Application 2025 & 2033
- Figure 7: North America Rc Power System Revenue (million), by Type 2025 & 2033
- Figure 8: North America Rc Power System Volume (K), by Type 2025 & 2033
- Figure 9: North America Rc Power System Revenue Share (%), by Type 2025 & 2033
- Figure 10: North America Rc Power System Volume Share (%), by Type 2025 & 2033
- Figure 11: North America Rc Power System Revenue (million), by Country 2025 & 2033
- Figure 12: North America Rc Power System Volume (K), by Country 2025 & 2033
- Figure 13: North America Rc Power System Revenue Share (%), by Country 2025 & 2033
- Figure 14: North America Rc Power System Volume Share (%), by Country 2025 & 2033
- Figure 15: South America Rc Power System Revenue (million), by Application 2025 & 2033
- Figure 16: South America Rc Power System Volume (K), by Application 2025 & 2033
- Figure 17: South America Rc Power System Revenue Share (%), by Application 2025 & 2033
- Figure 18: South America Rc Power System Volume Share (%), by Application 2025 & 2033
- Figure 19: South America Rc Power System Revenue (million), by Type 2025 & 2033
- Figure 20: South America Rc Power System Volume (K), by Type 2025 & 2033
- Figure 21: South America Rc Power System Revenue Share (%), by Type 2025 & 2033
- Figure 22: South America Rc Power System Volume Share (%), by Type 2025 & 2033
- Figure 23: South America Rc Power System Revenue (million), by Country 2025 & 2033
- Figure 24: South America Rc Power System Volume (K), by Country 2025 & 2033
- Figure 25: South America Rc Power System Revenue Share (%), by Country 2025 & 2033
- Figure 26: South America Rc Power System Volume Share (%), by Country 2025 & 2033
- Figure 27: Europe Rc Power System Revenue (million), by Application 2025 & 2033
- Figure 28: Europe Rc Power System Volume (K), by Application 2025 & 2033
- Figure 29: Europe Rc Power System Revenue Share (%), by Application 2025 & 2033
- Figure 30: Europe Rc Power System Volume Share (%), by Application 2025 & 2033
- Figure 31: Europe Rc Power System Revenue (million), by Type 2025 & 2033
- Figure 32: Europe Rc Power System Volume (K), by Type 2025 & 2033
- Figure 33: Europe Rc Power System Revenue Share (%), by Type 2025 & 2033
- Figure 34: Europe Rc Power System Volume Share (%), by Type 2025 & 2033
- Figure 35: Europe Rc Power System Revenue (million), by Country 2025 & 2033
- Figure 36: Europe Rc Power System Volume (K), by Country 2025 & 2033
- Figure 37: Europe Rc Power System Revenue Share (%), by Country 2025 & 2033
- Figure 38: Europe Rc Power System Volume Share (%), by Country 2025 & 2033
- Figure 39: Middle East & Africa Rc Power System Revenue (million), by Application 2025 & 2033
- Figure 40: Middle East & Africa Rc Power System Volume (K), by Application 2025 & 2033
- Figure 41: Middle East & Africa Rc Power System Revenue Share (%), by Application 2025 & 2033
- Figure 42: Middle East & Africa Rc Power System Volume Share (%), by Application 2025 & 2033
- Figure 43: Middle East & Africa Rc Power System Revenue (million), by Type 2025 & 2033
- Figure 44: Middle East & Africa Rc Power System Volume (K), by Type 2025 & 2033
- Figure 45: Middle East & Africa Rc Power System Revenue Share (%), by Type 2025 & 2033
- Figure 46: Middle East & Africa Rc Power System Volume Share (%), by Type 2025 & 2033
- Figure 47: Middle East & Africa Rc Power System Revenue (million), by Country 2025 & 2033
- Figure 48: Middle East & Africa Rc Power System Volume (K), by Country 2025 & 2033
- Figure 49: Middle East & Africa Rc Power System Revenue Share (%), by Country 2025 & 2033
- Figure 50: Middle East & Africa Rc Power System Volume Share (%), by Country 2025 & 2033
- Figure 51: Asia Pacific Rc Power System Revenue (million), by Application 2025 & 2033
- Figure 52: Asia Pacific Rc Power System Volume (K), by Application 2025 & 2033
- Figure 53: Asia Pacific Rc Power System Revenue Share (%), by Application 2025 & 2033
- Figure 54: Asia Pacific Rc Power System Volume Share (%), by Application 2025 & 2033
- Figure 55: Asia Pacific Rc Power System Revenue (million), by Type 2025 & 2033
- Figure 56: Asia Pacific Rc Power System Volume (K), by Type 2025 & 2033
- Figure 57: Asia Pacific Rc Power System Revenue Share (%), by Type 2025 & 2033
- Figure 58: Asia Pacific Rc Power System Volume Share (%), by Type 2025 & 2033
- Figure 59: Asia Pacific Rc Power System Revenue (million), by Country 2025 & 2033
- Figure 60: Asia Pacific Rc Power System Volume (K), by Country 2025 & 2033
- Figure 61: Asia Pacific Rc Power System Revenue Share (%), by Country 2025 & 2033
- Figure 62: Asia Pacific Rc Power System Volume Share (%), by Country 2025 & 2033
List of Tables
- Table 1: Global Rc Power System Revenue million Forecast, by Application 2020 & 2033
- Table 2: Global Rc Power System Volume K Forecast, by Application 2020 & 2033
- Table 3: Global Rc Power System Revenue million Forecast, by Type 2020 & 2033
- Table 4: Global Rc Power System Volume K Forecast, by Type 2020 & 2033
- Table 5: Global Rc Power System Revenue million Forecast, by Region 2020 & 2033
- Table 6: Global Rc Power System Volume K Forecast, by Region 2020 & 2033
- Table 7: Global Rc Power System Revenue million Forecast, by Application 2020 & 2033
- Table 8: Global Rc Power System Volume K Forecast, by Application 2020 & 2033
- Table 9: Global Rc Power System Revenue million Forecast, by Type 2020 & 2033
- Table 10: Global Rc Power System Volume K Forecast, by Type 2020 & 2033
- Table 11: Global Rc Power System Revenue million Forecast, by Country 2020 & 2033
- Table 12: Global Rc Power System Volume K Forecast, by Country 2020 & 2033
- Table 13: United States Rc Power System Revenue (million) Forecast, by Application 2020 & 2033
- Table 14: United States Rc Power System Volume (K) Forecast, by Application 2020 & 2033
- Table 15: Canada Rc Power System Revenue (million) Forecast, by Application 2020 & 2033
- Table 16: Canada Rc Power System Volume (K) Forecast, by Application 2020 & 2033
- Table 17: Mexico Rc Power System Revenue (million) Forecast, by Application 2020 & 2033
- Table 18: Mexico Rc Power System Volume (K) Forecast, by Application 2020 & 2033
- Table 19: Global Rc Power System Revenue million Forecast, by Application 2020 & 2033
- Table 20: Global Rc Power System Volume K Forecast, by Application 2020 & 2033
- Table 21: Global Rc Power System Revenue million Forecast, by Type 2020 & 2033
- Table 22: Global Rc Power System Volume K Forecast, by Type 2020 & 2033
- Table 23: Global Rc Power System Revenue million Forecast, by Country 2020 & 2033
- Table 24: Global Rc Power System Volume K Forecast, by Country 2020 & 2033
- Table 25: Brazil Rc Power System Revenue (million) Forecast, by Application 2020 & 2033
- Table 26: Brazil Rc Power System Volume (K) Forecast, by Application 2020 & 2033
- Table 27: Argentina Rc Power System Revenue (million) Forecast, by Application 2020 & 2033
- Table 28: Argentina Rc Power System Volume (K) Forecast, by Application 2020 & 2033
- Table 29: Rest of South America Rc Power System Revenue (million) Forecast, by Application 2020 & 2033
- Table 30: Rest of South America Rc Power System Volume (K) Forecast, by Application 2020 & 2033
- Table 31: Global Rc Power System Revenue million Forecast, by Application 2020 & 2033
- Table 32: Global Rc Power System Volume K Forecast, by Application 2020 & 2033
- Table 33: Global Rc Power System Revenue million Forecast, by Type 2020 & 2033
- Table 34: Global Rc Power System Volume K Forecast, by Type 2020 & 2033
- Table 35: Global Rc Power System Revenue million Forecast, by Country 2020 & 2033
- Table 36: Global Rc Power System Volume K Forecast, by Country 2020 & 2033
- Table 37: United Kingdom Rc Power System Revenue (million) Forecast, by Application 2020 & 2033
- Table 38: United Kingdom Rc Power System Volume (K) Forecast, by Application 2020 & 2033
- Table 39: Germany Rc Power System Revenue (million) Forecast, by Application 2020 & 2033
- Table 40: Germany Rc Power System Volume (K) Forecast, by Application 2020 & 2033
- Table 41: France Rc Power System Revenue (million) Forecast, by Application 2020 & 2033
- Table 42: France Rc Power System Volume (K) Forecast, by Application 2020 & 2033
- Table 43: Italy Rc Power System Revenue (million) Forecast, by Application 2020 & 2033
- Table 44: Italy Rc Power System Volume (K) Forecast, by Application 2020 & 2033
- Table 45: Spain Rc Power System Revenue (million) Forecast, by Application 2020 & 2033
- Table 46: Spain Rc Power System Volume (K) Forecast, by Application 2020 & 2033
- Table 47: Russia Rc Power System Revenue (million) Forecast, by Application 2020 & 2033
- Table 48: Russia Rc Power System Volume (K) Forecast, by Application 2020 & 2033
- Table 49: Benelux Rc Power System Revenue (million) Forecast, by Application 2020 & 2033
- Table 50: Benelux Rc Power System Volume (K) Forecast, by Application 2020 & 2033
- Table 51: Nordics Rc Power System Revenue (million) Forecast, by Application 2020 & 2033
- Table 52: Nordics Rc Power System Volume (K) Forecast, by Application 2020 & 2033
- Table 53: Rest of Europe Rc Power System Revenue (million) Forecast, by Application 2020 & 2033
- Table 54: Rest of Europe Rc Power System Volume (K) Forecast, by Application 2020 & 2033
- Table 55: Global Rc Power System Revenue million Forecast, by Application 2020 & 2033
- Table 56: Global Rc Power System Volume K Forecast, by Application 2020 & 2033
- Table 57: Global Rc Power System Revenue million Forecast, by Type 2020 & 2033
- Table 58: Global Rc Power System Volume K Forecast, by Type 2020 & 2033
- Table 59: Global Rc Power System Revenue million Forecast, by Country 2020 & 2033
- Table 60: Global Rc Power System Volume K Forecast, by Country 2020 & 2033
- Table 61: Turkey Rc Power System Revenue (million) Forecast, by Application 2020 & 2033
- Table 62: Turkey Rc Power System Volume (K) Forecast, by Application 2020 & 2033
- Table 63: Israel Rc Power System Revenue (million) Forecast, by Application 2020 & 2033
- Table 64: Israel Rc Power System Volume (K) Forecast, by Application 2020 & 2033
- Table 65: GCC Rc Power System Revenue (million) Forecast, by Application 2020 & 2033
- Table 66: GCC Rc Power System Volume (K) Forecast, by Application 2020 & 2033
- Table 67: North Africa Rc Power System Revenue (million) Forecast, by Application 2020 & 2033
- Table 68: North Africa Rc Power System Volume (K) Forecast, by Application 2020 & 2033
- Table 69: South Africa Rc Power System Revenue (million) Forecast, by Application 2020 & 2033
- Table 70: South Africa Rc Power System Volume (K) Forecast, by Application 2020 & 2033
- Table 71: Rest of Middle East & Africa Rc Power System Revenue (million) Forecast, by Application 2020 & 2033
- Table 72: Rest of Middle East & Africa Rc Power System Volume (K) Forecast, by Application 2020 & 2033
- Table 73: Global Rc Power System Revenue million Forecast, by Application 2020 & 2033
- Table 74: Global Rc Power System Volume K Forecast, by Application 2020 & 2033
- Table 75: Global Rc Power System Revenue million Forecast, by Type 2020 & 2033
- Table 76: Global Rc Power System Volume K Forecast, by Type 2020 & 2033
- Table 77: Global Rc Power System Revenue million Forecast, by Country 2020 & 2033
- Table 78: Global Rc Power System Volume K Forecast, by Country 2020 & 2033
- Table 79: China Rc Power System Revenue (million) Forecast, by Application 2020 & 2033
- Table 80: China Rc Power System Volume (K) Forecast, by Application 2020 & 2033
- Table 81: India Rc Power System Revenue (million) Forecast, by Application 2020 & 2033
- Table 82: India Rc Power System Volume (K) Forecast, by Application 2020 & 2033
- Table 83: Japan Rc Power System Revenue (million) Forecast, by Application 2020 & 2033
- Table 84: Japan Rc Power System Volume (K) Forecast, by Application 2020 & 2033
- Table 85: South Korea Rc Power System Revenue (million) Forecast, by Application 2020 & 2033
- Table 86: South Korea Rc Power System Volume (K) Forecast, by Application 2020 & 2033
- Table 87: ASEAN Rc Power System Revenue (million) Forecast, by Application 2020 & 2033
- Table 88: ASEAN Rc Power System Volume (K) Forecast, by Application 2020 & 2033
- Table 89: Oceania Rc Power System Revenue (million) Forecast, by Application 2020 & 2033
- Table 90: Oceania Rc Power System Volume (K) Forecast, by Application 2020 & 2033
- Table 91: Rest of Asia Pacific Rc Power System Revenue (million) Forecast, by Application 2020 & 2033
- Table 92: Rest of Asia Pacific Rc Power System Volume (K) Forecast, by Application 2020 & 2033
Frequently Asked Questions
1. What is the projected Compound Annual Growth Rate (CAGR) of the Rc Power System?
The projected CAGR is approximately 4.2%.
2. Which companies are prominent players in the Rc Power System?
Key companies in the market include HOBBICO, Turnigy, Hobby king, SKYRC, Hobbywing Technology, Nanchang Sanrui Intelligent Technology Co., Ltd., Shanghai Double Sky Model Co., Ltd., X-TEAM, Xiongcai Technology, Aerogenix, Shenzhen Feiyingjiale Electronics Co., Ltd., Hefei land and air model, Guangyu Electromechanical (Shanghai) Co., Ltd., Huavorui Electronics (Shenzhen) Co., Ltd., Rc Alltech Power Systems Pvt. Ltd..
3. What are the main segments of the Rc Power System?
The market segments include Application, Type.
4. Can you provide details about the market size?
The market size is estimated to be USD 454 million as of 2022.
5. What are some drivers contributing to market growth?
N/A
6. What are the notable trends driving market growth?
N/A
7. Are there any restraints impacting market growth?
N/A
8. Can you provide examples of recent developments in the market?
N/A
9. What pricing options are available for accessing the report?
Pricing options include single-user, multi-user, and enterprise licenses priced at USD 3950.00, USD 5925.00, and USD 7900.00 respectively.
10. Is the market size provided in terms of value or volume?
The market size is provided in terms of value, measured in million and volume, measured in K.
11. Are there any specific market keywords associated with the report?
Yes, the market keyword associated with the report is "Rc Power System," which aids in identifying and referencing the specific market segment covered.
12. How do I determine which pricing option suits my needs best?
The pricing options vary based on user requirements and access needs. Individual users may opt for single-user licenses, while businesses requiring broader access may choose multi-user or enterprise licenses for cost-effective access to the report.
13. Are there any additional resources or data provided in the Rc Power System report?
While the report offers comprehensive insights, it's advisable to review the specific contents or supplementary materials provided to ascertain if additional resources or data are available.
14. How can I stay updated on further developments or reports in the Rc Power System?
To stay informed about further developments, trends, and reports in the Rc Power System, consider subscribing to industry newsletters, following relevant companies and organizations, or regularly checking reputable industry news sources and publications.
Methodology
Step 1 - Identification of Relevant Samples Size from Population Database


Step 2 - Approaches for Defining Global Market Size (Value, Volume* & Price*)

Note*: In applicable scenarios
Step 3 - Data Sources
Primary Research
- Web Analytics
- Survey Reports
- Research Institute
- Latest Research Reports
- Opinion Leaders
Secondary Research
- Annual Reports
- White Paper
- Latest Press Release
- Industry Association
- Paid Database
- Investor Presentations

Step 4 - Data Triangulation
Involves using different sources of information in order to increase the validity of a study
These sources are likely to be stakeholders in a program - participants, other researchers, program staff, other community members, and so on.
Then we put all data in single framework & apply various statistical tools to find out the dynamic on the market.
During the analysis stage, feedback from the stakeholder groups would be compared to determine areas of agreement as well as areas of divergence