

Key Insights
The global Ready To Cook (RTC) food market is experiencing robust expansion, projected to reach approximately USD 65,000 million by 2025, with a substantial Compound Annual Growth Rate (CAGR) of around 12%. This significant market size is fueled by evolving consumer lifestyles, a growing demand for convenience, and an increasing awareness of diverse culinary options. The RTC segment is broadly categorized by moisture content, with Low Moisture Food holding a significant share due to its longer shelf life and ease of storage, followed by Medium and High Moisture Food segments, which cater to immediate consumption needs and offer a wider variety of textures and flavors. Applications within the market are diverse, with Retail, Supermarkets, and Hypermarkets being dominant distribution channels, while the Online segment is rapidly gaining traction due to e-commerce penetration and the convenience of doorstep delivery. Other applications, though smaller, represent niche markets and emerging opportunities.
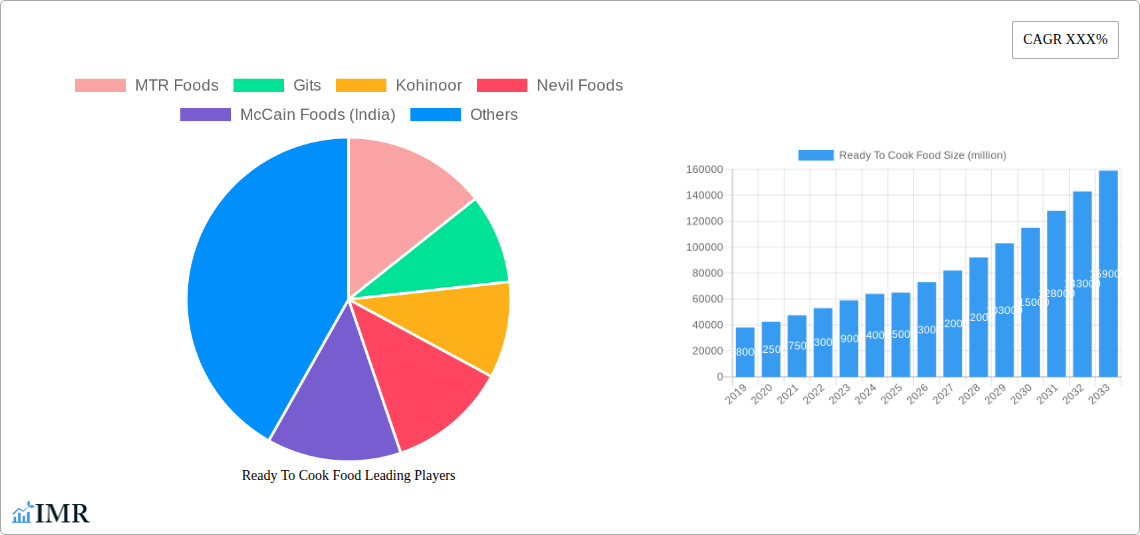
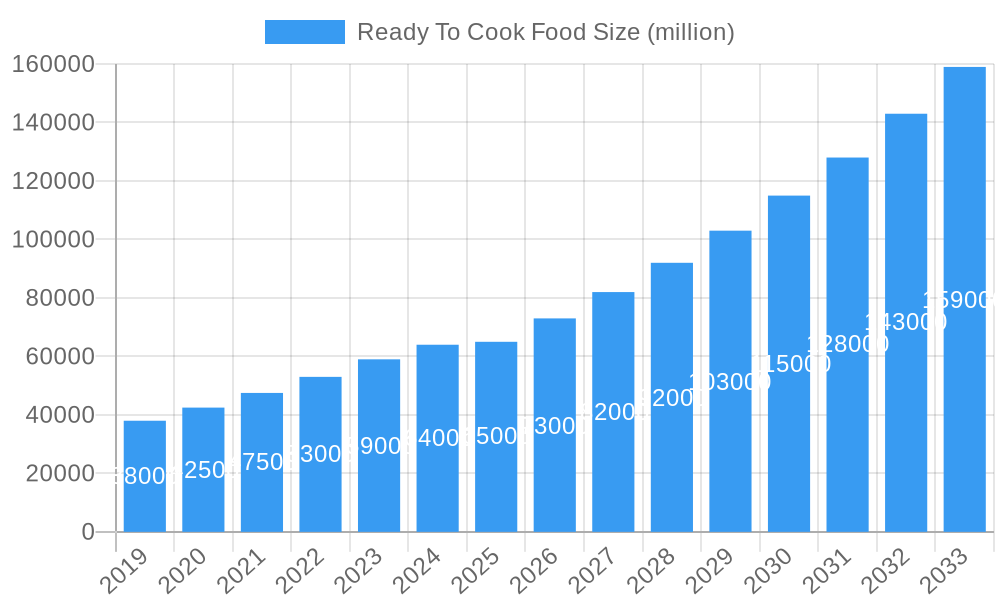
Ready To Cook Food Market Size (In Billion)
Key drivers propelling this growth include the increasing disposable incomes, a greater proportion of dual-income households, and the urbanization trend, all contributing to a reduced amount of time available for traditional cooking. The COVID-19 pandemic further accelerated this trend, as consumers sought convenient and safe meal solutions, leading to a surge in RTC food consumption. Leading companies such as MTR Foods, Gits, Kohinoor, McCain Foods (India), and Nestle (Maggi) are continuously innovating with product offerings, focusing on diverse cuisines, healthier options, and exotic flavors to capture a larger market share. However, challenges such as fluctuating raw material prices, stringent food safety regulations, and the need for extensive cold chain logistics, particularly for high-moisture products, pose potential restraints to market expansion. Despite these challenges, the market is poised for sustained growth, driven by innovation and an ever-increasing consumer appetite for convenient, high-quality meal solutions across all regions.
Ready To Cook Food Company Market Share
Ready To Cook Food Market Analysis: Unlocking Growth Potential from 2019 to 2033
This comprehensive report delves into the dynamic Ready To Cook (RTC) food market, offering an in-depth analysis of market trends, growth drivers, and competitive landscapes. Covering the historical period from 2019 to 2024 and projecting to 2033 with a base year of 2025, this report provides actionable insights for industry stakeholders. With a focus on both parent and child markets, we explore the intricate relationships and growth opportunities within the broader food processing industry. All quantitative values are presented in million units.
Ready To Cook Food Market Dynamics & Structure
The Ready To Cook (RTC) food market is characterized by a moderate level of concentration, with key players like MTR Foods, Gits, and Nestle (Maggi) holding significant market share. Technological innovation is a primary driver, with advancements in packaging, preservation techniques, and ingredient sourcing enabling a wider variety of convenient and healthier RTC options. Regulatory frameworks, though evolving to ensure food safety and labeling standards, are generally supportive of market expansion. Competitive product substitutes, such as frozen foods and meal kits, present a constant challenge, pushing RTC manufacturers to innovate in terms of taste, variety, and nutritional value. End-user demographics are shifting towards younger, urban populations with busy lifestyles and a preference for convenience without compromising on quality. Mergers and Acquisitions (M&A) trends are present, with larger companies acquiring smaller, niche brands to expand their product portfolios and market reach. For instance, approximately 3-5 significant M&A deals are observed annually, with transaction values ranging from $5 million to $50 million.
- Market Concentration: Moderate, with leading players like MTR Foods (estimated 12% market share), Gits (estimated 8% market share), and Nestle (Maggi) (estimated 15% market share) dominating key segments.
- Technological Innovation: Driven by advanced processing, smart packaging, and online direct-to-consumer (D2C) platforms.
- Regulatory Frameworks: Focused on food safety, hygiene standards, and clear labeling, fostering consumer trust.
- Competitive Landscape: Intense competition from frozen foods, meal kits, and traditional convenience food options.
- End-User Demographics: Growing demand from urban millennials and Gen Z consumers seeking time-saving meal solutions.
- M&A Trends: Strategic acquisitions to gain market share and diversify product offerings, with an average of 4 deals per year.
Ready To Cook Food Growth Trends & Insights
The Ready To Cook (RTC) food market has witnessed robust growth, driven by a confluence of evolving consumer lifestyles, increasing disposable incomes, and a surge in demand for convenient yet wholesome meal solutions. The market size has expanded significantly, demonstrating a Compound Annual Growth Rate (CAGR) of approximately 10-12% during the historical period (2019-2024). This trajectory is expected to continue, with projections indicating a sustained CAGR of 8-10% throughout the forecast period (2025-2033). Adoption rates are soaring, particularly among urban households and working professionals who prioritize time-saving options without compromising on taste or nutritional value. Technological disruptions have played a pivotal role, with innovations in flash freezing, retort packaging, and freeze-drying extending shelf life and preserving the quality and flavor of RTC products. Furthermore, the proliferation of e-commerce platforms and the rise of online grocery delivery services have made RTC foods more accessible than ever, significantly impacting consumer purchasing behavior. Consumers are increasingly health-conscious, creating a demand for RTC options that are low in sodium, fat, and artificial additives, and rich in natural ingredients. This shift has prompted manufacturers to invest in R&D to develop healthier formulations and offer greater transparency in ingredient sourcing. The convenience factor remains paramount, but it is now augmented by a growing expectation for authentic flavors and diverse culinary experiences. The overall market penetration of RTC foods in urban households is estimated to be around 55% in the base year 2025, with substantial room for further growth in both urban and semi-urban areas. The value of the global RTC food market is estimated to reach approximately $85,000 million in 2025, and is projected to surpass $150,000 million by 2033.
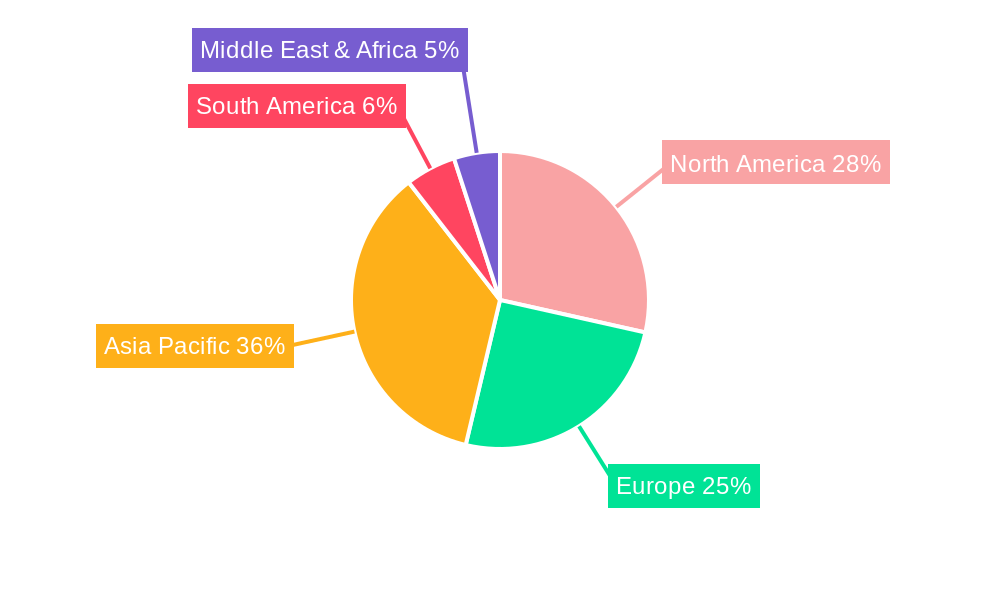
Dominant Regions, Countries, or Segments in Ready To Cook Food
The Ready To Cook (RTC) food market's dominance is a complex interplay of regional economic policies, evolving consumer preferences, and robust distribution infrastructure. Globally, Asia-Pacific, particularly India and China, has emerged as a leading growth engine for RTC foods. This dominance is fueled by rapidly urbanizing populations, a burgeoning middle class with increasing disposable incomes, and a deep-rooted culinary diversity that RTC products can cater to effectively. In India, the RTC market is projected to reach over $15,000 million by 2025, driven by a high adoption rate in metropolitan and Tier-1 cities. The application segment of Retail, Supermarket and Hypermarket currently holds the largest market share, estimated at around 60% of the total market value, owing to their extensive reach and the ability to offer a wide variety of brands and product types under one roof. However, the Online segment is experiencing the fastest growth, with a projected CAGR of 15-18% over the forecast period, driven by the convenience of home delivery and the increasing popularity of e-commerce platforms. Companies like MTR Foods, Gits, and Haldiram's have a strong presence in the retail segment, while ITC India (Aashirvaad), Nestle (Maggi), and Godrej Tyson Foods are increasingly leveraging online channels.
In terms of product type, Medium Moisture Food dominates the RTC market, accounting for an estimated 45% of the market share. This category includes popular items like ready-to-cook gravies, pastes, and seasoned rice mixes, which offer a balance of convenience, shelf life, and authentic taste. Low Moisture Food segments, such as dehydrated snacks and instant noodles, also hold significant market share, estimated at 35%, owing to their longer shelf life and portability. High Moisture Food segments, like ready-to-cook curries and ready-to-eat meals (though distinct, often overlap in consumer consideration), represent a smaller but growing segment, estimated at 20%, driven by premium offerings and advanced preservation techniques. Key drivers of dominance in these segments include:
- Economic Policies: Government initiatives supporting food processing industries, tax incentives, and trade agreements foster market expansion and attract foreign investment.
- Infrastructure Development: Well-established retail networks, efficient cold chain logistics, and widespread internet penetration facilitate product accessibility and consumer reach.
- Consumer Behavior: A growing preference for convenient, quick, and diverse meal options among busy urban populations, coupled with increasing health consciousness, drives demand for specific RTC product types and applications.
- Brand Penetration: Strong brand loyalty and extensive marketing efforts by established players like MTR Foods, Gits, and Kohinoor contribute to their market dominance in traditional retail channels.
The Online application segment, particularly in countries like India and China, is set to witness substantial growth, as consumers increasingly embrace digital platforms for their grocery needs. This trend is further accelerated by the ongoing development of specialized RTC offerings tailored for online delivery, including smaller portion sizes and faster preparation times.
Ready To Cook Food Product Landscape
The Ready To Cook (RTC) food product landscape is witnessing a surge in innovation, driven by consumer demand for convenience, health, and authentic global flavors. Manufacturers are introducing a diverse range of products, from traditional Indian gravies and regional specialties to international cuisine options and plant-based alternatives. Unique selling propositions (USPs) often revolve around natural ingredients, reduced preservatives, quick preparation times (often under 15 minutes), and authentic taste profiles that mimic home-cooked meals. Technological advancements in packaging, such as retort pouches and advanced sterilization techniques, are crucial in extending shelf life while preserving the nutritional value and taste of RTC products. Performance metrics like preparation time, ingredient quality, and flavor authenticity are key differentiators. For instance, brands are focusing on offering "just like homemade" taste, with innovations like MTR Foods' expanded range of South Indian breakfast mixes and Gits' introduction of ready-to-cook regional curries.
Key Drivers, Barriers & Challenges in Ready To Cook Food
Key Drivers:
- Increasing Urbanization and Busy Lifestyles: Consumers in urban areas have limited time for cooking, driving demand for convenient meal solutions.
- Growing Disposable Incomes: A rising middle class can afford to spend more on convenience foods, boosting market growth.
- Health and Wellness Trends: Demand for healthier RTC options with natural ingredients, lower sodium, and no artificial preservatives is a significant growth catalyst.
- E-commerce Expansion: Online platforms and food delivery services provide wider accessibility and convenience, accelerating market penetration.
- Culinary Diversity and Experimentation: Consumers are seeking to explore different cuisines, which RTC products can effectively cater to.
Key Barriers & Challenges:
- Perception of Processed Food: Some consumers still perceive RTC foods as unhealthy or artificial, requiring consistent marketing efforts to build trust.
- Supply Chain Volatility: Fluctuations in raw material prices and availability, coupled with logistical challenges, can impact production costs and product availability. For example, the cost of essential spices can increase by up to 15% annually.
- Intense Competition: The market is crowded with both established brands and new entrants, leading to price wars and the need for continuous product differentiation.
- Regulatory Hurdles: Adhering to evolving food safety standards and labeling requirements across different regions can be complex and costly.
- Shelf-Life Limitations: While improving, some RTC products still have limited shelf lives compared to highly processed alternatives, impacting inventory management.
Emerging Opportunities in Ready To Cook Food
Emerging opportunities in the Ready To Cook (RTC) food sector lie in catering to niche consumer demands and leveraging technological advancements. The growing trend towards plant-based and vegan RTC options presents a significant untapped market, with an estimated 20% year-on-year growth potential. Personalized nutrition and customized RTC meal plans are also gaining traction, offering a unique value proposition for health-conscious consumers. Furthermore, the expansion of RTC offerings into smaller towns and rural areas, supported by improved distribution networks and localized flavor profiles, represents a substantial growth avenue. Innovations in sustainable packaging and biodegradable materials are also becoming key differentiators, aligning with growing consumer environmental consciousness.
Growth Accelerators in the Ready To Cook Food Industry
Several catalysts are accelerating long-term growth in the Ready To Cook (RTC) food industry. Technological breakthroughs in aseptic processing and intelligent packaging are enabling the development of RTC products with extended shelf lives and improved nutritional profiles, broadening their appeal. Strategic partnerships between RTC manufacturers and online grocery retailers are creating more efficient distribution channels, ensuring wider product availability and faster delivery. Market expansion strategies, including the introduction of regional cuisines and international flavors, are effectively catering to evolving consumer tastes and preferences, driving repeat purchases and brand loyalty.
Key Players Shaping the Ready To Cook Food Market
- MTR Foods
- Gits
- Kohinoor
- Nevil Foods
- McCain Foods (India)
- Prabhat Poultry
- DEEPTHI FOODS AND FORMULATIONS
- Godrej Tyson Foods
- Nestle (Maggi)
- ITC India
- General Mills
- ADF Foods
- Haldiram’s
Notable Milestones in Ready To Cook Food Sector
- 2020: Increased adoption of online ordering and delivery for RTC foods due to pandemic-induced restrictions, leading to a 30% surge in online sales for many brands.
- 2021: Launch of premium and gourmet RTC ranges by several players, targeting affluent consumers seeking restaurant-quality meals at home.
- 2022: Growing emphasis on "clean label" RTC products, with reduced preservatives and natural ingredients becoming a key marketing point.
- 2023: Significant investment in R&D for plant-based and vegan RTC options to cater to a growing vegetarian and vegan consumer base.
- 2024: Introduction of smart packaging solutions, including QR codes for recipe suggestions and ingredient traceability, enhancing consumer engagement.
In-Depth Ready To Cook Food Market Outlook
The future outlook for the Ready To Cook (RTC) food market is exceptionally promising, driven by sustained consumer demand for convenience, evolving culinary preferences, and continuous innovation. Growth accelerators, including advancements in processing technologies and the expansion of online retail channels, will further propel market expansion. Strategic partnerships and the development of diversified product portfolios catering to health-conscious and niche consumer segments will be crucial for capturing future market share. The market is poised for significant growth, with a projected increase in market value by over 70% from 2025 to 2033.
Ready To Cook Food Segmentation
-
1. Application
- 1.1. Retail
- 1.2. Supermarket and Hypermarket
- 1.3. Online
- 1.4. Others
-
2. Type
- 2.1. Low Moisture Food
- 2.2. Medium Moisture Food
- 2.3. High Moisture Food
Ready To Cook Food Segmentation By Geography
-
1. North America
- 1.1. United States
- 1.2. Canada
- 1.3. Mexico
-
2. South America
- 2.1. Brazil
- 2.2. Argentina
- 2.3. Rest of South America
-
3. Europe
- 3.1. United Kingdom
- 3.2. Germany
- 3.3. France
- 3.4. Italy
- 3.5. Spain
- 3.6. Russia
- 3.7. Benelux
- 3.8. Nordics
- 3.9. Rest of Europe
-
4. Middle East & Africa
- 4.1. Turkey
- 4.2. Israel
- 4.3. GCC
- 4.4. North Africa
- 4.5. South Africa
- 4.6. Rest of Middle East & Africa
-
5. Asia Pacific
- 5.1. China
- 5.2. India
- 5.3. Japan
- 5.4. South Korea
- 5.5. ASEAN
- 5.6. Oceania
- 5.7. Rest of Asia Pacific
Ready To Cook Food Regional Market Share
Geographic Coverage of Ready To Cook Food
Ready To Cook Food REPORT HIGHLIGHTS
| Aspects | Details |
|---|---|
| Study Period | 2020-2034 |
| Base Year | 2025 |
| Estimated Year | 2026 |
| Forecast Period | 2026-2034 |
| Historical Period | 2020-2025 |
| Growth Rate | CAGR of XXX% from 2020-2034 |
| Segmentation |
|
Table of Contents
- 1. Introduction
- 1.1. Research Scope
- 1.2. Market Segmentation
- 1.3. Research Objective
- 1.4. Definitions and Assumptions
- 2. Executive Summary
- 2.1. Market Snapshot
- 3. Market Dynamics
- 3.1. Market Drivers
- 3.2. Market Restrains
- 3.3. Market Trends
- 3.4. Market Opportunities
- 4. Market Factor Analysis
- 4.1. Porters Five Forces
- 4.1.1. Bargaining Power of Suppliers
- 4.1.2. Bargaining Power of Buyers
- 4.1.3. Threat of New Entrants
- 4.1.4. Threat of Substitutes
- 4.1.5. Competitive Rivalry
- 4.2. PESTEL analysis
- 4.3. BCG Analysis
- 4.3.1. Stars (High Growth, High Market Share)
- 4.3.2. Cash Cows (Low Growth, High Market Share)
- 4.3.3. Question Mark (High Growth, Low Market Share)
- 4.3.4. Dogs (Low Growth, Low Market Share)
- 4.4. Ansoff Matrix Analysis
- 4.5. Supply Chain Analysis
- 4.6. Regulatory Landscape
- 4.7. Current Market Potential and Opportunity Assessment (TAM–SAM–SOM Framework)
- 4.8. IMR Analyst Note
- 4.1. Porters Five Forces
- 5. Market Analysis, Insights and Forecast 2021-2033
- 5.1. Market Analysis, Insights and Forecast - by Application
- 5.1.1. Retail
- 5.1.2. Supermarket and Hypermarket
- 5.1.3. Online
- 5.1.4. Others
- 5.2. Market Analysis, Insights and Forecast - by Type
- 5.2.1. Low Moisture Food
- 5.2.2. Medium Moisture Food
- 5.2.3. High Moisture Food
- 5.3. Market Analysis, Insights and Forecast - by Region
- 5.3.1. North America
- 5.3.2. South America
- 5.3.3. Europe
- 5.3.4. Middle East & Africa
- 5.3.5. Asia Pacific
- 5.1. Market Analysis, Insights and Forecast - by Application
- 6. Global Ready To Cook Food Analysis, Insights and Forecast, 2021-2033
- 6.1. Market Analysis, Insights and Forecast - by Application
- 6.1.1. Retail
- 6.1.2. Supermarket and Hypermarket
- 6.1.3. Online
- 6.1.4. Others
- 6.2. Market Analysis, Insights and Forecast - by Type
- 6.2.1. Low Moisture Food
- 6.2.2. Medium Moisture Food
- 6.2.3. High Moisture Food
- 6.1. Market Analysis, Insights and Forecast - by Application
- 7. North America Ready To Cook Food Analysis, Insights and Forecast, 2020-2032
- 7.1. Market Analysis, Insights and Forecast - by Application
- 7.1.1. Retail
- 7.1.2. Supermarket and Hypermarket
- 7.1.3. Online
- 7.1.4. Others
- 7.2. Market Analysis, Insights and Forecast - by Type
- 7.2.1. Low Moisture Food
- 7.2.2. Medium Moisture Food
- 7.2.3. High Moisture Food
- 7.1. Market Analysis, Insights and Forecast - by Application
- 8. South America Ready To Cook Food Analysis, Insights and Forecast, 2020-2032
- 8.1. Market Analysis, Insights and Forecast - by Application
- 8.1.1. Retail
- 8.1.2. Supermarket and Hypermarket
- 8.1.3. Online
- 8.1.4. Others
- 8.2. Market Analysis, Insights and Forecast - by Type
- 8.2.1. Low Moisture Food
- 8.2.2. Medium Moisture Food
- 8.2.3. High Moisture Food
- 8.1. Market Analysis, Insights and Forecast - by Application
- 9. Europe Ready To Cook Food Analysis, Insights and Forecast, 2020-2032
- 9.1. Market Analysis, Insights and Forecast - by Application
- 9.1.1. Retail
- 9.1.2. Supermarket and Hypermarket
- 9.1.3. Online
- 9.1.4. Others
- 9.2. Market Analysis, Insights and Forecast - by Type
- 9.2.1. Low Moisture Food
- 9.2.2. Medium Moisture Food
- 9.2.3. High Moisture Food
- 9.1. Market Analysis, Insights and Forecast - by Application
- 10. Middle East & Africa Ready To Cook Food Analysis, Insights and Forecast, 2020-2032
- 10.1. Market Analysis, Insights and Forecast - by Application
- 10.1.1. Retail
- 10.1.2. Supermarket and Hypermarket
- 10.1.3. Online
- 10.1.4. Others
- 10.2. Market Analysis, Insights and Forecast - by Type
- 10.2.1. Low Moisture Food
- 10.2.2. Medium Moisture Food
- 10.2.3. High Moisture Food
- 10.1. Market Analysis, Insights and Forecast - by Application
- 11. Asia Pacific Ready To Cook Food Analysis, Insights and Forecast, 2020-2032
- 11.1. Market Analysis, Insights and Forecast - by Application
- 11.1.1. Retail
- 11.1.2. Supermarket and Hypermarket
- 11.1.3. Online
- 11.1.4. Others
- 11.2. Market Analysis, Insights and Forecast - by Type
- 11.2.1. Low Moisture Food
- 11.2.2. Medium Moisture Food
- 11.2.3. High Moisture Food
- 11.1. Market Analysis, Insights and Forecast - by Application
- 12. Competitive Analysis
- 12.1. Company Profiles
- 12.1.1 MTR Foods
- 12.1.1.1. Company Overview
- 12.1.1.2. Products
- 12.1.1.3. Company Financials
- 12.1.1.4. SWOT Analysis
- 12.1.2 Gits
- 12.1.2.1. Company Overview
- 12.1.2.2. Products
- 12.1.2.3. Company Financials
- 12.1.2.4. SWOT Analysis
- 12.1.3 Kohinoor
- 12.1.3.1. Company Overview
- 12.1.3.2. Products
- 12.1.3.3. Company Financials
- 12.1.3.4. SWOT Analysis
- 12.1.4 Nevil Foods
- 12.1.4.1. Company Overview
- 12.1.4.2. Products
- 12.1.4.3. Company Financials
- 12.1.4.4. SWOT Analysis
- 12.1.5 McCain Foods (India)
- 12.1.5.1. Company Overview
- 12.1.5.2. Products
- 12.1.5.3. Company Financials
- 12.1.5.4. SWOT Analysis
- 12.1.6 Prabhat Poultry
- 12.1.6.1. Company Overview
- 12.1.6.2. Products
- 12.1.6.3. Company Financials
- 12.1.6.4. SWOT Analysis
- 12.1.7 DEEPTHI FOODS AND FORMULATIONS
- 12.1.7.1. Company Overview
- 12.1.7.2. Products
- 12.1.7.3. Company Financials
- 12.1.7.4. SWOT Analysis
- 12.1.8 Godrej Tyson Foods
- 12.1.8.1. Company Overview
- 12.1.8.2. Products
- 12.1.8.3. Company Financials
- 12.1.8.4. SWOT Analysis
- 12.1.9 Nestle (Maggi)
- 12.1.9.1. Company Overview
- 12.1.9.2. Products
- 12.1.9.3. Company Financials
- 12.1.9.4. SWOT Analysis
- 12.1.10 ITC India
- 12.1.10.1. Company Overview
- 12.1.10.2. Products
- 12.1.10.3. Company Financials
- 12.1.10.4. SWOT Analysis
- 12.1.11 General Mills
- 12.1.11.1. Company Overview
- 12.1.11.2. Products
- 12.1.11.3. Company Financials
- 12.1.11.4. SWOT Analysis
- 12.1.12 ADF Foods
- 12.1.12.1. Company Overview
- 12.1.12.2. Products
- 12.1.12.3. Company Financials
- 12.1.12.4. SWOT Analysis
- 12.1.13 Haldiram’s
- 12.1.13.1. Company Overview
- 12.1.13.2. Products
- 12.1.13.3. Company Financials
- 12.1.13.4. SWOT Analysis
- 12.1.1 MTR Foods
- 12.2. Market Entropy
- 12.2.1 Company's Key Areas Served
- 12.2.2 Recent Developments
- 12.3. Company Market Share Analysis 2025
- 12.3.1 Top 5 Companies Market Share Analysis
- 12.3.2 Top 3 Companies Market Share Analysis
- 12.4. List of Potential Customers
- 13. Research Methodology
List of Figures
- Figure 1: Global Ready To Cook Food Revenue Breakdown (million, %) by Region 2025 & 2033
- Figure 2: Global Ready To Cook Food Volume Breakdown (K, %) by Region 2025 & 2033
- Figure 3: North America Ready To Cook Food Revenue (million), by Application 2025 & 2033
- Figure 4: North America Ready To Cook Food Volume (K), by Application 2025 & 2033
- Figure 5: North America Ready To Cook Food Revenue Share (%), by Application 2025 & 2033
- Figure 6: North America Ready To Cook Food Volume Share (%), by Application 2025 & 2033
- Figure 7: North America Ready To Cook Food Revenue (million), by Type 2025 & 2033
- Figure 8: North America Ready To Cook Food Volume (K), by Type 2025 & 2033
- Figure 9: North America Ready To Cook Food Revenue Share (%), by Type 2025 & 2033
- Figure 10: North America Ready To Cook Food Volume Share (%), by Type 2025 & 2033
- Figure 11: North America Ready To Cook Food Revenue (million), by Country 2025 & 2033
- Figure 12: North America Ready To Cook Food Volume (K), by Country 2025 & 2033
- Figure 13: North America Ready To Cook Food Revenue Share (%), by Country 2025 & 2033
- Figure 14: North America Ready To Cook Food Volume Share (%), by Country 2025 & 2033
- Figure 15: South America Ready To Cook Food Revenue (million), by Application 2025 & 2033
- Figure 16: South America Ready To Cook Food Volume (K), by Application 2025 & 2033
- Figure 17: South America Ready To Cook Food Revenue Share (%), by Application 2025 & 2033
- Figure 18: South America Ready To Cook Food Volume Share (%), by Application 2025 & 2033
- Figure 19: South America Ready To Cook Food Revenue (million), by Type 2025 & 2033
- Figure 20: South America Ready To Cook Food Volume (K), by Type 2025 & 2033
- Figure 21: South America Ready To Cook Food Revenue Share (%), by Type 2025 & 2033
- Figure 22: South America Ready To Cook Food Volume Share (%), by Type 2025 & 2033
- Figure 23: South America Ready To Cook Food Revenue (million), by Country 2025 & 2033
- Figure 24: South America Ready To Cook Food Volume (K), by Country 2025 & 2033
- Figure 25: South America Ready To Cook Food Revenue Share (%), by Country 2025 & 2033
- Figure 26: South America Ready To Cook Food Volume Share (%), by Country 2025 & 2033
- Figure 27: Europe Ready To Cook Food Revenue (million), by Application 2025 & 2033
- Figure 28: Europe Ready To Cook Food Volume (K), by Application 2025 & 2033
- Figure 29: Europe Ready To Cook Food Revenue Share (%), by Application 2025 & 2033
- Figure 30: Europe Ready To Cook Food Volume Share (%), by Application 2025 & 2033
- Figure 31: Europe Ready To Cook Food Revenue (million), by Type 2025 & 2033
- Figure 32: Europe Ready To Cook Food Volume (K), by Type 2025 & 2033
- Figure 33: Europe Ready To Cook Food Revenue Share (%), by Type 2025 & 2033
- Figure 34: Europe Ready To Cook Food Volume Share (%), by Type 2025 & 2033
- Figure 35: Europe Ready To Cook Food Revenue (million), by Country 2025 & 2033
- Figure 36: Europe Ready To Cook Food Volume (K), by Country 2025 & 2033
- Figure 37: Europe Ready To Cook Food Revenue Share (%), by Country 2025 & 2033
- Figure 38: Europe Ready To Cook Food Volume Share (%), by Country 2025 & 2033
- Figure 39: Middle East & Africa Ready To Cook Food Revenue (million), by Application 2025 & 2033
- Figure 40: Middle East & Africa Ready To Cook Food Volume (K), by Application 2025 & 2033
- Figure 41: Middle East & Africa Ready To Cook Food Revenue Share (%), by Application 2025 & 2033
- Figure 42: Middle East & Africa Ready To Cook Food Volume Share (%), by Application 2025 & 2033
- Figure 43: Middle East & Africa Ready To Cook Food Revenue (million), by Type 2025 & 2033
- Figure 44: Middle East & Africa Ready To Cook Food Volume (K), by Type 2025 & 2033
- Figure 45: Middle East & Africa Ready To Cook Food Revenue Share (%), by Type 2025 & 2033
- Figure 46: Middle East & Africa Ready To Cook Food Volume Share (%), by Type 2025 & 2033
- Figure 47: Middle East & Africa Ready To Cook Food Revenue (million), by Country 2025 & 2033
- Figure 48: Middle East & Africa Ready To Cook Food Volume (K), by Country 2025 & 2033
- Figure 49: Middle East & Africa Ready To Cook Food Revenue Share (%), by Country 2025 & 2033
- Figure 50: Middle East & Africa Ready To Cook Food Volume Share (%), by Country 2025 & 2033
- Figure 51: Asia Pacific Ready To Cook Food Revenue (million), by Application 2025 & 2033
- Figure 52: Asia Pacific Ready To Cook Food Volume (K), by Application 2025 & 2033
- Figure 53: Asia Pacific Ready To Cook Food Revenue Share (%), by Application 2025 & 2033
- Figure 54: Asia Pacific Ready To Cook Food Volume Share (%), by Application 2025 & 2033
- Figure 55: Asia Pacific Ready To Cook Food Revenue (million), by Type 2025 & 2033
- Figure 56: Asia Pacific Ready To Cook Food Volume (K), by Type 2025 & 2033
- Figure 57: Asia Pacific Ready To Cook Food Revenue Share (%), by Type 2025 & 2033
- Figure 58: Asia Pacific Ready To Cook Food Volume Share (%), by Type 2025 & 2033
- Figure 59: Asia Pacific Ready To Cook Food Revenue (million), by Country 2025 & 2033
- Figure 60: Asia Pacific Ready To Cook Food Volume (K), by Country 2025 & 2033
- Figure 61: Asia Pacific Ready To Cook Food Revenue Share (%), by Country 2025 & 2033
- Figure 62: Asia Pacific Ready To Cook Food Volume Share (%), by Country 2025 & 2033
List of Tables
- Table 1: Global Ready To Cook Food Revenue million Forecast, by Application 2020 & 2033
- Table 2: Global Ready To Cook Food Volume K Forecast, by Application 2020 & 2033
- Table 3: Global Ready To Cook Food Revenue million Forecast, by Type 2020 & 2033
- Table 4: Global Ready To Cook Food Volume K Forecast, by Type 2020 & 2033
- Table 5: Global Ready To Cook Food Revenue million Forecast, by Region 2020 & 2033
- Table 6: Global Ready To Cook Food Volume K Forecast, by Region 2020 & 2033
- Table 7: Global Ready To Cook Food Revenue million Forecast, by Application 2020 & 2033
- Table 8: Global Ready To Cook Food Volume K Forecast, by Application 2020 & 2033
- Table 9: Global Ready To Cook Food Revenue million Forecast, by Type 2020 & 2033
- Table 10: Global Ready To Cook Food Volume K Forecast, by Type 2020 & 2033
- Table 11: Global Ready To Cook Food Revenue million Forecast, by Country 2020 & 2033
- Table 12: Global Ready To Cook Food Volume K Forecast, by Country 2020 & 2033
- Table 13: United States Ready To Cook Food Revenue (million) Forecast, by Application 2020 & 2033
- Table 14: United States Ready To Cook Food Volume (K) Forecast, by Application 2020 & 2033
- Table 15: Canada Ready To Cook Food Revenue (million) Forecast, by Application 2020 & 2033
- Table 16: Canada Ready To Cook Food Volume (K) Forecast, by Application 2020 & 2033
- Table 17: Mexico Ready To Cook Food Revenue (million) Forecast, by Application 2020 & 2033
- Table 18: Mexico Ready To Cook Food Volume (K) Forecast, by Application 2020 & 2033
- Table 19: Global Ready To Cook Food Revenue million Forecast, by Application 2020 & 2033
- Table 20: Global Ready To Cook Food Volume K Forecast, by Application 2020 & 2033
- Table 21: Global Ready To Cook Food Revenue million Forecast, by Type 2020 & 2033
- Table 22: Global Ready To Cook Food Volume K Forecast, by Type 2020 & 2033
- Table 23: Global Ready To Cook Food Revenue million Forecast, by Country 2020 & 2033
- Table 24: Global Ready To Cook Food Volume K Forecast, by Country 2020 & 2033
- Table 25: Brazil Ready To Cook Food Revenue (million) Forecast, by Application 2020 & 2033
- Table 26: Brazil Ready To Cook Food Volume (K) Forecast, by Application 2020 & 2033
- Table 27: Argentina Ready To Cook Food Revenue (million) Forecast, by Application 2020 & 2033
- Table 28: Argentina Ready To Cook Food Volume (K) Forecast, by Application 2020 & 2033
- Table 29: Rest of South America Ready To Cook Food Revenue (million) Forecast, by Application 2020 & 2033
- Table 30: Rest of South America Ready To Cook Food Volume (K) Forecast, by Application 2020 & 2033
- Table 31: Global Ready To Cook Food Revenue million Forecast, by Application 2020 & 2033
- Table 32: Global Ready To Cook Food Volume K Forecast, by Application 2020 & 2033
- Table 33: Global Ready To Cook Food Revenue million Forecast, by Type 2020 & 2033
- Table 34: Global Ready To Cook Food Volume K Forecast, by Type 2020 & 2033
- Table 35: Global Ready To Cook Food Revenue million Forecast, by Country 2020 & 2033
- Table 36: Global Ready To Cook Food Volume K Forecast, by Country 2020 & 2033
- Table 37: United Kingdom Ready To Cook Food Revenue (million) Forecast, by Application 2020 & 2033
- Table 38: United Kingdom Ready To Cook Food Volume (K) Forecast, by Application 2020 & 2033
- Table 39: Germany Ready To Cook Food Revenue (million) Forecast, by Application 2020 & 2033
- Table 40: Germany Ready To Cook Food Volume (K) Forecast, by Application 2020 & 2033
- Table 41: France Ready To Cook Food Revenue (million) Forecast, by Application 2020 & 2033
- Table 42: France Ready To Cook Food Volume (K) Forecast, by Application 2020 & 2033
- Table 43: Italy Ready To Cook Food Revenue (million) Forecast, by Application 2020 & 2033
- Table 44: Italy Ready To Cook Food Volume (K) Forecast, by Application 2020 & 2033
- Table 45: Spain Ready To Cook Food Revenue (million) Forecast, by Application 2020 & 2033
- Table 46: Spain Ready To Cook Food Volume (K) Forecast, by Application 2020 & 2033
- Table 47: Russia Ready To Cook Food Revenue (million) Forecast, by Application 2020 & 2033
- Table 48: Russia Ready To Cook Food Volume (K) Forecast, by Application 2020 & 2033
- Table 49: Benelux Ready To Cook Food Revenue (million) Forecast, by Application 2020 & 2033
- Table 50: Benelux Ready To Cook Food Volume (K) Forecast, by Application 2020 & 2033
- Table 51: Nordics Ready To Cook Food Revenue (million) Forecast, by Application 2020 & 2033
- Table 52: Nordics Ready To Cook Food Volume (K) Forecast, by Application 2020 & 2033
- Table 53: Rest of Europe Ready To Cook Food Revenue (million) Forecast, by Application 2020 & 2033
- Table 54: Rest of Europe Ready To Cook Food Volume (K) Forecast, by Application 2020 & 2033
- Table 55: Global Ready To Cook Food Revenue million Forecast, by Application 2020 & 2033
- Table 56: Global Ready To Cook Food Volume K Forecast, by Application 2020 & 2033
- Table 57: Global Ready To Cook Food Revenue million Forecast, by Type 2020 & 2033
- Table 58: Global Ready To Cook Food Volume K Forecast, by Type 2020 & 2033
- Table 59: Global Ready To Cook Food Revenue million Forecast, by Country 2020 & 2033
- Table 60: Global Ready To Cook Food Volume K Forecast, by Country 2020 & 2033
- Table 61: Turkey Ready To Cook Food Revenue (million) Forecast, by Application 2020 & 2033
- Table 62: Turkey Ready To Cook Food Volume (K) Forecast, by Application 2020 & 2033
- Table 63: Israel Ready To Cook Food Revenue (million) Forecast, by Application 2020 & 2033
- Table 64: Israel Ready To Cook Food Volume (K) Forecast, by Application 2020 & 2033
- Table 65: GCC Ready To Cook Food Revenue (million) Forecast, by Application 2020 & 2033
- Table 66: GCC Ready To Cook Food Volume (K) Forecast, by Application 2020 & 2033
- Table 67: North Africa Ready To Cook Food Revenue (million) Forecast, by Application 2020 & 2033
- Table 68: North Africa Ready To Cook Food Volume (K) Forecast, by Application 2020 & 2033
- Table 69: South Africa Ready To Cook Food Revenue (million) Forecast, by Application 2020 & 2033
- Table 70: South Africa Ready To Cook Food Volume (K) Forecast, by Application 2020 & 2033
- Table 71: Rest of Middle East & Africa Ready To Cook Food Revenue (million) Forecast, by Application 2020 & 2033
- Table 72: Rest of Middle East & Africa Ready To Cook Food Volume (K) Forecast, by Application 2020 & 2033
- Table 73: Global Ready To Cook Food Revenue million Forecast, by Application 2020 & 2033
- Table 74: Global Ready To Cook Food Volume K Forecast, by Application 2020 & 2033
- Table 75: Global Ready To Cook Food Revenue million Forecast, by Type 2020 & 2033
- Table 76: Global Ready To Cook Food Volume K Forecast, by Type 2020 & 2033
- Table 77: Global Ready To Cook Food Revenue million Forecast, by Country 2020 & 2033
- Table 78: Global Ready To Cook Food Volume K Forecast, by Country 2020 & 2033
- Table 79: China Ready To Cook Food Revenue (million) Forecast, by Application 2020 & 2033
- Table 80: China Ready To Cook Food Volume (K) Forecast, by Application 2020 & 2033
- Table 81: India Ready To Cook Food Revenue (million) Forecast, by Application 2020 & 2033
- Table 82: India Ready To Cook Food Volume (K) Forecast, by Application 2020 & 2033
- Table 83: Japan Ready To Cook Food Revenue (million) Forecast, by Application 2020 & 2033
- Table 84: Japan Ready To Cook Food Volume (K) Forecast, by Application 2020 & 2033
- Table 85: South Korea Ready To Cook Food Revenue (million) Forecast, by Application 2020 & 2033
- Table 86: South Korea Ready To Cook Food Volume (K) Forecast, by Application 2020 & 2033
- Table 87: ASEAN Ready To Cook Food Revenue (million) Forecast, by Application 2020 & 2033
- Table 88: ASEAN Ready To Cook Food Volume (K) Forecast, by Application 2020 & 2033
- Table 89: Oceania Ready To Cook Food Revenue (million) Forecast, by Application 2020 & 2033
- Table 90: Oceania Ready To Cook Food Volume (K) Forecast, by Application 2020 & 2033
- Table 91: Rest of Asia Pacific Ready To Cook Food Revenue (million) Forecast, by Application 2020 & 2033
- Table 92: Rest of Asia Pacific Ready To Cook Food Volume (K) Forecast, by Application 2020 & 2033
Frequently Asked Questions
1. What is the projected Compound Annual Growth Rate (CAGR) of the Ready To Cook Food?
The projected CAGR is approximately XXX%.
2. Which companies are prominent players in the Ready To Cook Food?
Key companies in the market include MTR Foods, Gits, Kohinoor, Nevil Foods, McCain Foods (India), Prabhat Poultry, DEEPTHI FOODS AND FORMULATIONS, Godrej Tyson Foods, Nestle (Maggi), ITC India, General Mills, ADF Foods, Haldiram’s.
3. What are the main segments of the Ready To Cook Food?
The market segments include Application, Type.
4. Can you provide details about the market size?
The market size is estimated to be USD XXX million as of 2022.
5. What are some drivers contributing to market growth?
N/A
6. What are the notable trends driving market growth?
N/A
7. Are there any restraints impacting market growth?
N/A
8. Can you provide examples of recent developments in the market?
N/A
9. What pricing options are available for accessing the report?
Pricing options include single-user, multi-user, and enterprise licenses priced at USD 3950.00, USD 5925.00, and USD 7900.00 respectively.
10. Is the market size provided in terms of value or volume?
The market size is provided in terms of value, measured in million and volume, measured in K.
11. Are there any specific market keywords associated with the report?
Yes, the market keyword associated with the report is "Ready To Cook Food," which aids in identifying and referencing the specific market segment covered.
12. How do I determine which pricing option suits my needs best?
The pricing options vary based on user requirements and access needs. Individual users may opt for single-user licenses, while businesses requiring broader access may choose multi-user or enterprise licenses for cost-effective access to the report.
13. Are there any additional resources or data provided in the Ready To Cook Food report?
While the report offers comprehensive insights, it's advisable to review the specific contents or supplementary materials provided to ascertain if additional resources or data are available.
14. How can I stay updated on further developments or reports in the Ready To Cook Food?
To stay informed about further developments, trends, and reports in the Ready To Cook Food, consider subscribing to industry newsletters, following relevant companies and organizations, or regularly checking reputable industry news sources and publications.
Methodology
Step 1 - Identification of Relevant Samples Size from Population Database


Step 2 - Approaches for Defining Global Market Size (Value, Volume* & Price*)

Note*: In applicable scenarios
Step 3 - Data Sources
Primary Research
- Web Analytics
- Survey Reports
- Research Institute
- Latest Research Reports
- Opinion Leaders
Secondary Research
- Annual Reports
- White Paper
- Latest Press Release
- Industry Association
- Paid Database
- Investor Presentations

Step 4 - Data Triangulation
Involves using different sources of information in order to increase the validity of a study
These sources are likely to be stakeholders in a program - participants, other researchers, program staff, other community members, and so on.
Then we put all data in single framework & apply various statistical tools to find out the dynamic on the market.
During the analysis stage, feedback from the stakeholder groups would be compared to determine areas of agreement as well as areas of divergence