

Key Insights
The global Ready-to-Eat Soup market is poised for significant expansion, projected to reach an estimated $1.3 billion in 2024. This robust growth is fueled by an anticipated Compound Annual Growth Rate (CAGR) of 7.7% over the forecast period of 2025-2033, underscoring the increasing consumer preference for convenient and healthy meal solutions. The market's expansion is primarily driven by evolving lifestyles, urbanization, and a heightened demand for quick, nutritious, and easily prepared food options. Consumers are increasingly seeking out convenient meal solutions that align with their busy schedules without compromising on taste or nutritional value. This trend is particularly pronounced in developed economies and is rapidly gaining traction in emerging markets as disposable incomes rise and Western dietary habits influence consumer choices. The advent of innovative packaging technologies, extending shelf life and enhancing product appeal, further bolsters market growth, making ready-to-eat soups a staple in modern households and a convenient option for on-the-go consumption.
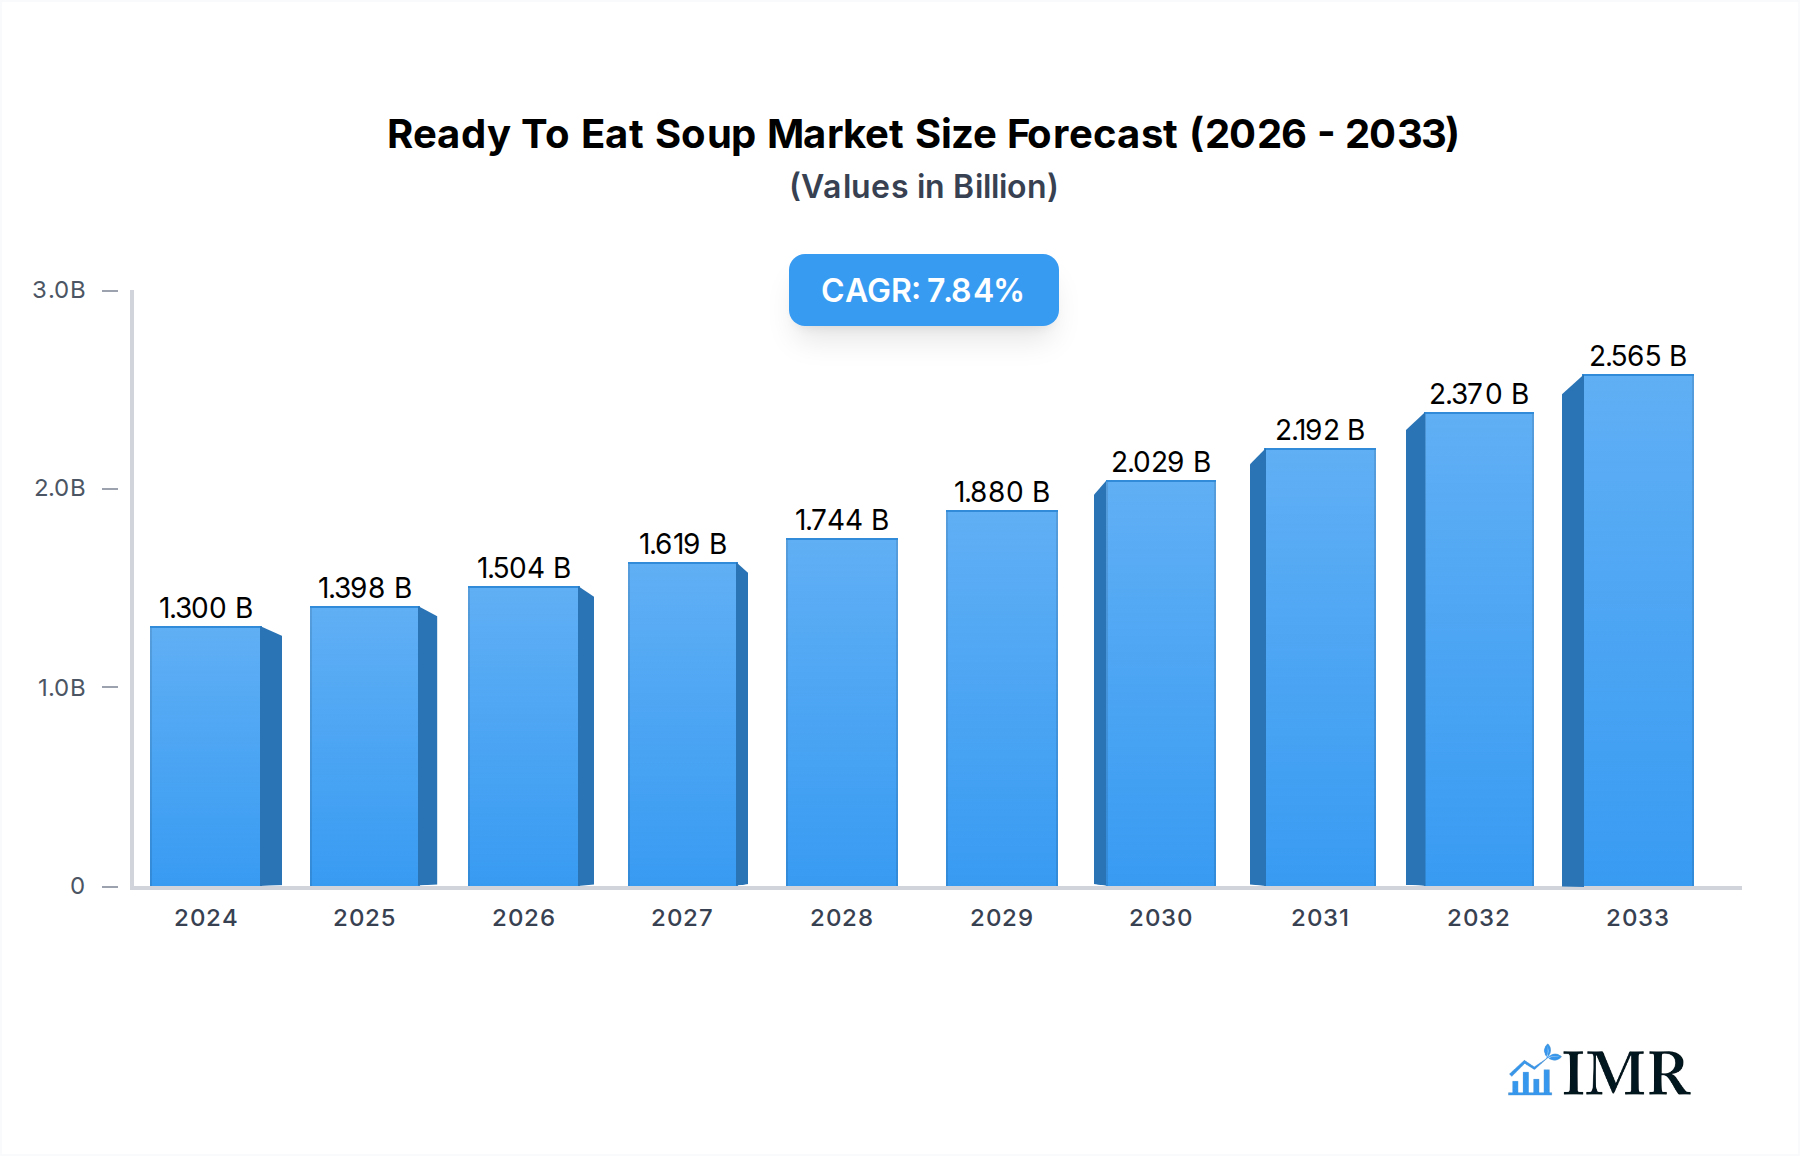
Ready To Eat Soup Market Size (In Billion)
The Ready-to-Eat Soup market is segmented by application, with Retail emerging as a dominant segment due to widespread availability in supermarkets and convenience stores. The Catering & Industrial segment also presents substantial opportunities, catering to institutional needs such as offices, schools, and hospitals. In terms of product type, Tomato Ready-to-Eat Soup holds a significant market share, a testament to its universal appeal and versatility. However, the market is also witnessing a surge in demand for other varieties, including Beans, Chicken, Beef, and Mixed Vegetables soups, as consumers seek diverse flavors and dietary options. Key players like Campbell Soup, The Kraft Heinz, and Hain Celestial Group are actively innovating, introducing new product formulations and expanding their distribution networks to capture a larger market share. While the market exhibits strong growth, potential restraints such as intense competition, fluctuating raw material prices, and the increasing popularity of fresh and homemade meals could pose challenges. Nonetheless, the overarching trend towards convenience and healthy eating is expected to propel the Ready-to-Eat Soup market forward.

Ready To Eat Soup Company Market Share
Ready To Eat Soup Market Dynamics & Structure
The global Ready To Eat (RTE) soup market exhibits a moderately consolidated structure, with key players like Campbell Soup, The Kraft Heinz, and Hain Celestial Group holding significant market shares. Technological innovation is a primary driver, fueled by advancements in packaging, preservation techniques, and product development catering to evolving consumer preferences for convenience and health. Regulatory frameworks, particularly concerning food safety and labeling, play a crucial role in shaping market entry and product formulation. Competitive product substitutes include fresh meals, frozen meals, and meal kits, necessitating continuous innovation and differentiated offerings within the RTE soup segment. End-user demographics are increasingly skewed towards busy professionals, urban dwellers, and health-conscious individuals seeking quick, nutritious meal solutions. Mergers and acquisitions (M&A) activity, exemplified by strategic integrations and brand acquisitions, continue to reshape market dynamics, enabling companies to expand their product portfolios and geographical reach. The market is projected to reach approximately $XX.X billion by 2033, with a CAGR of X.X% during the forecast period.
- Market Concentration: Moderately consolidated with a few dominant players.
- Technological Innovation Drivers: Advanced packaging (e.g., retort pouches), improved ingredient sourcing, novel flavor profiles, and shelf-stable formulations.
- Regulatory Frameworks: Strict adherence to food safety standards (e.g., HACCP, FDA regulations) and evolving labeling requirements for nutritional information and allergens.
- Competitive Product Substitutes: Freshly prepared meals, frozen entrees, meal kits, and other convenience food options.
- End-User Demographics: Young professionals, working parents, students, elderly individuals, and health-conscious consumers.
- M&A Trends: Strategic acquisitions for market expansion, product portfolio diversification, and enhanced R&D capabilities.
Ready To Eat Soup Growth Trends & Insights
The Ready-to-Eat (RTE) soup market is experiencing robust growth, driven by escalating consumer demand for convenience and the increasing pace of modern lifestyles. The market size, valued at approximately $XX.X billion in the base year 2025, is projected to ascend to $XX.X billion by 2033, exhibiting a compound annual growth rate (CAGR) of X.X% during the forecast period of 2025–2033. This significant expansion is underpinned by a confluence of evolving consumer behaviors, technological advancements, and strategic industry developments. The adoption rates for RTE soups have been steadily increasing, particularly in urbanized regions where time constraints are most pronounced. Consumers are increasingly seeking wholesome, nutritious, and flavorful meal options that require minimal preparation. This shift in preference is directly fueling the demand for a diverse range of RTE soups, from classic broths to gourmet formulations.
Technological disruptions are playing a pivotal role in enhancing the appeal and accessibility of RTE soups. Innovations in packaging technology, such as advanced retort pouching and aseptic packaging, have significantly extended shelf life while preserving the taste, texture, and nutritional integrity of the soups. This not only reduces food waste but also makes RTE soups a more viable option for stocking pantries and for on-the-go consumption. Furthermore, advancements in processing technologies, including microwave-ready packaging and innovative heating mechanisms, have reduced preparation times, aligning perfectly with the 'instant gratification' expectations of today's consumers.
Consumer behavior shifts are a critical growth engine. There's a discernible trend towards health-consciousness, leading consumers to opt for RTE soups that are perceived as healthier alternatives to other convenience foods. This includes a rising demand for low-sodium, high-fiber, plant-based, and organic soup varieties. The influence of social media and online food bloggers has also played a part in popularizing new flavor profiles and demonstrating the versatility of RTE soups as a base for more elaborate meals. The convenience factor remains paramount, with RTE soups fulfilling the need for a quick and satisfying meal during busy workdays, for students, or for individuals seeking an easy meal solution after a long day. The penetration of RTE soups into households is expected to deepen as product variety expands and perceived health benefits become more pronounced. The market is not just about sustenance; it's increasingly about a convenient, healthy, and enjoyable culinary experience.
Dominant Regions, Countries, or Segments in Ready To Eat Soup
North America currently stands as the dominant region in the global Ready-to-Eat (RTE) soup market, driven by deeply ingrained consumer habits, a high disposable income, and a well-established infrastructure for convenience foods. Within North America, the United States spearheads this dominance, accounting for a substantial market share of approximately XX% in 2025. The country's large population, coupled with a fast-paced lifestyle and a strong preference for convenient meal solutions, fuels consistent demand for RTE soups. Economic policies that support food manufacturing and distribution, alongside robust retail and catering networks, further solidify its leading position.
Among the various applications, Retail is the most significant segment, contributing around XX% to the overall market revenue in 2025. This segment encompasses sales through supermarkets, hypermarkets, convenience stores, and online grocery platforms, all of which cater to individual consumers seeking quick meal options. The increasing popularity of e-commerce has further amplified the reach and accessibility of RTE soups within the retail landscape.
In terms of product types, Tomato Ready-to-Eat Soup has emerged as a consistently popular choice, capturing an estimated XX% of the market share in 2025. Its widespread appeal stems from its classic flavor profile, versatility in culinary applications, and perceived health benefits. However, the Chicken Ready-to-Eat Soup segment is also experiencing substantial growth, driven by its protein content and broad consumer acceptance as a comforting and filling meal. The market for Mixed Vegetables Ready-to-Eat Soup is also gaining traction as consumers prioritize healthier, plant-based options.
The market's growth in dominant regions is further propelled by:
- Economic Policies: Favorable trade agreements and government support for the food processing industry in countries like the United States and Canada.
- Infrastructure: Extensive distribution networks, advanced logistics, and widespread availability of retail outlets.
- Consumer Spending Power: High disposable incomes allowing for consistent purchasing of convenience food products.
- Urbanization: Increasing urban populations in developed economies, leading to a higher demand for time-saving meal solutions.
- Brand Loyalty and Marketing: Strong brand recognition and aggressive marketing campaigns by major players like Campbell Soup and The Kraft Heinz.
The growth potential within these dominant segments remains considerable. While traditional segments like Tomato and Chicken soups continue to perform well, there's a significant opportunity for innovation in plant-based, gluten-free, and artisanal flavor profiles to cater to evolving consumer tastes and dietary needs. The increasing adoption of smart packaging and personalized nutrition will also shape the future of the RTE soup market in these leading regions.
Ready To Eat Soup Product Landscape
The Ready-to-Eat (RTE) soup product landscape is characterized by a continuous stream of innovations focused on enhancing convenience, health, and flavor. Companies are actively developing new product lines featuring gourmet flavors, ethnic inspirations, and functional ingredients like added probiotics or plant-based proteins. Packaging advancements are a key highlight, with a growing adoption of microwave-ready bowls, resealable pouches, and sustainable materials. Performance metrics are increasingly tied to extended shelf life, minimal nutritional degradation during processing, and enhanced palatability. Unique selling propositions often revolve around clean label ingredients, reduced sodium content, and allergen-free formulations, catering to a more health-conscious consumer base.
Key Drivers, Barriers & Challenges in Ready To Eat Soup
Key Drivers:
- Increasing Demand for Convenience: Busy lifestyles and a growing preference for quick meal solutions are paramount drivers.
- Health and Wellness Trends: Rising consumer interest in nutritious, low-calorie, and plant-based meal options.
- Technological Advancements: Innovations in packaging, preservation, and processing technologies extend shelf life and improve product quality.
- Growing Disposable Income: Higher purchasing power in emerging economies fuels demand for convenience foods.
- Product Innovation: Introduction of diverse flavors, cuisines, and functional ingredients caters to varied consumer preferences.
Key Barriers & Challenges:
- Perception of Processed Foods: Some consumers still perceive RTE soups as less healthy than homemade alternatives.
- Supply Chain Volatility: Fluctuations in the cost and availability of raw ingredients (vegetables, meats, grains) can impact production and pricing.
- Regulatory Hurdles: Stringent food safety regulations and evolving labeling requirements can increase compliance costs.
- Intense Competition: A crowded market with established players and numerous private labels poses significant competitive pressure.
- Consumer Price Sensitivity: Balancing premium ingredients and innovative features with affordable pricing can be challenging.
- Short Shelf Life Concerns: Despite advancements, maintaining optimal freshness and taste over extended periods remains a challenge for certain formulations.
Emerging Opportunities in Ready To Eat Soup
Emerging opportunities in the Ready-to-Eat (RTE) soup sector are primarily centered around tapping into niche markets and catering to evolving consumer demands. The growing demand for plant-based and vegan soup options presents a significant untapped market, with room for innovative formulations using legumes, grains, and diverse vegetables. Functional soups, fortified with vitamins, minerals, probiotics, or adaptogens, are another avenue for growth, appealing to health-conscious consumers seeking specific health benefits. Furthermore, the expansion of RTE soups into on-the-go formats, such as single-serving pouches with integrated cutlery, can cater to the burgeoning convenience food market for commuters and travelers. The development of personalized nutrition-focused RTE soups, potentially leveraging AI and subscription models, also holds considerable promise.
Growth Accelerators in the Ready To Eat Soup Industry
Several catalysts are accelerating growth within the Ready-to-Eat (RTE) soup industry. Technological breakthroughs in aseptic processing and advanced packaging are enabling longer shelf lives with minimal compromise on taste and nutritional value, thereby expanding market reach and reducing spoilage. Strategic partnerships between ingredient suppliers and RTE soup manufacturers are fostering innovation in unique flavor profiles and functional ingredient integration. Furthermore, aggressive market expansion strategies by key players into emerging economies, coupled with localized product development to cater to regional tastes, are significant growth accelerators. The increasing focus on sustainable sourcing and eco-friendly packaging is also resonating with environmentally conscious consumers, providing a competitive edge and driving adoption.
Key Players Shaping the Ready To Eat Soup Market
- Campbell Soup
- The Kraft Heinz
- Hain Celestial Group
- Amy's Kitchen
- Baxters Food Group
- New Covent Garden Soup
- Princes Group (Crosse & Blackwell)
- Fazlani Foods
Notable Milestones in Ready To Eat Soup Sector
- 2019: Launch of a new line of plant-based, organic RTE soups by Amy's Kitchen, responding to growing vegan and health-conscious trends.
- 2020: Campbell Soup invests in advanced retort pouch technology to enhance shelf-life and reduce packaging waste for its condensed soup product lines, impacting RTE offerings.
- 2021: The Kraft Heinz acquires a significant stake in a promising functional foods startup, signaling a move towards health-focused RTE soup innovation.
- 2022: New Covent Garden Soup introduces a range of "global flavors" RTE soups, tapping into consumer interest in international cuisines.
- 2023: Baxters Food Group expands its production capacity for its premium RTE soup range to meet rising demand in the UK and European markets.
- 2024: Princes Group (Crosse & Blackwell) revamps its RTE soup packaging to include more sustainable and recyclable materials, aligning with environmental concerns.
- 2025: Fazlani Foods explores innovative distribution channels, including direct-to-consumer online sales and partnerships with meal delivery services, for its niche RTE soup varieties.
In-Depth Ready To Eat Soup Market Outlook
The future of the Ready-to-Eat (RTE) soup market is characterized by sustained growth driven by an intensified focus on health and convenience. Innovations in personalized nutrition, plant-based formulations, and functional ingredients will be key differentiators. Strategic collaborations and acquisitions will continue to reshape the competitive landscape, allowing companies to broaden their product portfolios and market reach. The expansion into emerging markets, coupled with a deeper penetration into existing ones through enhanced distribution channels and direct-to-consumer models, will fuel significant market expansion. Companies that prioritize sustainability, transparency in sourcing, and cater to evolving dietary preferences are poised to capture a substantial share of the projected market growth.
Ready To Eat Soup Segmentation
-
1. Application
- 1.1. Retail
- 1.2. Catering & Industrial
- 1.3. Others
-
2. Type
- 2.1. Tomato Ready-to-Eat Soup
- 2.2. Beans Ready-to-Eat Soup
- 2.3. Chicken Ready-to-Eat Soup
- 2.4. Beef Ready-to-Eat Soup
- 2.5. Mixed Vegetables Ready-to-Eat Soup
- 2.6. Others
Ready To Eat Soup Segmentation By Geography
-
1. North America
- 1.1. United States
- 1.2. Canada
- 1.3. Mexico
-
2. South America
- 2.1. Brazil
- 2.2. Argentina
- 2.3. Rest of South America
-
3. Europe
- 3.1. United Kingdom
- 3.2. Germany
- 3.3. France
- 3.4. Italy
- 3.5. Spain
- 3.6. Russia
- 3.7. Benelux
- 3.8. Nordics
- 3.9. Rest of Europe
-
4. Middle East & Africa
- 4.1. Turkey
- 4.2. Israel
- 4.3. GCC
- 4.4. North Africa
- 4.5. South Africa
- 4.6. Rest of Middle East & Africa
-
5. Asia Pacific
- 5.1. China
- 5.2. India
- 5.3. Japan
- 5.4. South Korea
- 5.5. ASEAN
- 5.6. Oceania
- 5.7. Rest of Asia Pacific
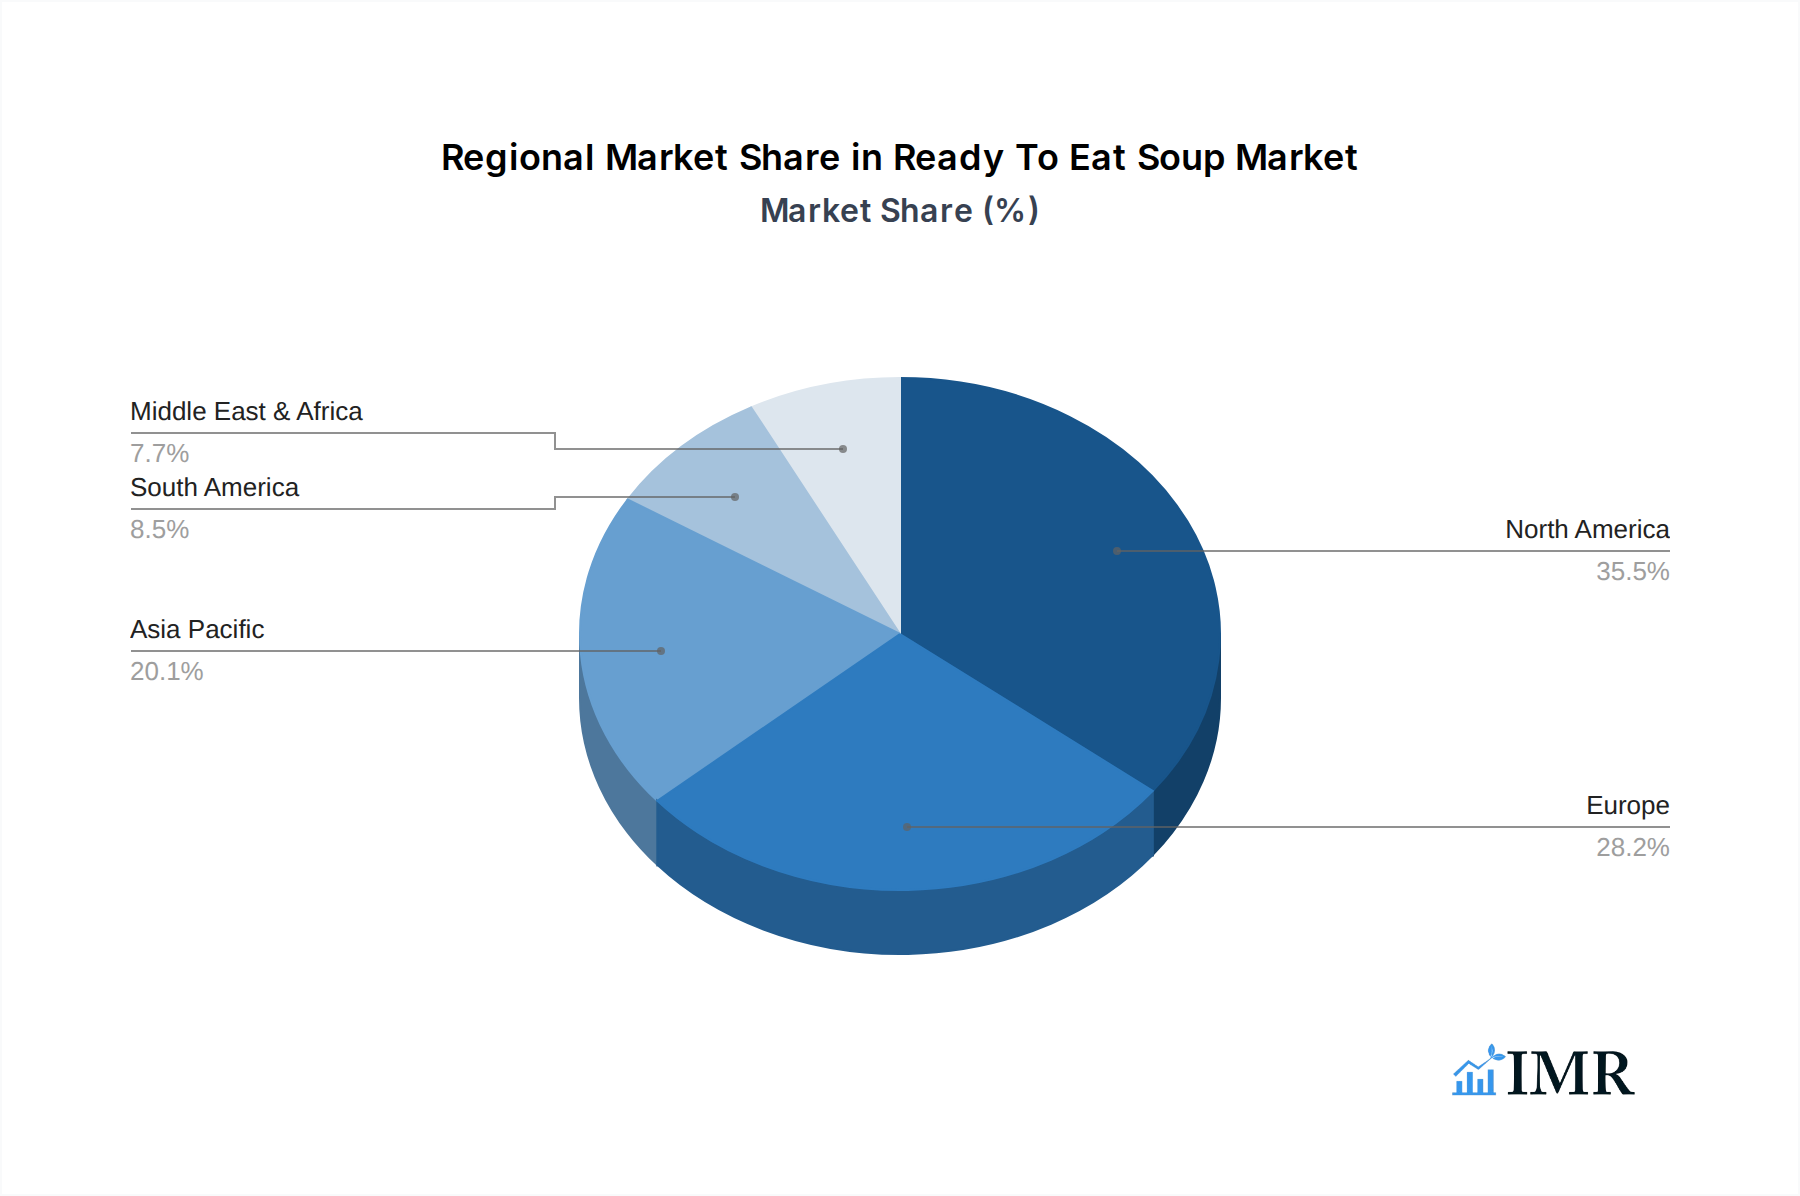
Ready To Eat Soup Regional Market Share
Geographic Coverage of Ready To Eat Soup
Ready To Eat Soup REPORT HIGHLIGHTS
| Aspects | Details |
|---|---|
| Study Period | 2020-2034 |
| Base Year | 2025 |
| Estimated Year | 2026 |
| Forecast Period | 2026-2034 |
| Historical Period | 2020-2025 |
| Growth Rate | CAGR of 7.7% from 2020-2034 |
| Segmentation |
|
Table of Contents
- 1. Introduction
- 1.1. Research Scope
- 1.2. Market Segmentation
- 1.3. Research Objective
- 1.4. Definitions and Assumptions
- 2. Executive Summary
- 2.1. Market Snapshot
- 3. Market Dynamics
- 3.1. Market Drivers
- 3.2. Market Restrains
- 3.3. Market Trends
- 3.4. Market Opportunities
- 4. Market Factor Analysis
- 4.1. Porters Five Forces
- 4.1.1. Bargaining Power of Suppliers
- 4.1.2. Bargaining Power of Buyers
- 4.1.3. Threat of New Entrants
- 4.1.4. Threat of Substitutes
- 4.1.5. Competitive Rivalry
- 4.2. PESTEL analysis
- 4.3. BCG Analysis
- 4.3.1. Stars (High Growth, High Market Share)
- 4.3.2. Cash Cows (Low Growth, High Market Share)
- 4.3.3. Question Mark (High Growth, Low Market Share)
- 4.3.4. Dogs (Low Growth, Low Market Share)
- 4.4. Ansoff Matrix Analysis
- 4.5. Supply Chain Analysis
- 4.6. Regulatory Landscape
- 4.7. Current Market Potential and Opportunity Assessment (TAM–SAM–SOM Framework)
- 4.8. IMR Analyst Note
- 4.1. Porters Five Forces
- 5. Market Analysis, Insights and Forecast 2021-2033
- 5.1. Market Analysis, Insights and Forecast - by Application
- 5.1.1. Retail
- 5.1.2. Catering & Industrial
- 5.1.3. Others
- 5.2. Market Analysis, Insights and Forecast - by Type
- 5.2.1. Tomato Ready-to-Eat Soup
- 5.2.2. Beans Ready-to-Eat Soup
- 5.2.3. Chicken Ready-to-Eat Soup
- 5.2.4. Beef Ready-to-Eat Soup
- 5.2.5. Mixed Vegetables Ready-to-Eat Soup
- 5.2.6. Others
- 5.3. Market Analysis, Insights and Forecast - by Region
- 5.3.1. North America
- 5.3.2. South America
- 5.3.3. Europe
- 5.3.4. Middle East & Africa
- 5.3.5. Asia Pacific
- 5.1. Market Analysis, Insights and Forecast - by Application
- 6. Global Ready To Eat Soup Analysis, Insights and Forecast, 2021-2033
- 6.1. Market Analysis, Insights and Forecast - by Application
- 6.1.1. Retail
- 6.1.2. Catering & Industrial
- 6.1.3. Others
- 6.2. Market Analysis, Insights and Forecast - by Type
- 6.2.1. Tomato Ready-to-Eat Soup
- 6.2.2. Beans Ready-to-Eat Soup
- 6.2.3. Chicken Ready-to-Eat Soup
- 6.2.4. Beef Ready-to-Eat Soup
- 6.2.5. Mixed Vegetables Ready-to-Eat Soup
- 6.2.6. Others
- 6.1. Market Analysis, Insights and Forecast - by Application
- 7. North America Ready To Eat Soup Analysis, Insights and Forecast, 2020-2032
- 7.1. Market Analysis, Insights and Forecast - by Application
- 7.1.1. Retail
- 7.1.2. Catering & Industrial
- 7.1.3. Others
- 7.2. Market Analysis, Insights and Forecast - by Type
- 7.2.1. Tomato Ready-to-Eat Soup
- 7.2.2. Beans Ready-to-Eat Soup
- 7.2.3. Chicken Ready-to-Eat Soup
- 7.2.4. Beef Ready-to-Eat Soup
- 7.2.5. Mixed Vegetables Ready-to-Eat Soup
- 7.2.6. Others
- 7.1. Market Analysis, Insights and Forecast - by Application
- 8. South America Ready To Eat Soup Analysis, Insights and Forecast, 2020-2032
- 8.1. Market Analysis, Insights and Forecast - by Application
- 8.1.1. Retail
- 8.1.2. Catering & Industrial
- 8.1.3. Others
- 8.2. Market Analysis, Insights and Forecast - by Type
- 8.2.1. Tomato Ready-to-Eat Soup
- 8.2.2. Beans Ready-to-Eat Soup
- 8.2.3. Chicken Ready-to-Eat Soup
- 8.2.4. Beef Ready-to-Eat Soup
- 8.2.5. Mixed Vegetables Ready-to-Eat Soup
- 8.2.6. Others
- 8.1. Market Analysis, Insights and Forecast - by Application
- 9. Europe Ready To Eat Soup Analysis, Insights and Forecast, 2020-2032
- 9.1. Market Analysis, Insights and Forecast - by Application
- 9.1.1. Retail
- 9.1.2. Catering & Industrial
- 9.1.3. Others
- 9.2. Market Analysis, Insights and Forecast - by Type
- 9.2.1. Tomato Ready-to-Eat Soup
- 9.2.2. Beans Ready-to-Eat Soup
- 9.2.3. Chicken Ready-to-Eat Soup
- 9.2.4. Beef Ready-to-Eat Soup
- 9.2.5. Mixed Vegetables Ready-to-Eat Soup
- 9.2.6. Others
- 9.1. Market Analysis, Insights and Forecast - by Application
- 10. Middle East & Africa Ready To Eat Soup Analysis, Insights and Forecast, 2020-2032
- 10.1. Market Analysis, Insights and Forecast - by Application
- 10.1.1. Retail
- 10.1.2. Catering & Industrial
- 10.1.3. Others
- 10.2. Market Analysis, Insights and Forecast - by Type
- 10.2.1. Tomato Ready-to-Eat Soup
- 10.2.2. Beans Ready-to-Eat Soup
- 10.2.3. Chicken Ready-to-Eat Soup
- 10.2.4. Beef Ready-to-Eat Soup
- 10.2.5. Mixed Vegetables Ready-to-Eat Soup
- 10.2.6. Others
- 10.1. Market Analysis, Insights and Forecast - by Application
- 11. Asia Pacific Ready To Eat Soup Analysis, Insights and Forecast, 2020-2032
- 11.1. Market Analysis, Insights and Forecast - by Application
- 11.1.1. Retail
- 11.1.2. Catering & Industrial
- 11.1.3. Others
- 11.2. Market Analysis, Insights and Forecast - by Type
- 11.2.1. Tomato Ready-to-Eat Soup
- 11.2.2. Beans Ready-to-Eat Soup
- 11.2.3. Chicken Ready-to-Eat Soup
- 11.2.4. Beef Ready-to-Eat Soup
- 11.2.5. Mixed Vegetables Ready-to-Eat Soup
- 11.2.6. Others
- 11.1. Market Analysis, Insights and Forecast - by Application
- 12. Competitive Analysis
- 12.1. Company Profiles
- 12.1.1 Campbell Soup
- 12.1.1.1. Company Overview
- 12.1.1.2. Products
- 12.1.1.3. Company Financials
- 12.1.1.4. SWOT Analysis
- 12.1.2 The Kraft Heinz
- 12.1.2.1. Company Overview
- 12.1.2.2. Products
- 12.1.2.3. Company Financials
- 12.1.2.4. SWOT Analysis
- 12.1.3 Hain Celestial Group
- 12.1.3.1. Company Overview
- 12.1.3.2. Products
- 12.1.3.3. Company Financials
- 12.1.3.4. SWOT Analysis
- 12.1.4 Amy's Kitchen
- 12.1.4.1. Company Overview
- 12.1.4.2. Products
- 12.1.4.3. Company Financials
- 12.1.4.4. SWOT Analysis
- 12.1.5 Baxters Food Group
- 12.1.5.1. Company Overview
- 12.1.5.2. Products
- 12.1.5.3. Company Financials
- 12.1.5.4. SWOT Analysis
- 12.1.6 New Covent Garden Soup
- 12.1.6.1. Company Overview
- 12.1.6.2. Products
- 12.1.6.3. Company Financials
- 12.1.6.4. SWOT Analysis
- 12.1.7 Princes Group (Crosse & Blackwell)
- 12.1.7.1. Company Overview
- 12.1.7.2. Products
- 12.1.7.3. Company Financials
- 12.1.7.4. SWOT Analysis
- 12.1.8 Fazlani Foods
- 12.1.8.1. Company Overview
- 12.1.8.2. Products
- 12.1.8.3. Company Financials
- 12.1.8.4. SWOT Analysis
- 12.1.1 Campbell Soup
- 12.2. Market Entropy
- 12.2.1 Company's Key Areas Served
- 12.2.2 Recent Developments
- 12.3. Company Market Share Analysis 2025
- 12.3.1 Top 5 Companies Market Share Analysis
- 12.3.2 Top 3 Companies Market Share Analysis
- 12.4. List of Potential Customers
- 13. Research Methodology
List of Figures
- Figure 1: Global Ready To Eat Soup Revenue Breakdown (undefined, %) by Region 2025 & 2033
- Figure 2: North America Ready To Eat Soup Revenue (undefined), by Application 2025 & 2033
- Figure 3: North America Ready To Eat Soup Revenue Share (%), by Application 2025 & 2033
- Figure 4: North America Ready To Eat Soup Revenue (undefined), by Type 2025 & 2033
- Figure 5: North America Ready To Eat Soup Revenue Share (%), by Type 2025 & 2033
- Figure 6: North America Ready To Eat Soup Revenue (undefined), by Country 2025 & 2033
- Figure 7: North America Ready To Eat Soup Revenue Share (%), by Country 2025 & 2033
- Figure 8: South America Ready To Eat Soup Revenue (undefined), by Application 2025 & 2033
- Figure 9: South America Ready To Eat Soup Revenue Share (%), by Application 2025 & 2033
- Figure 10: South America Ready To Eat Soup Revenue (undefined), by Type 2025 & 2033
- Figure 11: South America Ready To Eat Soup Revenue Share (%), by Type 2025 & 2033
- Figure 12: South America Ready To Eat Soup Revenue (undefined), by Country 2025 & 2033
- Figure 13: South America Ready To Eat Soup Revenue Share (%), by Country 2025 & 2033
- Figure 14: Europe Ready To Eat Soup Revenue (undefined), by Application 2025 & 2033
- Figure 15: Europe Ready To Eat Soup Revenue Share (%), by Application 2025 & 2033
- Figure 16: Europe Ready To Eat Soup Revenue (undefined), by Type 2025 & 2033
- Figure 17: Europe Ready To Eat Soup Revenue Share (%), by Type 2025 & 2033
- Figure 18: Europe Ready To Eat Soup Revenue (undefined), by Country 2025 & 2033
- Figure 19: Europe Ready To Eat Soup Revenue Share (%), by Country 2025 & 2033
- Figure 20: Middle East & Africa Ready To Eat Soup Revenue (undefined), by Application 2025 & 2033
- Figure 21: Middle East & Africa Ready To Eat Soup Revenue Share (%), by Application 2025 & 2033
- Figure 22: Middle East & Africa Ready To Eat Soup Revenue (undefined), by Type 2025 & 2033
- Figure 23: Middle East & Africa Ready To Eat Soup Revenue Share (%), by Type 2025 & 2033
- Figure 24: Middle East & Africa Ready To Eat Soup Revenue (undefined), by Country 2025 & 2033
- Figure 25: Middle East & Africa Ready To Eat Soup Revenue Share (%), by Country 2025 & 2033
- Figure 26: Asia Pacific Ready To Eat Soup Revenue (undefined), by Application 2025 & 2033
- Figure 27: Asia Pacific Ready To Eat Soup Revenue Share (%), by Application 2025 & 2033
- Figure 28: Asia Pacific Ready To Eat Soup Revenue (undefined), by Type 2025 & 2033
- Figure 29: Asia Pacific Ready To Eat Soup Revenue Share (%), by Type 2025 & 2033
- Figure 30: Asia Pacific Ready To Eat Soup Revenue (undefined), by Country 2025 & 2033
- Figure 31: Asia Pacific Ready To Eat Soup Revenue Share (%), by Country 2025 & 2033
List of Tables
- Table 1: Global Ready To Eat Soup Revenue undefined Forecast, by Application 2020 & 2033
- Table 2: Global Ready To Eat Soup Revenue undefined Forecast, by Type 2020 & 2033
- Table 3: Global Ready To Eat Soup Revenue undefined Forecast, by Region 2020 & 2033
- Table 4: Global Ready To Eat Soup Revenue undefined Forecast, by Application 2020 & 2033
- Table 5: Global Ready To Eat Soup Revenue undefined Forecast, by Type 2020 & 2033
- Table 6: Global Ready To Eat Soup Revenue undefined Forecast, by Country 2020 & 2033
- Table 7: United States Ready To Eat Soup Revenue (undefined) Forecast, by Application 2020 & 2033
- Table 8: Canada Ready To Eat Soup Revenue (undefined) Forecast, by Application 2020 & 2033
- Table 9: Mexico Ready To Eat Soup Revenue (undefined) Forecast, by Application 2020 & 2033
- Table 10: Global Ready To Eat Soup Revenue undefined Forecast, by Application 2020 & 2033
- Table 11: Global Ready To Eat Soup Revenue undefined Forecast, by Type 2020 & 2033
- Table 12: Global Ready To Eat Soup Revenue undefined Forecast, by Country 2020 & 2033
- Table 13: Brazil Ready To Eat Soup Revenue (undefined) Forecast, by Application 2020 & 2033
- Table 14: Argentina Ready To Eat Soup Revenue (undefined) Forecast, by Application 2020 & 2033
- Table 15: Rest of South America Ready To Eat Soup Revenue (undefined) Forecast, by Application 2020 & 2033
- Table 16: Global Ready To Eat Soup Revenue undefined Forecast, by Application 2020 & 2033
- Table 17: Global Ready To Eat Soup Revenue undefined Forecast, by Type 2020 & 2033
- Table 18: Global Ready To Eat Soup Revenue undefined Forecast, by Country 2020 & 2033
- Table 19: United Kingdom Ready To Eat Soup Revenue (undefined) Forecast, by Application 2020 & 2033
- Table 20: Germany Ready To Eat Soup Revenue (undefined) Forecast, by Application 2020 & 2033
- Table 21: France Ready To Eat Soup Revenue (undefined) Forecast, by Application 2020 & 2033
- Table 22: Italy Ready To Eat Soup Revenue (undefined) Forecast, by Application 2020 & 2033
- Table 23: Spain Ready To Eat Soup Revenue (undefined) Forecast, by Application 2020 & 2033
- Table 24: Russia Ready To Eat Soup Revenue (undefined) Forecast, by Application 2020 & 2033
- Table 25: Benelux Ready To Eat Soup Revenue (undefined) Forecast, by Application 2020 & 2033
- Table 26: Nordics Ready To Eat Soup Revenue (undefined) Forecast, by Application 2020 & 2033
- Table 27: Rest of Europe Ready To Eat Soup Revenue (undefined) Forecast, by Application 2020 & 2033
- Table 28: Global Ready To Eat Soup Revenue undefined Forecast, by Application 2020 & 2033
- Table 29: Global Ready To Eat Soup Revenue undefined Forecast, by Type 2020 & 2033
- Table 30: Global Ready To Eat Soup Revenue undefined Forecast, by Country 2020 & 2033
- Table 31: Turkey Ready To Eat Soup Revenue (undefined) Forecast, by Application 2020 & 2033
- Table 32: Israel Ready To Eat Soup Revenue (undefined) Forecast, by Application 2020 & 2033
- Table 33: GCC Ready To Eat Soup Revenue (undefined) Forecast, by Application 2020 & 2033
- Table 34: North Africa Ready To Eat Soup Revenue (undefined) Forecast, by Application 2020 & 2033
- Table 35: South Africa Ready To Eat Soup Revenue (undefined) Forecast, by Application 2020 & 2033
- Table 36: Rest of Middle East & Africa Ready To Eat Soup Revenue (undefined) Forecast, by Application 2020 & 2033
- Table 37: Global Ready To Eat Soup Revenue undefined Forecast, by Application 2020 & 2033
- Table 38: Global Ready To Eat Soup Revenue undefined Forecast, by Type 2020 & 2033
- Table 39: Global Ready To Eat Soup Revenue undefined Forecast, by Country 2020 & 2033
- Table 40: China Ready To Eat Soup Revenue (undefined) Forecast, by Application 2020 & 2033
- Table 41: India Ready To Eat Soup Revenue (undefined) Forecast, by Application 2020 & 2033
- Table 42: Japan Ready To Eat Soup Revenue (undefined) Forecast, by Application 2020 & 2033
- Table 43: South Korea Ready To Eat Soup Revenue (undefined) Forecast, by Application 2020 & 2033
- Table 44: ASEAN Ready To Eat Soup Revenue (undefined) Forecast, by Application 2020 & 2033
- Table 45: Oceania Ready To Eat Soup Revenue (undefined) Forecast, by Application 2020 & 2033
- Table 46: Rest of Asia Pacific Ready To Eat Soup Revenue (undefined) Forecast, by Application 2020 & 2033
Frequently Asked Questions
1. What is the projected Compound Annual Growth Rate (CAGR) of the Ready To Eat Soup?
The projected CAGR is approximately 7.7%.
2. Which companies are prominent players in the Ready To Eat Soup?
Key companies in the market include Campbell Soup, The Kraft Heinz, Hain Celestial Group, Amy's Kitchen, Baxters Food Group, New Covent Garden Soup, Princes Group (Crosse & Blackwell), Fazlani Foods.
3. What are the main segments of the Ready To Eat Soup?
The market segments include Application, Type.
4. Can you provide details about the market size?
The market size is estimated to be USD XXX N/A as of 2022.
5. What are some drivers contributing to market growth?
N/A
6. What are the notable trends driving market growth?
N/A
7. Are there any restraints impacting market growth?
N/A
8. Can you provide examples of recent developments in the market?
N/A
9. What pricing options are available for accessing the report?
Pricing options include single-user, multi-user, and enterprise licenses priced at USD 2900.00, USD 4350.00, and USD 5800.00 respectively.
10. Is the market size provided in terms of value or volume?
The market size is provided in terms of value, measured in N/A.
11. Are there any specific market keywords associated with the report?
Yes, the market keyword associated with the report is "Ready To Eat Soup," which aids in identifying and referencing the specific market segment covered.
12. How do I determine which pricing option suits my needs best?
The pricing options vary based on user requirements and access needs. Individual users may opt for single-user licenses, while businesses requiring broader access may choose multi-user or enterprise licenses for cost-effective access to the report.
13. Are there any additional resources or data provided in the Ready To Eat Soup report?
While the report offers comprehensive insights, it's advisable to review the specific contents or supplementary materials provided to ascertain if additional resources or data are available.
14. How can I stay updated on further developments or reports in the Ready To Eat Soup?
To stay informed about further developments, trends, and reports in the Ready To Eat Soup, consider subscribing to industry newsletters, following relevant companies and organizations, or regularly checking reputable industry news sources and publications.
Methodology
Step 1 - Identification of Relevant Samples Size from Population Database


Step 2 - Approaches for Defining Global Market Size (Value, Volume* & Price*)

Note*: In applicable scenarios
Step 3 - Data Sources
Primary Research
- Web Analytics
- Survey Reports
- Research Institute
- Latest Research Reports
- Opinion Leaders
Secondary Research
- Annual Reports
- White Paper
- Latest Press Release
- Industry Association
- Paid Database
- Investor Presentations

Step 4 - Data Triangulation
Involves using different sources of information in order to increase the validity of a study
These sources are likely to be stakeholders in a program - participants, other researchers, program staff, other community members, and so on.
Then we put all data in single framework & apply various statistical tools to find out the dynamic on the market.
During the analysis stage, feedback from the stakeholder groups would be compared to determine areas of agreement as well as areas of divergence