

Key Insights
The global refractory market, currently valued at approximately $XX million (estimated based on available data and industry trends), is projected to experience steady growth, exhibiting a Compound Annual Growth Rate (CAGR) of 4.00% from 2025 to 2033. This growth is driven by several key factors, including the increasing demand from the steel, cement, and glass industries. These sectors rely heavily on refractory materials for high-temperature applications in their manufacturing processes. Furthermore, technological advancements in refractory materials, leading to improved durability, energy efficiency, and longer lifespans, are contributing significantly to market expansion. The rising adoption of sustainable and eco-friendly refractory solutions is another significant driver, as companies strive to reduce their environmental footprint.
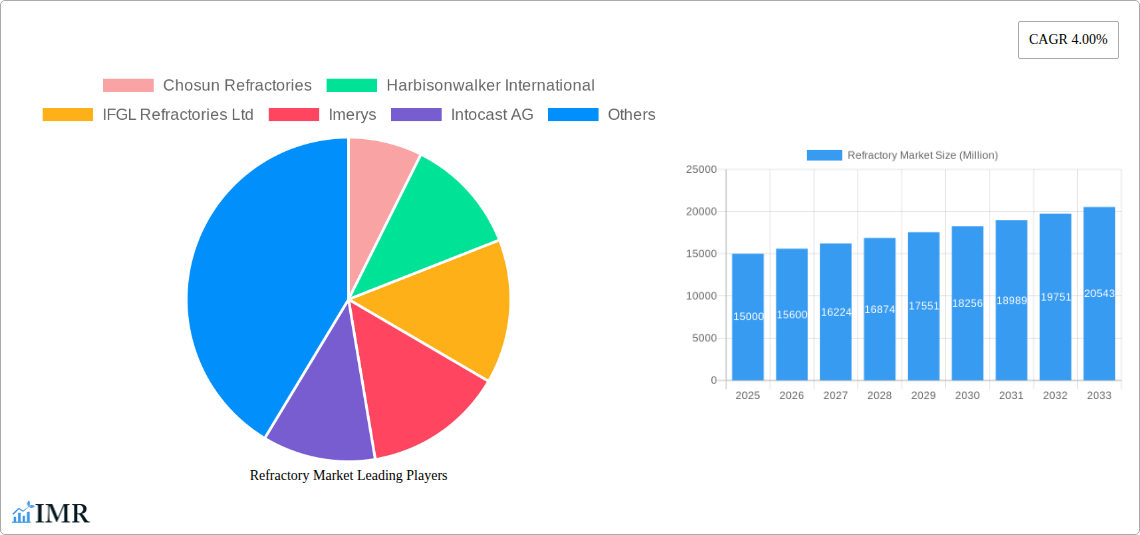
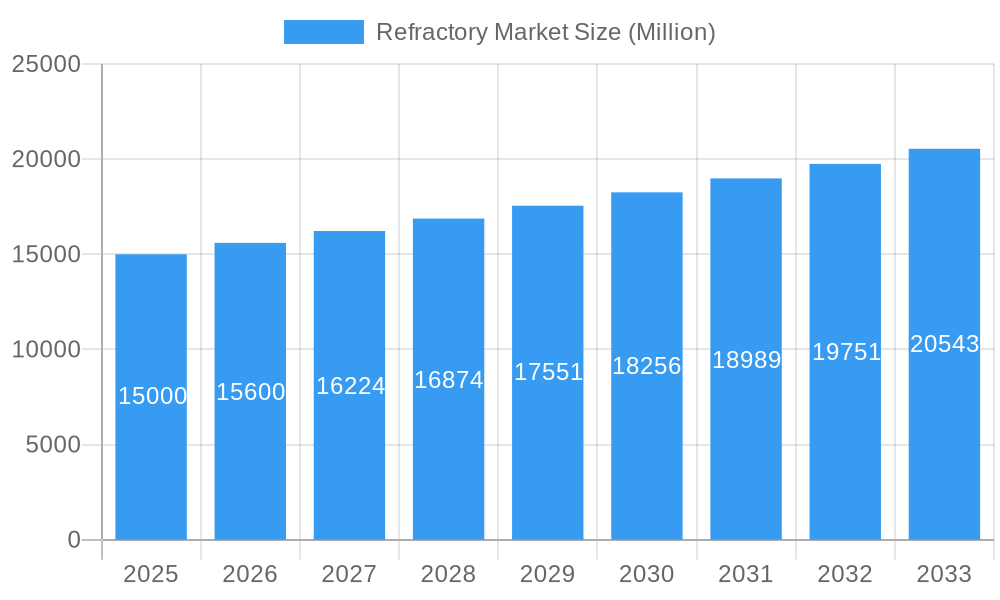
Refractory Market Market Size (In Billion)
However, the market faces certain challenges. Fluctuations in raw material prices, particularly those of key minerals used in refractory production, can impact profitability and pricing. Furthermore, stringent environmental regulations and increasing labor costs in some regions can pose restraints on market growth. The market is segmented based on material type (e.g., alumina, magnesia, silica), application (e.g., steelmaking, cement kilns), and geography. Major players like Chosun Refractories, HarbisonWalker International, Imerys, and RHI Magnesita are actively competing in this space, driving innovation and competition, which ultimately benefits end-users. The market is expected to witness significant regional variations in growth, with developing economies likely to show faster expansion due to rapid industrialization. Strategic mergers and acquisitions, coupled with investments in research and development, are likely to shape the competitive landscape in the coming years.
Refractory Market Company Market Share
Refractory Market Report: A Comprehensive Analysis (2019-2033)
This in-depth report provides a comprehensive analysis of the global refractory market, encompassing market dynamics, growth trends, regional dominance, product landscape, key players, and future outlook. The study period covers 2019-2033, with 2025 serving as the base and estimated year. The report leverages extensive data analysis to deliver actionable insights for industry professionals, investors, and strategic decision-makers. The market is segmented by various factors, including material type, application, and geography, providing a granular understanding of market performance across different segments. Parent market segments of industrial manufacturing and construction and its child segments of steel, cement, glass, and petrochemicals are included. The report also considers the impact of parent and child markets on refractory demand forecasting.
Refractory Market Dynamics & Structure
The global refractory market, valued at xx million in 2024, is characterized by moderate concentration, with several major players holding significant market shares. Technological innovation, driven by the need for improved material performance and energy efficiency, is a key market driver. Stringent environmental regulations are influencing material choices and manufacturing processes. The market is witnessing an increase in mergers and acquisitions (M&A) activity, indicating consolidation trends. Competitive substitutes, such as alternative materials with improved thermal and chemical resistance, present ongoing challenges. The end-user demographics are diverse, spanning various industrial sectors.
- Market Concentration: Moderately concentrated, with the top 5 players holding approximately xx% market share in 2024.
- Technological Innovation: Focus on high-performance materials with enhanced durability, thermal shock resistance, and corrosion resistance.
- Regulatory Framework: Stringent environmental regulations promoting sustainable manufacturing practices and the use of eco-friendly refractories.
- Competitive Substitutes: Alternative materials like ceramics and advanced composites pose a competitive threat.
- End-User Demographics: Steel, cement, glass, petrochemicals, and power generation sectors are key end-users.
- M&A Trends: Significant M&A activity observed in recent years, driven by expansion strategies and market consolidation. Approximately xx M&A deals were recorded between 2019 and 2024.
Refractory Market Growth Trends & Insights
The refractory market exhibits steady growth, driven by increasing industrial production, infrastructure development, and the demand for advanced materials in high-temperature applications. The market experienced a CAGR of xx% during the historical period (2019-2024) and is projected to grow at a CAGR of xx% during the forecast period (2025-2033), reaching a value of xx million by 2033. Technological disruptions, such as the introduction of advanced manufacturing techniques and novel refractory materials, are accelerating market growth. Changes in consumer behavior, reflecting a greater emphasis on sustainability and performance, are influencing product demand. Market penetration is expected to increase steadily across key industries.
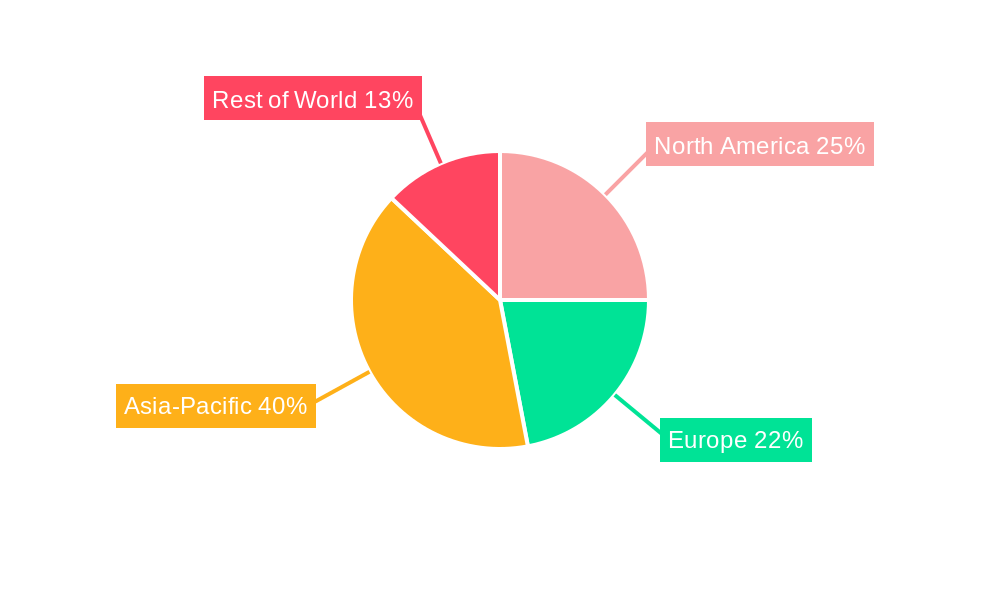
Dominant Regions, Countries, or Segments in Refractory Market
Asia-Pacific dominates the global refractory market, driven by robust industrial growth, particularly in China and India. The region benefits from extensive infrastructure development and a thriving manufacturing sector. Europe and North America also hold significant market share, although growth rates are comparatively slower. Key growth drivers in specific regions include:
- Asia-Pacific: Rapid industrialization, strong infrastructure spending, and increasing steel and cement production.
- Europe: Focus on high-performance materials and sustainable manufacturing practices.
- North America: Demand from the petrochemical and power generation sectors.
- Other Regions: Emerging economies in South America, the Middle East, and Africa offer growth potential.
Refractory Market Product Landscape
The refractory market encompasses a wide range of products, including monolithic refractories, shaped refractories, and specialty refractories. Ongoing innovations focus on enhancing thermal shock resistance, corrosion resistance, and service life. Unique selling propositions include improved energy efficiency, reduced maintenance costs, and environmentally friendly manufacturing processes. Advanced materials, such as ultra-high-temperature ceramics and composite refractories, are gaining traction.
Key Drivers, Barriers & Challenges in Refractory Market
Key Drivers:
- Increasing industrial production and infrastructure development globally.
- Stringent environmental regulations driving the adoption of eco-friendly materials.
- Growing demand for high-performance refractories in diverse industries.
Key Challenges:
- Fluctuations in raw material prices impacting profitability.
- Intense competition from established and emerging players.
- Supply chain disruptions impacting production and delivery timelines. (Estimated impact: xx% reduction in production capacity in 2024).
Emerging Opportunities in Refractory Market
- Untapped markets in developing economies.
- Increasing adoption of advanced manufacturing techniques.
- Growing demand for specialty refractories in niche applications (e.g., aerospace, energy).
Growth Accelerators in the Refractory Market Industry
Technological breakthroughs in material science, coupled with strategic partnerships between manufacturers and end-users, are key growth accelerators. Expanding into emerging markets and developing new applications in high-growth industries (such as renewable energy and advanced manufacturing) will also drive market expansion.
Key Players Shaping the Refractory Market Market
- Chosun Refractories
- HarbisonWalker International
- IFGL Refractories Ltd
- Imerys
- Intocast AG
- Krosaki Harima Corporation
- Magnezit Group
- Minerals Technologies Inc
- Morgan Advanced Materials
- Puyang Refractories Group Co Ltd
- Refratechnik
- RHI Magnesita GmbH
- Saint-Gobain
- Shinagawa Refractories Co Ltd
- Vesuvius *List Not Exhaustive
Notable Milestones in Refractory Market Sector
- April 2022: Saint-Gobain acquired Monofrax, strengthening its position in the American fused cast refractories market.
- December 2022: Shinagawa Refractories Co. Ltd acquired Saint-Gobain's Brazilian refractory and alumina-based ceramics business, expanding its product portfolio.
- January 2023: RHI Magnesita GmbH completed its acquisition of Dalmia Bharat Refractories Limited's Indian business, adding significant production capacity.
In-Depth Refractory Market Market Outlook
The refractory market is poised for sustained growth, driven by technological advancements, increasing industrial activity, and a growing focus on sustainability. Strategic partnerships and market expansion into emerging economies will further fuel market expansion. The potential for innovation in material science and the development of novel applications in high-growth sectors will significantly shape the future market landscape. The market is projected to reach xx million by 2033, representing significant growth opportunities for market participants.
Refractory Market Segmentation
-
1. Product Type
-
1.1. Non-clay Refractory
- 1.1.1. Magnesit
- 1.1.2. Zirconia Brick
- 1.1.3. Silica Brick
- 1.1.4. Chromite Brick
- 1.1.5. Other Product Types (Carbides, Silicates)
-
1.2. Clay Refractory
- 1.2.1. High Alumina
- 1.2.2. Fireclay
- 1.2.3. Insulating
-
1.1. Non-clay Refractory
-
2. End-user Industry
- 2.1. Iron and Steel
- 2.2. Energy and Chemicals
- 2.3. Non-ferrous Metals
- 2.4. Cement
- 2.5. Ceramic
- 2.6. Glass
- 2.7. Other End-user Industries
Refractory Market Segmentation By Geography
-
1. Asia Pacific
- 1.1. China
- 1.2. India
- 1.3. Japan
- 1.4. South Korea
- 1.5. Rest of Asia Pacific
-
2. North America
- 2.1. United States
- 2.2. Canada
- 2.3. Mexico
-
3. Europe
- 3.1. Germany
- 3.2. United Kingdom
- 3.3. Italy
- 3.4. France
- 3.5. Rest of Europe
-
4. South America
- 4.1. Brazil
- 4.2. Argentina
- 4.3. Rest of South America
-
5. Middle East and Africa
- 5.1. Saudi Arabia
- 5.2. South Africa
- 5.3. Rest of Middle East and Africa
Refractory Market Regional Market Share
Geographic Coverage of Refractory Market
Refractory Market REPORT HIGHLIGHTS
| Aspects | Details |
|---|---|
| Study Period | 2020-2034 |
| Base Year | 2025 |
| Estimated Year | 2026 |
| Forecast Period | 2026-2034 |
| Historical Period | 2020-2025 |
| Growth Rate | CAGR of 9.5% from 2020-2034 |
| Segmentation |
|
Table of Contents
- 1. Introduction
- 1.1. Research Scope
- 1.2. Market Segmentation
- 1.3. Research Objective
- 1.4. Definitions and Assumptions
- 2. Executive Summary
- 2.1. Market Snapshot
- 3. Market Dynamics
- 3.1. Market Drivers
- 3.2. Market Restrains
- 3.3. Market Trends
- 3.4. Market Opportunities
- 4. Market Factor Analysis
- 4.1. Porters Five Forces
- 4.1.1. Bargaining Power of Suppliers
- 4.1.2. Bargaining Power of Buyers
- 4.1.3. Threat of New Entrants
- 4.1.4. Threat of Substitutes
- 4.1.5. Competitive Rivalry
- 4.2. PESTEL analysis
- 4.3. BCG Analysis
- 4.3.1. Stars (High Growth, High Market Share)
- 4.3.2. Cash Cows (Low Growth, High Market Share)
- 4.3.3. Question Mark (High Growth, Low Market Share)
- 4.3.4. Dogs (Low Growth, Low Market Share)
- 4.4. Ansoff Matrix Analysis
- 4.5. Supply Chain Analysis
- 4.6. Regulatory Landscape
- 4.7. Current Market Potential and Opportunity Assessment (TAM–SAM–SOM Framework)
- 4.8. IMR Analyst Note
- 4.1. Porters Five Forces
- 5. Market Analysis, Insights and Forecast 2021-2033
- 5.1. Market Analysis, Insights and Forecast - by Product Type
- 5.1.1. Non-clay Refractory
- 5.1.1.1. Magnesit
- 5.1.1.2. Zirconia Brick
- 5.1.1.3. Silica Brick
- 5.1.1.4. Chromite Brick
- 5.1.1.5. Other Product Types (Carbides, Silicates)
- 5.1.2. Clay Refractory
- 5.1.2.1. High Alumina
- 5.1.2.2. Fireclay
- 5.1.2.3. Insulating
- 5.1.1. Non-clay Refractory
- 5.2. Market Analysis, Insights and Forecast - by End-user Industry
- 5.2.1. Iron and Steel
- 5.2.2. Energy and Chemicals
- 5.2.3. Non-ferrous Metals
- 5.2.4. Cement
- 5.2.5. Ceramic
- 5.2.6. Glass
- 5.2.7. Other End-user Industries
- 5.3. Market Analysis, Insights and Forecast - by Region
- 5.3.1. Asia Pacific
- 5.3.2. North America
- 5.3.3. Europe
- 5.3.4. South America
- 5.3.5. Middle East and Africa
- 5.1. Market Analysis, Insights and Forecast - by Product Type
- 6. Global Refractory Market Analysis, Insights and Forecast, 2021-2033
- 6.1. Market Analysis, Insights and Forecast - by Product Type
- 6.1.1. Non-clay Refractory
- 6.1.1.1. Magnesit
- 6.1.1.2. Zirconia Brick
- 6.1.1.3. Silica Brick
- 6.1.1.4. Chromite Brick
- 6.1.1.5. Other Product Types (Carbides, Silicates)
- 6.1.2. Clay Refractory
- 6.1.2.1. High Alumina
- 6.1.2.2. Fireclay
- 6.1.2.3. Insulating
- 6.1.1. Non-clay Refractory
- 6.2. Market Analysis, Insights and Forecast - by End-user Industry
- 6.2.1. Iron and Steel
- 6.2.2. Energy and Chemicals
- 6.2.3. Non-ferrous Metals
- 6.2.4. Cement
- 6.2.5. Ceramic
- 6.2.6. Glass
- 6.2.7. Other End-user Industries
- 6.1. Market Analysis, Insights and Forecast - by Product Type
- 7. Asia Pacific Refractory Market Analysis, Insights and Forecast, 2020-2032
- 7.1. Market Analysis, Insights and Forecast - by Product Type
- 7.1.1. Non-clay Refractory
- 7.1.1.1. Magnesit
- 7.1.1.2. Zirconia Brick
- 7.1.1.3. Silica Brick
- 7.1.1.4. Chromite Brick
- 7.1.1.5. Other Product Types (Carbides, Silicates)
- 7.1.2. Clay Refractory
- 7.1.2.1. High Alumina
- 7.1.2.2. Fireclay
- 7.1.2.3. Insulating
- 7.1.1. Non-clay Refractory
- 7.2. Market Analysis, Insights and Forecast - by End-user Industry
- 7.2.1. Iron and Steel
- 7.2.2. Energy and Chemicals
- 7.2.3. Non-ferrous Metals
- 7.2.4. Cement
- 7.2.5. Ceramic
- 7.2.6. Glass
- 7.2.7. Other End-user Industries
- 7.1. Market Analysis, Insights and Forecast - by Product Type
- 8. North America Refractory Market Analysis, Insights and Forecast, 2020-2032
- 8.1. Market Analysis, Insights and Forecast - by Product Type
- 8.1.1. Non-clay Refractory
- 8.1.1.1. Magnesit
- 8.1.1.2. Zirconia Brick
- 8.1.1.3. Silica Brick
- 8.1.1.4. Chromite Brick
- 8.1.1.5. Other Product Types (Carbides, Silicates)
- 8.1.2. Clay Refractory
- 8.1.2.1. High Alumina
- 8.1.2.2. Fireclay
- 8.1.2.3. Insulating
- 8.1.1. Non-clay Refractory
- 8.2. Market Analysis, Insights and Forecast - by End-user Industry
- 8.2.1. Iron and Steel
- 8.2.2. Energy and Chemicals
- 8.2.3. Non-ferrous Metals
- 8.2.4. Cement
- 8.2.5. Ceramic
- 8.2.6. Glass
- 8.2.7. Other End-user Industries
- 8.1. Market Analysis, Insights and Forecast - by Product Type
- 9. Europe Refractory Market Analysis, Insights and Forecast, 2020-2032
- 9.1. Market Analysis, Insights and Forecast - by Product Type
- 9.1.1. Non-clay Refractory
- 9.1.1.1. Magnesit
- 9.1.1.2. Zirconia Brick
- 9.1.1.3. Silica Brick
- 9.1.1.4. Chromite Brick
- 9.1.1.5. Other Product Types (Carbides, Silicates)
- 9.1.2. Clay Refractory
- 9.1.2.1. High Alumina
- 9.1.2.2. Fireclay
- 9.1.2.3. Insulating
- 9.1.1. Non-clay Refractory
- 9.2. Market Analysis, Insights and Forecast - by End-user Industry
- 9.2.1. Iron and Steel
- 9.2.2. Energy and Chemicals
- 9.2.3. Non-ferrous Metals
- 9.2.4. Cement
- 9.2.5. Ceramic
- 9.2.6. Glass
- 9.2.7. Other End-user Industries
- 9.1. Market Analysis, Insights and Forecast - by Product Type
- 10. South America Refractory Market Analysis, Insights and Forecast, 2020-2032
- 10.1. Market Analysis, Insights and Forecast - by Product Type
- 10.1.1. Non-clay Refractory
- 10.1.1.1. Magnesit
- 10.1.1.2. Zirconia Brick
- 10.1.1.3. Silica Brick
- 10.1.1.4. Chromite Brick
- 10.1.1.5. Other Product Types (Carbides, Silicates)
- 10.1.2. Clay Refractory
- 10.1.2.1. High Alumina
- 10.1.2.2. Fireclay
- 10.1.2.3. Insulating
- 10.1.1. Non-clay Refractory
- 10.2. Market Analysis, Insights and Forecast - by End-user Industry
- 10.2.1. Iron and Steel
- 10.2.2. Energy and Chemicals
- 10.2.3. Non-ferrous Metals
- 10.2.4. Cement
- 10.2.5. Ceramic
- 10.2.6. Glass
- 10.2.7. Other End-user Industries
- 10.1. Market Analysis, Insights and Forecast - by Product Type
- 11. Middle East and Africa Refractory Market Analysis, Insights and Forecast, 2020-2032
- 11.1. Market Analysis, Insights and Forecast - by Product Type
- 11.1.1. Non-clay Refractory
- 11.1.1.1. Magnesit
- 11.1.1.2. Zirconia Brick
- 11.1.1.3. Silica Brick
- 11.1.1.4. Chromite Brick
- 11.1.1.5. Other Product Types (Carbides, Silicates)
- 11.1.2. Clay Refractory
- 11.1.2.1. High Alumina
- 11.1.2.2. Fireclay
- 11.1.2.3. Insulating
- 11.1.1. Non-clay Refractory
- 11.2. Market Analysis, Insights and Forecast - by End-user Industry
- 11.2.1. Iron and Steel
- 11.2.2. Energy and Chemicals
- 11.2.3. Non-ferrous Metals
- 11.2.4. Cement
- 11.2.5. Ceramic
- 11.2.6. Glass
- 11.2.7. Other End-user Industries
- 11.1. Market Analysis, Insights and Forecast - by Product Type
- 12. Competitive Analysis
- 12.1. Company Profiles
- 12.1.1 Chosun Refractories
- 12.1.1.1. Company Overview
- 12.1.1.2. Products
- 12.1.1.3. Company Financials
- 12.1.1.4. SWOT Analysis
- 12.1.2 Harbisonwalker International
- 12.1.2.1. Company Overview
- 12.1.2.2. Products
- 12.1.2.3. Company Financials
- 12.1.2.4. SWOT Analysis
- 12.1.3 IFGL Refractories Ltd
- 12.1.3.1. Company Overview
- 12.1.3.2. Products
- 12.1.3.3. Company Financials
- 12.1.3.4. SWOT Analysis
- 12.1.4 Imerys
- 12.1.4.1. Company Overview
- 12.1.4.2. Products
- 12.1.4.3. Company Financials
- 12.1.4.4. SWOT Analysis
- 12.1.5 Intocast AG
- 12.1.5.1. Company Overview
- 12.1.5.2. Products
- 12.1.5.3. Company Financials
- 12.1.5.4. SWOT Analysis
- 12.1.6 Krosaki Harima Corporation
- 12.1.6.1. Company Overview
- 12.1.6.2. Products
- 12.1.6.3. Company Financials
- 12.1.6.4. SWOT Analysis
- 12.1.7 Magnezit Group
- 12.1.7.1. Company Overview
- 12.1.7.2. Products
- 12.1.7.3. Company Financials
- 12.1.7.4. SWOT Analysis
- 12.1.8 Minerals Technologies Inc
- 12.1.8.1. Company Overview
- 12.1.8.2. Products
- 12.1.8.3. Company Financials
- 12.1.8.4. SWOT Analysis
- 12.1.9 Morgan Advanced Materials
- 12.1.9.1. Company Overview
- 12.1.9.2. Products
- 12.1.9.3. Company Financials
- 12.1.9.4. SWOT Analysis
- 12.1.10 Puyang Refractories Group Co Ltd
- 12.1.10.1. Company Overview
- 12.1.10.2. Products
- 12.1.10.3. Company Financials
- 12.1.10.4. SWOT Analysis
- 12.1.11 Refratechnik
- 12.1.11.1. Company Overview
- 12.1.11.2. Products
- 12.1.11.3. Company Financials
- 12.1.11.4. SWOT Analysis
- 12.1.12 RHI Magnesita GmbH
- 12.1.12.1. Company Overview
- 12.1.12.2. Products
- 12.1.12.3. Company Financials
- 12.1.12.4. SWOT Analysis
- 12.1.13 Saint-Gobain
- 12.1.13.1. Company Overview
- 12.1.13.2. Products
- 12.1.13.3. Company Financials
- 12.1.13.4. SWOT Analysis
- 12.1.14 Shinagawa Refractories Co Ltd
- 12.1.14.1. Company Overview
- 12.1.14.2. Products
- 12.1.14.3. Company Financials
- 12.1.14.4. SWOT Analysis
- 12.1.15 Vesuvius*List Not Exhaustive
- 12.1.15.1. Company Overview
- 12.1.15.2. Products
- 12.1.15.3. Company Financials
- 12.1.15.4. SWOT Analysis
- 12.1.1 Chosun Refractories
- 12.2. Market Entropy
- 12.2.1 Company's Key Areas Served
- 12.2.2 Recent Developments
- 12.3. Company Market Share Analysis 2025
- 12.3.1 Top 5 Companies Market Share Analysis
- 12.3.2 Top 3 Companies Market Share Analysis
- 12.4. List of Potential Customers
- 13. Research Methodology
List of Figures
- Figure 1: Global Refractory Market Revenue Breakdown (billion, %) by Region 2025 & 2033
- Figure 2: Asia Pacific Refractory Market Revenue (billion), by Product Type 2025 & 2033
- Figure 3: Asia Pacific Refractory Market Revenue Share (%), by Product Type 2025 & 2033
- Figure 4: Asia Pacific Refractory Market Revenue (billion), by End-user Industry 2025 & 2033
- Figure 5: Asia Pacific Refractory Market Revenue Share (%), by End-user Industry 2025 & 2033
- Figure 6: Asia Pacific Refractory Market Revenue (billion), by Country 2025 & 2033
- Figure 7: Asia Pacific Refractory Market Revenue Share (%), by Country 2025 & 2033
- Figure 8: North America Refractory Market Revenue (billion), by Product Type 2025 & 2033
- Figure 9: North America Refractory Market Revenue Share (%), by Product Type 2025 & 2033
- Figure 10: North America Refractory Market Revenue (billion), by End-user Industry 2025 & 2033
- Figure 11: North America Refractory Market Revenue Share (%), by End-user Industry 2025 & 2033
- Figure 12: North America Refractory Market Revenue (billion), by Country 2025 & 2033
- Figure 13: North America Refractory Market Revenue Share (%), by Country 2025 & 2033
- Figure 14: Europe Refractory Market Revenue (billion), by Product Type 2025 & 2033
- Figure 15: Europe Refractory Market Revenue Share (%), by Product Type 2025 & 2033
- Figure 16: Europe Refractory Market Revenue (billion), by End-user Industry 2025 & 2033
- Figure 17: Europe Refractory Market Revenue Share (%), by End-user Industry 2025 & 2033
- Figure 18: Europe Refractory Market Revenue (billion), by Country 2025 & 2033
- Figure 19: Europe Refractory Market Revenue Share (%), by Country 2025 & 2033
- Figure 20: South America Refractory Market Revenue (billion), by Product Type 2025 & 2033
- Figure 21: South America Refractory Market Revenue Share (%), by Product Type 2025 & 2033
- Figure 22: South America Refractory Market Revenue (billion), by End-user Industry 2025 & 2033
- Figure 23: South America Refractory Market Revenue Share (%), by End-user Industry 2025 & 2033
- Figure 24: South America Refractory Market Revenue (billion), by Country 2025 & 2033
- Figure 25: South America Refractory Market Revenue Share (%), by Country 2025 & 2033
- Figure 26: Middle East and Africa Refractory Market Revenue (billion), by Product Type 2025 & 2033
- Figure 27: Middle East and Africa Refractory Market Revenue Share (%), by Product Type 2025 & 2033
- Figure 28: Middle East and Africa Refractory Market Revenue (billion), by End-user Industry 2025 & 2033
- Figure 29: Middle East and Africa Refractory Market Revenue Share (%), by End-user Industry 2025 & 2033
- Figure 30: Middle East and Africa Refractory Market Revenue (billion), by Country 2025 & 2033
- Figure 31: Middle East and Africa Refractory Market Revenue Share (%), by Country 2025 & 2033
List of Tables
- Table 1: Global Refractory Market Revenue billion Forecast, by Product Type 2020 & 2033
- Table 2: Global Refractory Market Revenue billion Forecast, by End-user Industry 2020 & 2033
- Table 3: Global Refractory Market Revenue billion Forecast, by Region 2020 & 2033
- Table 4: Global Refractory Market Revenue billion Forecast, by Product Type 2020 & 2033
- Table 5: Global Refractory Market Revenue billion Forecast, by End-user Industry 2020 & 2033
- Table 6: Global Refractory Market Revenue billion Forecast, by Country 2020 & 2033
- Table 7: China Refractory Market Revenue (billion) Forecast, by Application 2020 & 2033
- Table 8: India Refractory Market Revenue (billion) Forecast, by Application 2020 & 2033
- Table 9: Japan Refractory Market Revenue (billion) Forecast, by Application 2020 & 2033
- Table 10: South Korea Refractory Market Revenue (billion) Forecast, by Application 2020 & 2033
- Table 11: Rest of Asia Pacific Refractory Market Revenue (billion) Forecast, by Application 2020 & 2033
- Table 12: Global Refractory Market Revenue billion Forecast, by Product Type 2020 & 2033
- Table 13: Global Refractory Market Revenue billion Forecast, by End-user Industry 2020 & 2033
- Table 14: Global Refractory Market Revenue billion Forecast, by Country 2020 & 2033
- Table 15: United States Refractory Market Revenue (billion) Forecast, by Application 2020 & 2033
- Table 16: Canada Refractory Market Revenue (billion) Forecast, by Application 2020 & 2033
- Table 17: Mexico Refractory Market Revenue (billion) Forecast, by Application 2020 & 2033
- Table 18: Global Refractory Market Revenue billion Forecast, by Product Type 2020 & 2033
- Table 19: Global Refractory Market Revenue billion Forecast, by End-user Industry 2020 & 2033
- Table 20: Global Refractory Market Revenue billion Forecast, by Country 2020 & 2033
- Table 21: Germany Refractory Market Revenue (billion) Forecast, by Application 2020 & 2033
- Table 22: United Kingdom Refractory Market Revenue (billion) Forecast, by Application 2020 & 2033
- Table 23: Italy Refractory Market Revenue (billion) Forecast, by Application 2020 & 2033
- Table 24: France Refractory Market Revenue (billion) Forecast, by Application 2020 & 2033
- Table 25: Rest of Europe Refractory Market Revenue (billion) Forecast, by Application 2020 & 2033
- Table 26: Global Refractory Market Revenue billion Forecast, by Product Type 2020 & 2033
- Table 27: Global Refractory Market Revenue billion Forecast, by End-user Industry 2020 & 2033
- Table 28: Global Refractory Market Revenue billion Forecast, by Country 2020 & 2033
- Table 29: Brazil Refractory Market Revenue (billion) Forecast, by Application 2020 & 2033
- Table 30: Argentina Refractory Market Revenue (billion) Forecast, by Application 2020 & 2033
- Table 31: Rest of South America Refractory Market Revenue (billion) Forecast, by Application 2020 & 2033
- Table 32: Global Refractory Market Revenue billion Forecast, by Product Type 2020 & 2033
- Table 33: Global Refractory Market Revenue billion Forecast, by End-user Industry 2020 & 2033
- Table 34: Global Refractory Market Revenue billion Forecast, by Country 2020 & 2033
- Table 35: Saudi Arabia Refractory Market Revenue (billion) Forecast, by Application 2020 & 2033
- Table 36: South Africa Refractory Market Revenue (billion) Forecast, by Application 2020 & 2033
- Table 37: Rest of Middle East and Africa Refractory Market Revenue (billion) Forecast, by Application 2020 & 2033
Frequently Asked Questions
1. What is the projected Compound Annual Growth Rate (CAGR) of the Refractory Market?
The projected CAGR is approximately 9.5%.
2. Which companies are prominent players in the Refractory Market?
Key companies in the market include Chosun Refractories, Harbisonwalker International, IFGL Refractories Ltd, Imerys, Intocast AG, Krosaki Harima Corporation, Magnezit Group, Minerals Technologies Inc, Morgan Advanced Materials, Puyang Refractories Group Co Ltd, Refratechnik, RHI Magnesita GmbH, Saint-Gobain, Shinagawa Refractories Co Ltd, Vesuvius*List Not Exhaustive.
3. What are the main segments of the Refractory Market?
The market segments include Product Type, End-user Industry.
4. Can you provide details about the market size?
The market size is estimated to be USD 47.88 billion as of 2022.
5. What are some drivers contributing to market growth?
Continuous Usage of Refractories in the Iron and Steel Industry; Increase in the Production of Non-ferrous Metals.
6. What are the notable trends driving market growth?
Increasing Demand from the Iron and Steel Industry.
7. Are there any restraints impacting market growth?
Continuous Usage of Refractories in the Iron and Steel Industry; Increase in the Production of Non-ferrous Metals.
8. Can you provide examples of recent developments in the market?
January 2023: RHI Magnesita GmbH announced the completion of its acquisition of Dalmia Bharat Refractories Limited's (DBRL) Indian refractory business is expected to add almost 300,000 tons of capacity annually to the existing production footprint in India, enhancing the company's business in the studied market.
9. What pricing options are available for accessing the report?
Pricing options include single-user, multi-user, and enterprise licenses priced at USD 4750, USD 5250, and USD 8750 respectively.
10. Is the market size provided in terms of value or volume?
The market size is provided in terms of value, measured in billion.
11. Are there any specific market keywords associated with the report?
Yes, the market keyword associated with the report is "Refractory Market," which aids in identifying and referencing the specific market segment covered.
12. How do I determine which pricing option suits my needs best?
The pricing options vary based on user requirements and access needs. Individual users may opt for single-user licenses, while businesses requiring broader access may choose multi-user or enterprise licenses for cost-effective access to the report.
13. Are there any additional resources or data provided in the Refractory Market report?
While the report offers comprehensive insights, it's advisable to review the specific contents or supplementary materials provided to ascertain if additional resources or data are available.
14. How can I stay updated on further developments or reports in the Refractory Market?
To stay informed about further developments, trends, and reports in the Refractory Market, consider subscribing to industry newsletters, following relevant companies and organizations, or regularly checking reputable industry news sources and publications.
Methodology
Step 1 - Identification of Relevant Samples Size from Population Database


Step 2 - Approaches for Defining Global Market Size (Value, Volume* & Price*)

Note*: In applicable scenarios
Step 3 - Data Sources
Primary Research
- Web Analytics
- Survey Reports
- Research Institute
- Latest Research Reports
- Opinion Leaders
Secondary Research
- Annual Reports
- White Paper
- Latest Press Release
- Industry Association
- Paid Database
- Investor Presentations

Step 4 - Data Triangulation
Involves using different sources of information in order to increase the validity of a study
These sources are likely to be stakeholders in a program - participants, other researchers, program staff, other community members, and so on.
Then we put all data in single framework & apply various statistical tools to find out the dynamic on the market.
During the analysis stage, feedback from the stakeholder groups would be compared to determine areas of agreement as well as areas of divergence