

Key Insights
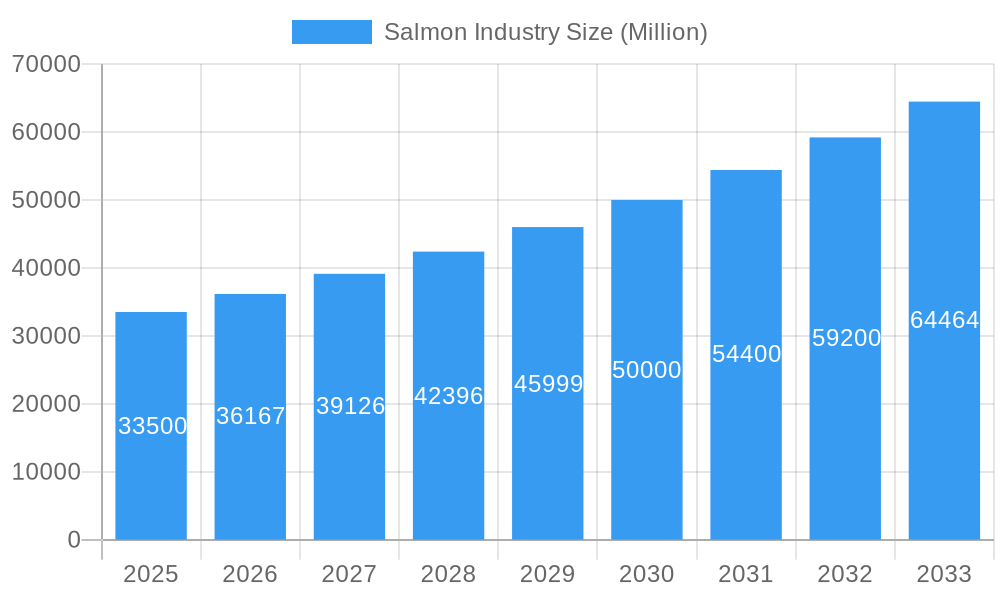
The global salmon industry, valued at $33.5 billion in 2025, is projected to experience robust growth, exhibiting a compound annual growth rate (CAGR) of 8.07% from 2025 to 2033. This expansion is driven by several factors. Increasing consumer demand for healthy protein sources, fueled by growing awareness of the nutritional benefits of salmon, is a significant contributor. Furthermore, the rising popularity of sushi and other salmon-centric dishes globally fuels market expansion. Sustainable aquaculture practices are also playing a crucial role, improving the efficiency and environmental impact of salmon farming, thereby increasing supply to meet the growing demand. The industry's segmentation reveals that farmed salmon currently dominates the market share, although wild-caught salmon still holds a significant niche. Atlantic salmon accounts for the largest share among species types, reflecting its popularity and widespread availability. Key players like Leroy Seafood Group, Cooke Aquaculture, Cermaq, Mowi, and Grieg Seafood are leveraging advancements in aquaculture technology and strategic partnerships to maintain their market positions and capitalize on emerging opportunities. Regional variations exist, with North America and Europe currently representing significant market shares. However, the Asia-Pacific region shows strong growth potential, driven by increasing consumption and the expansion of the middle class in countries like China and Japan.
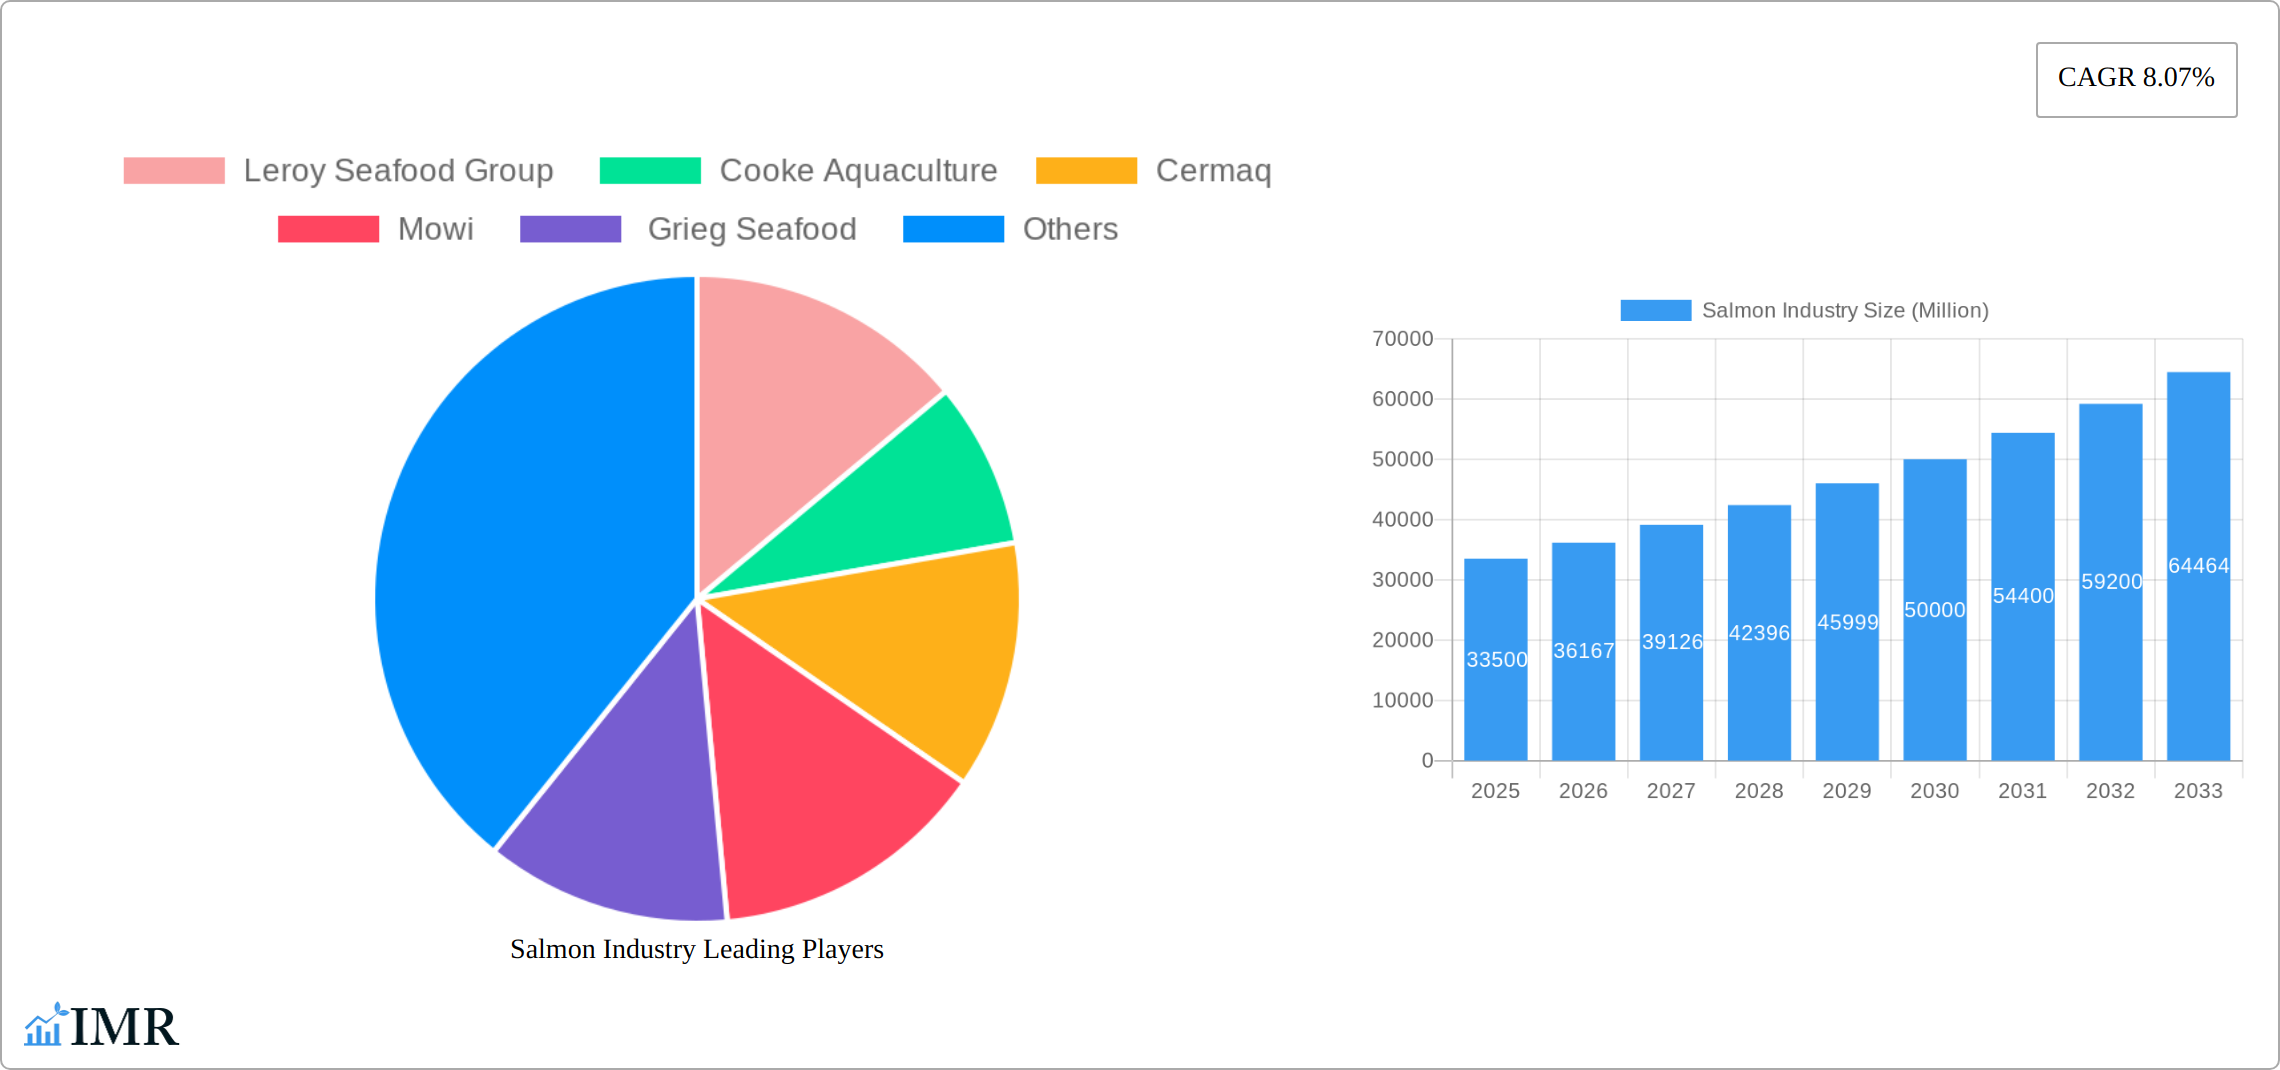
Salmon Industry Market Size (In Billion)
The future of the salmon industry hinges on several crucial aspects. Maintaining sustainable and ethical farming practices will be paramount to address environmental concerns and ensure long-term market stability. Innovation in aquaculture technology, focusing on reducing environmental impact and enhancing efficiency, will be key to meeting the growing global demand. Furthermore, effective supply chain management and robust marketing strategies will be critical for companies to navigate the competitive landscape and effectively reach consumers. Addressing potential challenges like disease outbreaks and fluctuating market prices will also be crucial for continued growth. Overall, the outlook for the salmon industry remains positive, driven by sustained consumer demand and continuous industry innovation.
Salmon Industry Company Market Share
Salmon Industry Market Report: 2019-2033
This comprehensive report provides a detailed analysis of the global salmon industry, encompassing market dynamics, growth trends, regional performance, and key players. The study period covers 2019-2033, with a focus on the forecast period (2025-2033), base year (2025), and estimated year (2025). The report segments the market by type (farmed, wild-captured) and species (Atlantic Salmon, Coho Salmon, Masu Salmon, Chinook Salmon, Other Species Types). Key players such as Leroy Seafood Group, Cooke Aquaculture, Cermaq, Mowi, and Grieg Seafood are analyzed in detail. The report is designed to provide valuable insights for industry professionals, investors, and stakeholders.
Salmon Industry Market Dynamics & Structure
The global salmon market exhibits moderate concentration, with a few dominant players commanding significant market share. While precise figures fluctuate, Mowi, Leroy Seafood Group, and Cooke Aquaculture consistently rank among the leading producers. The market is dynamic, shaped by several key factors. Technological advancements, particularly in Recirculating Aquaculture Systems (RAS) and selective breeding, are driving efficiency and sustainability improvements. Stringent regulatory frameworks, focusing on environmental impact, traceability, and responsible aquaculture practices, significantly influence operational strategies and costs. Wild-caught salmon faces ongoing competition from farmed salmon due to price volatility and supply limitations inherent in wild-capture. Consumer preferences are increasingly emphasizing sustainability, ethical sourcing, and product traceability, placing pressure on producers to meet these demands. Mergers and acquisitions (M&A) activity remains a prominent feature, fueled by expansion strategies and the pursuit of economies of scale; substantial investments have been made in the sector over recent years (e.g., approximately XX million USD in deals between 2019-2024).
- Market Concentration: Oligopolistic, with leading producers holding a substantial share of the global market.
- Technological Innovation: RAS technology, improved feed formulations (e.g., incorporating alternative protein sources), advanced disease management, and selective breeding for improved growth and disease resistance are key drivers.
- Regulatory Framework: Growing emphasis on environmental sustainability (e.g., reduced environmental impact, responsible waste management), traceability (e.g., blockchain technology for supply chain transparency), and adherence to strict aquaculture standards.
- Competitive Substitutes: Other seafood species (e.g., cod, tuna, trout), plant-based protein alternatives (e.g., tofu, seitan), and cultured seafood.
- End-User Demographics: Increasing demand from health-conscious consumers seeking high-protein, omega-3-rich foods; rising disposable incomes in emerging markets are also expanding market opportunities.
- M&A Trends: Consolidation continues, driven by expansion into new markets, access to technology, and the realization of economies of scale. Significant capital investment characterizes the sector.
Salmon Industry Growth Trends & Insights
The global salmon market experienced substantial growth during the historical period (2019-2024), driven by increasing consumer demand and aquaculture production improvements. The market size reached an estimated xx million USD in 2025. The CAGR for the historical period was xx%, and we forecast a CAGR of xx% during 2025-2033, reaching an estimated xx million USD by 2033. This growth is fueled by rising consumer awareness of the health benefits of salmon, increasing disposable incomes, particularly in Asia and Latin America, and continuous innovation in aquaculture technologies that improve production efficiency and reduce costs. However, challenges like disease outbreaks, environmental concerns, and fluctuations in feed prices pose potential risks. Market penetration in key regions is steadily increasing, with higher adoption rates observed in developed markets compared to developing economies.
Dominant Regions, Countries, or Segments in Salmon Industry
Norway and Chile are the dominant producers of farmed salmon, accounting for xx% and xx% of the global market share in 2025, respectively. Atlantic salmon remains the most consumed species, representing approximately xx% of the total market. The farmed salmon segment dominates the market with a share of xx% in 2025, driven by factors such as efficient production and consistent supply. Wild-caught salmon still holds a significant portion of the market, but its share is declining due to supply constraints and environmental concerns.
- Key Drivers for Farmed Salmon: Technological advancements, efficient production systems, and government support.
- Key Drivers for Norway: Established aquaculture infrastructure, favorable regulatory environment, and access to technology.
- Key Drivers for Chile: Favorable geographic conditions, abundant resources, and access to global markets.
- Key Drivers for Atlantic Salmon: High consumer demand, established distribution channels, and brand recognition.
Salmon Industry Product Landscape
The salmon industry provides a diverse range of products, encompassing fresh, frozen, and processed options (smoked, canned, etc.). Value-added products such as premium salmon fillets, steaks, and sushi-grade portions command higher prices. Technological advancements have led to innovations in packaging to extend shelf life and maintain product quality, alongside improvements in farming practices that enhance sustainability and reduce environmental impact. Key differentiators often center on origin, sustainability certifications (e.g., ASC, BAP), and comprehensive traceability systems allowing consumers to track the product from farm to table.
Key Drivers, Barriers & Challenges in Salmon Industry
Key Drivers:
- Growing consumer demand for healthy protein sources.
- Technological advancements in aquaculture.
- Government support and investment in sustainable aquaculture.
Key Challenges:
- Disease outbreaks impacting production and supply.
- Fluctuating feed prices increasing production costs. (Estimated impact on profitability: xx% in 2025)
- Environmental concerns related to aquaculture practices.
- Stringent regulations and compliance costs.
Emerging Opportunities in Salmon Industry
- Market Expansion: Significant growth potential exists in rapidly developing economies in Asia, Africa, and Latin America, where rising middle classes are increasing seafood consumption.
- Value-Added Products: Developing innovative ready-to-eat meals, convenient portion sizes, and customized product offerings to cater to changing consumer preferences.
- Sustainable Production: Investing in and promoting sustainable aquaculture practices, including RAS technology, reduced reliance on wild-caught feed ingredients, and minimized environmental impact, to meet growing consumer demand for ethically and sustainably sourced products.
- Technology Integration: Embracing data analytics, AI, and automation to optimize farming operations, improve efficiency, and enhance product traceability.
Growth Accelerators in the Salmon Industry
Several key factors will drive future growth in the salmon industry. Continued technological breakthroughs, such as advancements in disease prevention and feed efficiency, are paramount. Strategic partnerships focused on expanding market access and distribution channels will be critical. Expansion into high-growth markets, particularly in developing economies, presents significant opportunities. Perhaps most importantly, ongoing innovation in sustainable aquaculture practices will not only address environmental concerns but also solidify the industry's reputation as a responsible producer of high-quality, nutritious protein. This will be vital in maintaining consumer trust and driving long-term market sustainability.
Key Players Shaping the Salmon Industry Market
Notable Milestones in Salmon Industry Sector
- 2020: Widespread adoption of RAS technology by major players signaled a significant shift toward more sustainable and controlled aquaculture practices.
- 2022: The launch of new, widely adopted sustainable certification programs strengthened the industry’s commitment to environmental responsibility and transparency.
- 2023: Substantial increases in research and development investment, particularly in disease resistance and selective breeding, showcased a focus on improving the long-term health and productivity of salmon stocks.
- Ongoing: The continuous evolution of consumer preferences and regulatory frameworks requires ongoing adaptation and innovation within the industry.
In-Depth Salmon Industry Market Outlook
The salmon industry is poised for continued growth, driven by increasing global demand, technological advancements, and a growing focus on sustainability. Strategic partnerships, investment in innovation, and expansion into new markets will be crucial for long-term success. The market is expected to witness further consolidation, with larger players potentially acquiring smaller companies to enhance their market position and expand their production capacity.
Salmon Industry Segmentation
-
1. Species Type
- 1.1. Atlantic Salmon
- 1.2. Coho Salmon
- 1.3. Masu Salmon
- 1.4. Chinook Salmon
- 1.5. Other Species Types
-
2. Type
- 2.1. Farmed
- 2.2. Wild Captured
-
3. Species Type
- 3.1. Atlantic Salmon
- 3.2. Coho Salmon
- 3.3. Masu Salmon
- 3.4. Chinook Salmon
- 3.5. Other Species Types
-
4. Type
- 4.1. Farmed
- 4.2. Wild Captured
Salmon Industry Segmentation By Geography
-
1. North America
- 1.1. United States
- 1.2. Canada
-
2. Europe
- 2.1. Norway
- 2.2. Spain
- 2.3. Netherlands
- 2.4. France
- 2.5. Italy
- 2.6. Greece
- 2.7. United Kingdom
- 2.8. Scotland
-
3. Asia Pacific
- 3.1. China
- 3.2. Japan
- 3.3. Australia
-
4. South America
- 4.1. Chile
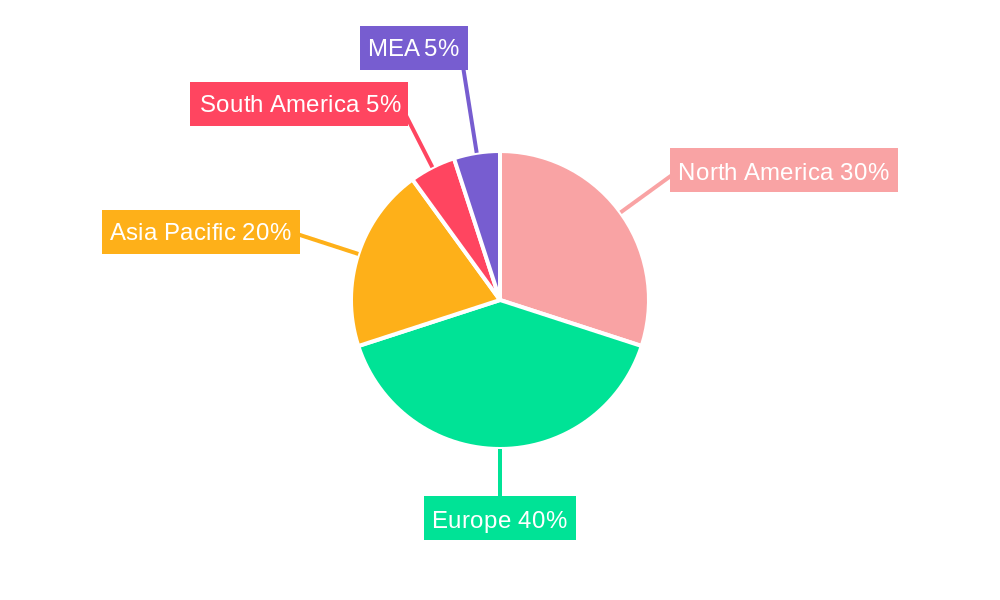
Salmon Industry Regional Market Share
Geographic Coverage of Salmon Industry
Salmon Industry REPORT HIGHLIGHTS
| Aspects | Details |
|---|---|
| Study Period | 2020-2034 |
| Base Year | 2025 |
| Estimated Year | 2026 |
| Forecast Period | 2026-2034 |
| Historical Period | 2020-2025 |
| Growth Rate | CAGR of 8.07% from 2020-2034 |
| Segmentation |
|
Table of Contents
- 1. Introduction
- 1.1. Research Scope
- 1.2. Market Segmentation
- 1.3. Research Objective
- 1.4. Definitions and Assumptions
- 2. Executive Summary
- 2.1. Market Snapshot
- 3. Market Dynamics
- 3.1. Market Drivers
- 3.2. Market Restrains
- 3.3. Market Trends
- 3.4. Market Opportunities
- 4. Market Factor Analysis
- 4.1. Porters Five Forces
- 4.1.1. Bargaining Power of Suppliers
- 4.1.2. Bargaining Power of Buyers
- 4.1.3. Threat of New Entrants
- 4.1.4. Threat of Substitutes
- 4.1.5. Competitive Rivalry
- 4.2. PESTEL analysis
- 4.3. BCG Analysis
- 4.3.1. Stars (High Growth, High Market Share)
- 4.3.2. Cash Cows (Low Growth, High Market Share)
- 4.3.3. Question Mark (High Growth, Low Market Share)
- 4.3.4. Dogs (Low Growth, Low Market Share)
- 4.4. Ansoff Matrix Analysis
- 4.5. Supply Chain Analysis
- 4.6. Regulatory Landscape
- 4.7. Current Market Potential and Opportunity Assessment (TAM–SAM–SOM Framework)
- 4.8. IMR Analyst Note
- 4.1. Porters Five Forces
- 5. Market Analysis, Insights and Forecast 2021-2033
- 5.1. Market Analysis, Insights and Forecast - by Species Type
- 5.1.1. Atlantic Salmon
- 5.1.2. Coho Salmon
- 5.1.3. Masu Salmon
- 5.1.4. Chinook Salmon
- 5.1.5. Other Species Types
- 5.2. Market Analysis, Insights and Forecast - by Type
- 5.2.1. Farmed
- 5.2.2. Wild Captured
- 5.3. Market Analysis, Insights and Forecast - by Species Type
- 5.3.1. Atlantic Salmon
- 5.3.2. Coho Salmon
- 5.3.3. Masu Salmon
- 5.3.4. Chinook Salmon
- 5.3.5. Other Species Types
- 5.4. Market Analysis, Insights and Forecast - by Type
- 5.4.1. Farmed
- 5.4.2. Wild Captured
- 5.5. Market Analysis, Insights and Forecast - by Region
- 5.5.1. North America
- 5.5.2. Europe
- 5.5.3. Asia Pacific
- 5.5.4. South America
- 5.1. Market Analysis, Insights and Forecast - by Species Type
- 6. Global Salmon Industry Analysis, Insights and Forecast, 2021-2033
- 6.1. Market Analysis, Insights and Forecast - by Species Type
- 6.1.1. Atlantic Salmon
- 6.1.2. Coho Salmon
- 6.1.3. Masu Salmon
- 6.1.4. Chinook Salmon
- 6.1.5. Other Species Types
- 6.2. Market Analysis, Insights and Forecast - by Type
- 6.2.1. Farmed
- 6.2.2. Wild Captured
- 6.3. Market Analysis, Insights and Forecast - by Species Type
- 6.3.1. Atlantic Salmon
- 6.3.2. Coho Salmon
- 6.3.3. Masu Salmon
- 6.3.4. Chinook Salmon
- 6.3.5. Other Species Types
- 6.4. Market Analysis, Insights and Forecast - by Type
- 6.4.1. Farmed
- 6.4.2. Wild Captured
- 6.1. Market Analysis, Insights and Forecast - by Species Type
- 7. North America Salmon Industry Analysis, Insights and Forecast, 2020-2032
- 7.1. Market Analysis, Insights and Forecast - by Species Type
- 7.1.1. Atlantic Salmon
- 7.1.2. Coho Salmon
- 7.1.3. Masu Salmon
- 7.1.4. Chinook Salmon
- 7.1.5. Other Species Types
- 7.2. Market Analysis, Insights and Forecast - by Type
- 7.2.1. Farmed
- 7.2.2. Wild Captured
- 7.3. Market Analysis, Insights and Forecast - by Species Type
- 7.3.1. Atlantic Salmon
- 7.3.2. Coho Salmon
- 7.3.3. Masu Salmon
- 7.3.4. Chinook Salmon
- 7.3.5. Other Species Types
- 7.4. Market Analysis, Insights and Forecast - by Type
- 7.4.1. Farmed
- 7.4.2. Wild Captured
- 7.1. Market Analysis, Insights and Forecast - by Species Type
- 8. Europe Salmon Industry Analysis, Insights and Forecast, 2020-2032
- 8.1. Market Analysis, Insights and Forecast - by Species Type
- 8.1.1. Atlantic Salmon
- 8.1.2. Coho Salmon
- 8.1.3. Masu Salmon
- 8.1.4. Chinook Salmon
- 8.1.5. Other Species Types
- 8.2. Market Analysis, Insights and Forecast - by Type
- 8.2.1. Farmed
- 8.2.2. Wild Captured
- 8.3. Market Analysis, Insights and Forecast - by Species Type
- 8.3.1. Atlantic Salmon
- 8.3.2. Coho Salmon
- 8.3.3. Masu Salmon
- 8.3.4. Chinook Salmon
- 8.3.5. Other Species Types
- 8.4. Market Analysis, Insights and Forecast - by Type
- 8.4.1. Farmed
- 8.4.2. Wild Captured
- 8.1. Market Analysis, Insights and Forecast - by Species Type
- 9. Asia Pacific Salmon Industry Analysis, Insights and Forecast, 2020-2032
- 9.1. Market Analysis, Insights and Forecast - by Species Type
- 9.1.1. Atlantic Salmon
- 9.1.2. Coho Salmon
- 9.1.3. Masu Salmon
- 9.1.4. Chinook Salmon
- 9.1.5. Other Species Types
- 9.2. Market Analysis, Insights and Forecast - by Type
- 9.2.1. Farmed
- 9.2.2. Wild Captured
- 9.3. Market Analysis, Insights and Forecast - by Species Type
- 9.3.1. Atlantic Salmon
- 9.3.2. Coho Salmon
- 9.3.3. Masu Salmon
- 9.3.4. Chinook Salmon
- 9.3.5. Other Species Types
- 9.4. Market Analysis, Insights and Forecast - by Type
- 9.4.1. Farmed
- 9.4.2. Wild Captured
- 9.1. Market Analysis, Insights and Forecast - by Species Type
- 10. South America Salmon Industry Analysis, Insights and Forecast, 2020-2032
- 10.1. Market Analysis, Insights and Forecast - by Species Type
- 10.1.1. Atlantic Salmon
- 10.1.2. Coho Salmon
- 10.1.3. Masu Salmon
- 10.1.4. Chinook Salmon
- 10.1.5. Other Species Types
- 10.2. Market Analysis, Insights and Forecast - by Type
- 10.2.1. Farmed
- 10.2.2. Wild Captured
- 10.3. Market Analysis, Insights and Forecast - by Species Type
- 10.3.1. Atlantic Salmon
- 10.3.2. Coho Salmon
- 10.3.3. Masu Salmon
- 10.3.4. Chinook Salmon
- 10.3.5. Other Species Types
- 10.4. Market Analysis, Insights and Forecast - by Type
- 10.4.1. Farmed
- 10.4.2. Wild Captured
- 10.1. Market Analysis, Insights and Forecast - by Species Type
- 11. Competitive Analysis
- 11.1. Company Profiles
- 11.1.1 Leroy Seafood Group
- 11.1.1.1. Company Overview
- 11.1.1.2. Products
- 11.1.1.3. Company Financials
- 11.1.1.4. SWOT Analysis
- 11.1.2 Cooke Aquaculture
- 11.1.2.1. Company Overview
- 11.1.2.2. Products
- 11.1.2.3. Company Financials
- 11.1.2.4. SWOT Analysis
- 11.1.3 Cermaq
- 11.1.3.1. Company Overview
- 11.1.3.2. Products
- 11.1.3.3. Company Financials
- 11.1.3.4. SWOT Analysis
- 11.1.4 Mowi
- 11.1.4.1. Company Overview
- 11.1.4.2. Products
- 11.1.4.3. Company Financials
- 11.1.4.4. SWOT Analysis
- 11.1.5 Grieg Seafood
- 11.1.5.1. Company Overview
- 11.1.5.2. Products
- 11.1.5.3. Company Financials
- 11.1.5.4. SWOT Analysis
- 11.1.1 Leroy Seafood Group
- 11.2. Market Entropy
- 11.2.1 Company's Key Areas Served
- 11.2.2 Recent Developments
- 11.3. Company Market Share Analysis 2025
- 11.3.1 Top 5 Companies Market Share Analysis
- 11.3.2 Top 3 Companies Market Share Analysis
- 11.4. List of Potential Customers
- 12. Research Methodology
List of Figures
- Figure 1: Global Salmon Industry Revenue Breakdown (Million, %) by Region 2025 & 2033
- Figure 2: North America Salmon Industry Revenue (Million), by Species Type 2025 & 2033
- Figure 3: North America Salmon Industry Revenue Share (%), by Species Type 2025 & 2033
- Figure 4: North America Salmon Industry Revenue (Million), by Type 2025 & 2033
- Figure 5: North America Salmon Industry Revenue Share (%), by Type 2025 & 2033
- Figure 6: North America Salmon Industry Revenue (Million), by Species Type 2025 & 2033
- Figure 7: North America Salmon Industry Revenue Share (%), by Species Type 2025 & 2033
- Figure 8: North America Salmon Industry Revenue (Million), by Type 2025 & 2033
- Figure 9: North America Salmon Industry Revenue Share (%), by Type 2025 & 2033
- Figure 10: North America Salmon Industry Revenue (Million), by Country 2025 & 2033
- Figure 11: North America Salmon Industry Revenue Share (%), by Country 2025 & 2033
- Figure 12: Europe Salmon Industry Revenue (Million), by Species Type 2025 & 2033
- Figure 13: Europe Salmon Industry Revenue Share (%), by Species Type 2025 & 2033
- Figure 14: Europe Salmon Industry Revenue (Million), by Type 2025 & 2033
- Figure 15: Europe Salmon Industry Revenue Share (%), by Type 2025 & 2033
- Figure 16: Europe Salmon Industry Revenue (Million), by Species Type 2025 & 2033
- Figure 17: Europe Salmon Industry Revenue Share (%), by Species Type 2025 & 2033
- Figure 18: Europe Salmon Industry Revenue (Million), by Type 2025 & 2033
- Figure 19: Europe Salmon Industry Revenue Share (%), by Type 2025 & 2033
- Figure 20: Europe Salmon Industry Revenue (Million), by Country 2025 & 2033
- Figure 21: Europe Salmon Industry Revenue Share (%), by Country 2025 & 2033
- Figure 22: Asia Pacific Salmon Industry Revenue (Million), by Species Type 2025 & 2033
- Figure 23: Asia Pacific Salmon Industry Revenue Share (%), by Species Type 2025 & 2033
- Figure 24: Asia Pacific Salmon Industry Revenue (Million), by Type 2025 & 2033
- Figure 25: Asia Pacific Salmon Industry Revenue Share (%), by Type 2025 & 2033
- Figure 26: Asia Pacific Salmon Industry Revenue (Million), by Species Type 2025 & 2033
- Figure 27: Asia Pacific Salmon Industry Revenue Share (%), by Species Type 2025 & 2033
- Figure 28: Asia Pacific Salmon Industry Revenue (Million), by Type 2025 & 2033
- Figure 29: Asia Pacific Salmon Industry Revenue Share (%), by Type 2025 & 2033
- Figure 30: Asia Pacific Salmon Industry Revenue (Million), by Country 2025 & 2033
- Figure 31: Asia Pacific Salmon Industry Revenue Share (%), by Country 2025 & 2033
- Figure 32: South America Salmon Industry Revenue (Million), by Species Type 2025 & 2033
- Figure 33: South America Salmon Industry Revenue Share (%), by Species Type 2025 & 2033
- Figure 34: South America Salmon Industry Revenue (Million), by Type 2025 & 2033
- Figure 35: South America Salmon Industry Revenue Share (%), by Type 2025 & 2033
- Figure 36: South America Salmon Industry Revenue (Million), by Species Type 2025 & 2033
- Figure 37: South America Salmon Industry Revenue Share (%), by Species Type 2025 & 2033
- Figure 38: South America Salmon Industry Revenue (Million), by Type 2025 & 2033
- Figure 39: South America Salmon Industry Revenue Share (%), by Type 2025 & 2033
- Figure 40: South America Salmon Industry Revenue (Million), by Country 2025 & 2033
- Figure 41: South America Salmon Industry Revenue Share (%), by Country 2025 & 2033
List of Tables
- Table 1: Global Salmon Industry Revenue Million Forecast, by Species Type 2020 & 2033
- Table 2: Global Salmon Industry Revenue Million Forecast, by Type 2020 & 2033
- Table 3: Global Salmon Industry Revenue Million Forecast, by Species Type 2020 & 2033
- Table 4: Global Salmon Industry Revenue Million Forecast, by Type 2020 & 2033
- Table 5: Global Salmon Industry Revenue Million Forecast, by Region 2020 & 2033
- Table 6: Global Salmon Industry Revenue Million Forecast, by Species Type 2020 & 2033
- Table 7: Global Salmon Industry Revenue Million Forecast, by Type 2020 & 2033
- Table 8: Global Salmon Industry Revenue Million Forecast, by Species Type 2020 & 2033
- Table 9: Global Salmon Industry Revenue Million Forecast, by Type 2020 & 2033
- Table 10: Global Salmon Industry Revenue Million Forecast, by Country 2020 & 2033
- Table 11: United States Salmon Industry Revenue (Million) Forecast, by Application 2020 & 2033
- Table 12: Canada Salmon Industry Revenue (Million) Forecast, by Application 2020 & 2033
- Table 13: Global Salmon Industry Revenue Million Forecast, by Species Type 2020 & 2033
- Table 14: Global Salmon Industry Revenue Million Forecast, by Type 2020 & 2033
- Table 15: Global Salmon Industry Revenue Million Forecast, by Species Type 2020 & 2033
- Table 16: Global Salmon Industry Revenue Million Forecast, by Type 2020 & 2033
- Table 17: Global Salmon Industry Revenue Million Forecast, by Country 2020 & 2033
- Table 18: Norway Salmon Industry Revenue (Million) Forecast, by Application 2020 & 2033
- Table 19: Spain Salmon Industry Revenue (Million) Forecast, by Application 2020 & 2033
- Table 20: Netherlands Salmon Industry Revenue (Million) Forecast, by Application 2020 & 2033
- Table 21: France Salmon Industry Revenue (Million) Forecast, by Application 2020 & 2033
- Table 22: Italy Salmon Industry Revenue (Million) Forecast, by Application 2020 & 2033
- Table 23: Greece Salmon Industry Revenue (Million) Forecast, by Application 2020 & 2033
- Table 24: United Kingdom Salmon Industry Revenue (Million) Forecast, by Application 2020 & 2033
- Table 25: Scotland Salmon Industry Revenue (Million) Forecast, by Application 2020 & 2033
- Table 26: Global Salmon Industry Revenue Million Forecast, by Species Type 2020 & 2033
- Table 27: Global Salmon Industry Revenue Million Forecast, by Type 2020 & 2033
- Table 28: Global Salmon Industry Revenue Million Forecast, by Species Type 2020 & 2033
- Table 29: Global Salmon Industry Revenue Million Forecast, by Type 2020 & 2033
- Table 30: Global Salmon Industry Revenue Million Forecast, by Country 2020 & 2033
- Table 31: China Salmon Industry Revenue (Million) Forecast, by Application 2020 & 2033
- Table 32: Japan Salmon Industry Revenue (Million) Forecast, by Application 2020 & 2033
- Table 33: Australia Salmon Industry Revenue (Million) Forecast, by Application 2020 & 2033
- Table 34: Global Salmon Industry Revenue Million Forecast, by Species Type 2020 & 2033
- Table 35: Global Salmon Industry Revenue Million Forecast, by Type 2020 & 2033
- Table 36: Global Salmon Industry Revenue Million Forecast, by Species Type 2020 & 2033
- Table 37: Global Salmon Industry Revenue Million Forecast, by Type 2020 & 2033
- Table 38: Global Salmon Industry Revenue Million Forecast, by Country 2020 & 2033
- Table 39: Chile Salmon Industry Revenue (Million) Forecast, by Application 2020 & 2033
Frequently Asked Questions
1. What is the projected Compound Annual Growth Rate (CAGR) of the Salmon Industry?
The projected CAGR is approximately 8.07%.
2. Which companies are prominent players in the Salmon Industry?
Key companies in the market include Leroy Seafood Group , Cooke Aquaculture , Cermaq, Mowi , Grieg Seafood .
3. What are the main segments of the Salmon Industry?
The market segments include Species Type, Type, Species Type, Type.
4. Can you provide details about the market size?
The market size is estimated to be USD 33.50 Million as of 2022.
5. What are some drivers contributing to market growth?
; Awareness About Health Benefits Associated With Pecan Consumption; Wide Application of Pecan.
6. What are the notable trends driving market growth?
Healthy Boost in the Salmon Production.
7. Are there any restraints impacting market growth?
; Volatility in the Prices; Adverse Weather Conditions Affecting Yield.
8. Can you provide examples of recent developments in the market?
N/A
9. What pricing options are available for accessing the report?
Pricing options include single-user, multi-user, and enterprise licenses priced at USD 4750, USD 5250, and USD 8750 respectively.
10. Is the market size provided in terms of value or volume?
The market size is provided in terms of value, measured in Million.
11. Are there any specific market keywords associated with the report?
Yes, the market keyword associated with the report is "Salmon Industry," which aids in identifying and referencing the specific market segment covered.
12. How do I determine which pricing option suits my needs best?
The pricing options vary based on user requirements and access needs. Individual users may opt for single-user licenses, while businesses requiring broader access may choose multi-user or enterprise licenses for cost-effective access to the report.
13. Are there any additional resources or data provided in the Salmon Industry report?
While the report offers comprehensive insights, it's advisable to review the specific contents or supplementary materials provided to ascertain if additional resources or data are available.
14. How can I stay updated on further developments or reports in the Salmon Industry?
To stay informed about further developments, trends, and reports in the Salmon Industry, consider subscribing to industry newsletters, following relevant companies and organizations, or regularly checking reputable industry news sources and publications.
Methodology
Step 1 - Identification of Relevant Samples Size from Population Database


Step 2 - Approaches for Defining Global Market Size (Value, Volume* & Price*)

Note*: In applicable scenarios
Step 3 - Data Sources
Primary Research
- Web Analytics
- Survey Reports
- Research Institute
- Latest Research Reports
- Opinion Leaders
Secondary Research
- Annual Reports
- White Paper
- Latest Press Release
- Industry Association
- Paid Database
- Investor Presentations

Step 4 - Data Triangulation
Involves using different sources of information in order to increase the validity of a study
These sources are likely to be stakeholders in a program - participants, other researchers, program staff, other community members, and so on.
Then we put all data in single framework & apply various statistical tools to find out the dynamic on the market.
During the analysis stage, feedback from the stakeholder groups would be compared to determine areas of agreement as well as areas of divergence