

Key Insights
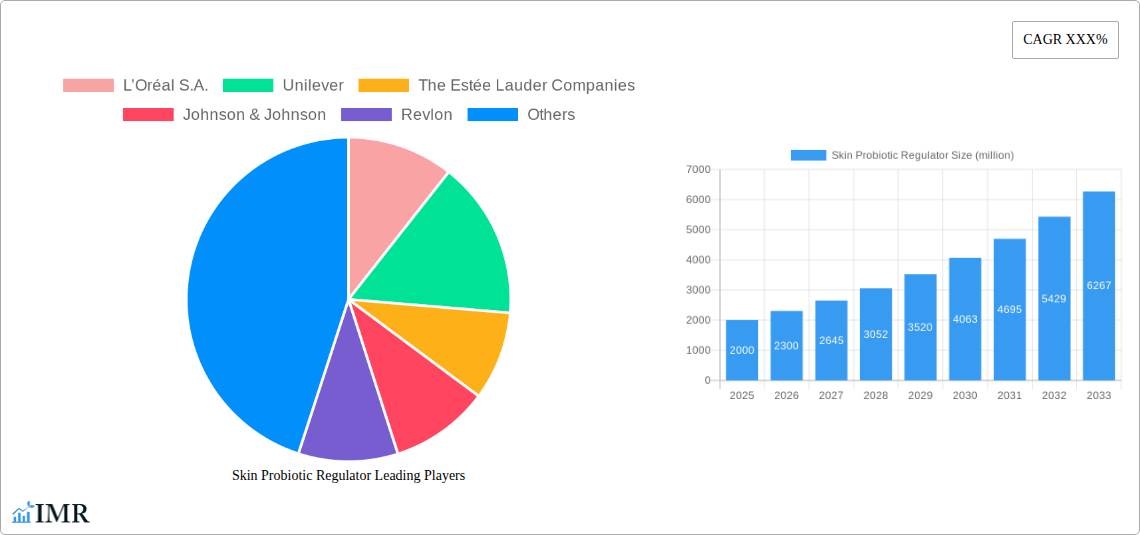
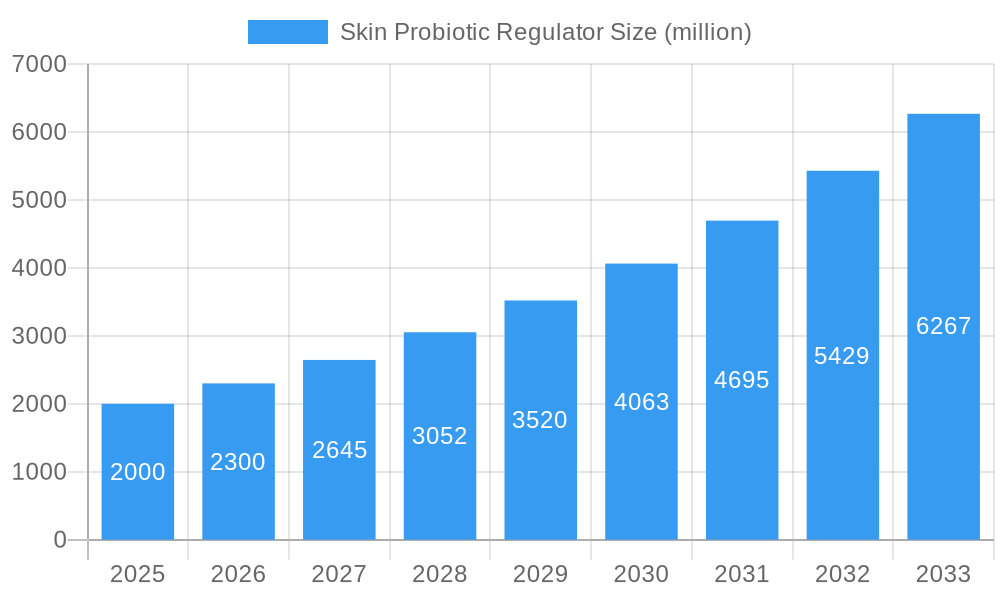
The global skin probiotic regulator market is experiencing robust growth, driven by increasing consumer awareness of the microbiome's role in skin health and a rising demand for natural and effective skincare solutions. The market, estimated at $2 billion in 2025, is projected to exhibit a Compound Annual Growth Rate (CAGR) of 15% from 2025 to 2033, reaching an estimated $7 billion by 2033. This expansion is fueled by several key factors. Firstly, the growing prevalence of skin conditions like acne, eczema, and rosacea is driving demand for alternative therapies beyond traditional treatments. Secondly, the increasing popularity of personalized skincare and the growing understanding of the skin microbiome's crucial role in maintaining skin health are bolstering market growth. Furthermore, the incorporation of probiotics into skincare formulations offers a natural and gentle approach, appealing to consumers seeking non-invasive solutions. Technological advancements in probiotic research and development are also contributing to the market's expansion, leading to the creation of more efficacious and targeted products. The market is segmented by product type (creams, serums, cleansers, etc.), application (face, body), and distribution channel (online, offline).
Skin Probiotic Regulator Market Size (In Billion)
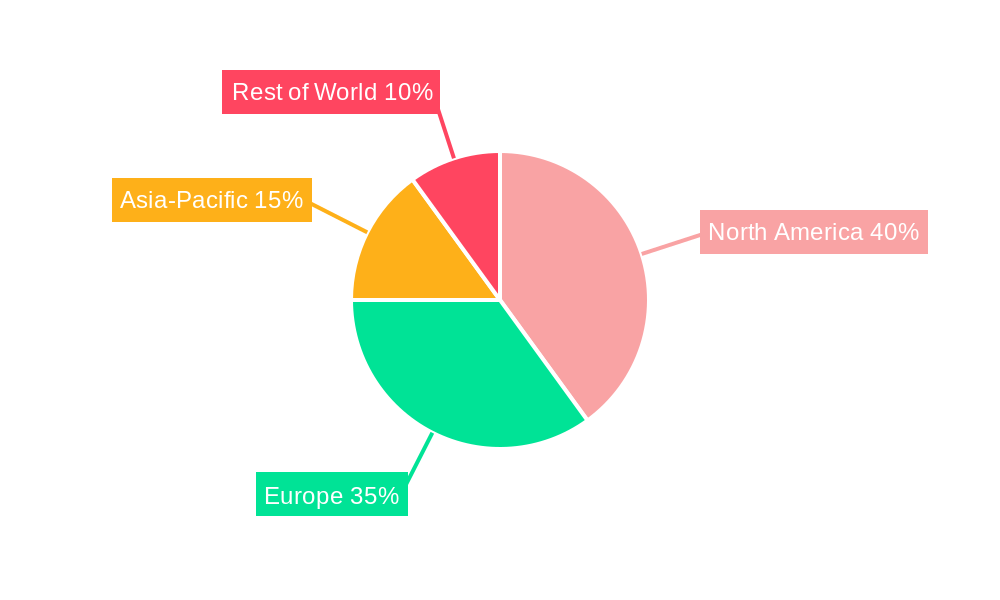
Major players like L’Oréal, Unilever, Estée Lauder, and Johnson & Johnson are actively involved in research and development, expanding their product portfolios in this area. Smaller, specialized companies like Evelo Biosciences, AOBiome, Azitra, GALLINÉE, and Glowbiotics are also contributing significantly, driving innovation and competition. While the market faces challenges such as stringent regulatory requirements and potential inconsistencies in product efficacy due to the complexity of probiotic formulations, the overall growth outlook remains positive. Consumer education and the continued focus on research and development will further propel the market forward in the coming years. The North American and European markets currently dominate, but growth potential is significant in Asia-Pacific and other emerging regions as consumer awareness and purchasing power increase.
Skin Probiotic Regulator Company Market Share
Skin Probiotic Regulator Market Report: 2019-2033
This comprehensive report provides a detailed analysis of the global Skin Probiotic Regulator market, projecting robust growth from 2025 to 2033. The report examines market dynamics, key players, emerging trends, and future growth opportunities within the parent market of skincare and the child market of microbiome-focused cosmetics. The study period covers 2019-2033, with 2025 serving as the base and estimated year.
Skin Probiotic Regulator Market Dynamics & Structure
The Skin Probiotic Regulator market, valued at $XX million in 2025, is characterized by moderate concentration, with key players like L’Oréal S.A., Unilever, and The Estée Lauder Companies holding significant market share. Technological innovation, driven by advancements in microbiome research and formulation technologies, is a major growth driver. Stringent regulatory frameworks regarding cosmetic ingredient safety influence product development and market entry. Competitive pressures from established skincare brands and emerging players are intensifying. The market is witnessing increasing demand from consumers seeking natural and effective skincare solutions. Mergers and acquisitions (M&A) activity is expected to increase as larger players seek to expand their product portfolios and market reach.
- Market Concentration: Moderately concentrated, with top 5 players holding approximately XX% market share in 2025.
- Technological Innovation: Focus on strain selection, encapsulation technologies, and efficacy testing.
- Regulatory Framework: Compliance with cosmetic safety regulations varies across regions, impacting product development and market entry strategies.
- Competitive Substitutes: Traditional skincare products containing chemical actives, alongside emerging alternative therapies.
- End-User Demographics: Primarily focused on consumers aged 25-55, with growing interest among younger demographics.
- M&A Trends: Increasing M&A activity, particularly among larger players seeking to acquire smaller innovative companies. XX M&A deals projected between 2025 and 2033.
Skin Probiotic Regulator Growth Trends & Insights
The Skin Probiotic Regulator market demonstrates substantial growth potential, projected to reach $XX million by 2033, exhibiting a CAGR of XX% during the forecast period (2025-2033). This growth is driven by increasing consumer awareness of the skin microbiome's role in skin health, a rise in demand for natural and effective skincare solutions, and technological advancements in probiotic formulation and delivery systems. The market penetration of skin probiotic products is expected to increase significantly, particularly in developed markets. The adoption rate is accelerating due to positive consumer feedback and increased marketing efforts by leading cosmetic companies. Consumer behavior shifts are favoring products with proven efficacy, transparency in ingredient sourcing, and sustainability claims.
Dominant Regions, Countries, or Segments in Skin Probiotic Regulator
North America currently dominates the Skin Probiotic Regulator market, owing to high consumer awareness of skincare benefits, robust R&D investments, and strong regulatory support. Europe follows closely, driven by a growing demand for natural cosmetics. Asia-Pacific is poised for significant growth, propelled by rising disposable incomes and increased consumer interest in skincare products.
- North America: High consumer awareness, strong regulatory environment, and substantial R&D investment drive market leadership.
- Europe: Growing preference for natural and organic cosmetics fuels market expansion.
- Asia-Pacific: Rising disposable incomes, increased interest in skincare, and a large consumer base promise significant growth potential.
- Key Drivers: Increased consumer awareness, regulatory support for natural products, and rising disposable incomes in key regions.
Skin Probiotic Regulator Product Landscape
The Skin Probiotic Regulator market offers a diverse range of products, including creams, serums, lotions, and cleansers, formulated with various probiotic strains and delivery systems. These products emphasize skin barrier restoration, inflammation reduction, and improved skin hydration. Innovation focuses on developing stable and effective probiotic formulations and incorporating advanced delivery systems like liposomes and microencapsulation to enhance efficacy and shelf life. Unique selling propositions often include clinically proven efficacy, sustainable sourcing of ingredients, and cruelty-free practices. Technological advancements are focused on identifying novel probiotic strains with targeted benefits and improving the stability of probiotic formulations.
Key Drivers, Barriers & Challenges in Skin Probiotic Regulator
Key Drivers:
- Increasing consumer awareness of the skin microbiome's importance.
- Growing demand for natural and sustainable skincare products.
- Technological advancements in probiotic formulation and delivery systems.
Challenges & Restraints:
- High R&D costs and challenges in ensuring probiotic viability and stability.
- Regulatory hurdles and varying standards across different regions.
- Maintaining the live cultures throughout the product's shelf life.
- Competition from established skincare brands with well-established product lines.
Emerging Opportunities in Skin Probiotic Regulator
- Expansion into untapped markets in developing countries.
- Development of targeted products addressing specific skin conditions (e.g., acne, eczema).
- Growing integration of probiotics into other beauty products (e.g., hair care).
- Personalized skin probiotic solutions based on individual microbiome profiles.
Growth Accelerators in the Skin Probiotic Regulator Industry
Strategic partnerships between cosmetic companies and biotechnology firms will accelerate innovation and market penetration. Technological breakthroughs, such as novel probiotic strain discovery and advanced encapsulation methods, will enhance product efficacy and market appeal. Expansion into new geographical markets and product categories will significantly contribute to market growth. This includes broadening into areas like men’s skincare and specialized age groups.
Key Players Shaping the Skin Probiotic Regulator Market
- L’Oréal S.A.
- Unilever
- The Estée Lauder Companies
- Johnson & Johnson
- Revlon
- Evelo Biosciences
- AOBiome
- Azitra
- GALLINÉE
- Glowbiotics
Notable Milestones in Skin Probiotic Regulator Sector
- 2020: Launch of the first clinically-tested probiotic skincare product by [Company Name].
- 2022: Acquisition of a leading probiotic strain developer by a major cosmetic company.
- 2023: Publication of significant research supporting the efficacy of skin probiotics in treating specific skin conditions.
- 2024: Introduction of personalized microbiome testing services for customized skin probiotic treatments.
In-Depth Skin Probiotic Regulator Market Outlook
The Skin Probiotic Regulator market holds significant future potential, driven by continued innovation, growing consumer awareness, and expansion into new markets. Strategic partnerships, R&D investments, and the development of personalized skin solutions will be crucial for sustained market growth. The increasing integration of microbiome science into cosmetic formulations promises to create exciting new opportunities in the coming decade, driving significant market expansion and leading to the development of novel products with demonstrable efficacy.
Skin Probiotic Regulator Segmentation
-
1. Application
- 1.1. Skin Care
- 1.2. Hair Care
- 1.3. Others
-
2. Type
- 2.1. Probiotics
- 2.2. Prebiotics
- 2.3. Drugs
Skin Probiotic Regulator Segmentation By Geography
-
1. North America
- 1.1. United States
- 1.2. Canada
- 1.3. Mexico
-
2. South America
- 2.1. Brazil
- 2.2. Argentina
- 2.3. Rest of South America
-
3. Europe
- 3.1. United Kingdom
- 3.2. Germany
- 3.3. France
- 3.4. Italy
- 3.5. Spain
- 3.6. Russia
- 3.7. Benelux
- 3.8. Nordics
- 3.9. Rest of Europe
-
4. Middle East & Africa
- 4.1. Turkey
- 4.2. Israel
- 4.3. GCC
- 4.4. North Africa
- 4.5. South Africa
- 4.6. Rest of Middle East & Africa
-
5. Asia Pacific
- 5.1. China
- 5.2. India
- 5.3. Japan
- 5.4. South Korea
- 5.5. ASEAN
- 5.6. Oceania
- 5.7. Rest of Asia Pacific
Skin Probiotic Regulator Regional Market Share
Geographic Coverage of Skin Probiotic Regulator
Skin Probiotic Regulator REPORT HIGHLIGHTS
| Aspects | Details |
|---|---|
| Study Period | 2020-2034 |
| Base Year | 2025 |
| Estimated Year | 2026 |
| Forecast Period | 2026-2034 |
| Historical Period | 2020-2025 |
| Growth Rate | CAGR of 11.9% from 2020-2034 |
| Segmentation |
|
Table of Contents
- 1. Introduction
- 1.1. Research Scope
- 1.2. Market Segmentation
- 1.3. Research Objective
- 1.4. Definitions and Assumptions
- 2. Executive Summary
- 2.1. Market Snapshot
- 3. Market Dynamics
- 3.1. Market Drivers
- 3.2. Market Restrains
- 3.3. Market Trends
- 3.4. Market Opportunities
- 4. Market Factor Analysis
- 4.1. Porters Five Forces
- 4.1.1. Bargaining Power of Suppliers
- 4.1.2. Bargaining Power of Buyers
- 4.1.3. Threat of New Entrants
- 4.1.4. Threat of Substitutes
- 4.1.5. Competitive Rivalry
- 4.2. PESTEL analysis
- 4.3. BCG Analysis
- 4.3.1. Stars (High Growth, High Market Share)
- 4.3.2. Cash Cows (Low Growth, High Market Share)
- 4.3.3. Question Mark (High Growth, Low Market Share)
- 4.3.4. Dogs (Low Growth, Low Market Share)
- 4.4. Ansoff Matrix Analysis
- 4.5. Supply Chain Analysis
- 4.6. Regulatory Landscape
- 4.7. Current Market Potential and Opportunity Assessment (TAM–SAM–SOM Framework)
- 4.8. IMR Analyst Note
- 4.1. Porters Five Forces
- 5. Market Analysis, Insights and Forecast 2021-2033
- 5.1. Market Analysis, Insights and Forecast - by Application
- 5.1.1. Skin Care
- 5.1.2. Hair Care
- 5.1.3. Others
- 5.2. Market Analysis, Insights and Forecast - by Type
- 5.2.1. Probiotics
- 5.2.2. Prebiotics
- 5.2.3. Drugs
- 5.3. Market Analysis, Insights and Forecast - by Region
- 5.3.1. North America
- 5.3.2. South America
- 5.3.3. Europe
- 5.3.4. Middle East & Africa
- 5.3.5. Asia Pacific
- 5.1. Market Analysis, Insights and Forecast - by Application
- 6. Global Skin Probiotic Regulator Analysis, Insights and Forecast, 2021-2033
- 6.1. Market Analysis, Insights and Forecast - by Application
- 6.1.1. Skin Care
- 6.1.2. Hair Care
- 6.1.3. Others
- 6.2. Market Analysis, Insights and Forecast - by Type
- 6.2.1. Probiotics
- 6.2.2. Prebiotics
- 6.2.3. Drugs
- 6.1. Market Analysis, Insights and Forecast - by Application
- 7. North America Skin Probiotic Regulator Analysis, Insights and Forecast, 2020-2032
- 7.1. Market Analysis, Insights and Forecast - by Application
- 7.1.1. Skin Care
- 7.1.2. Hair Care
- 7.1.3. Others
- 7.2. Market Analysis, Insights and Forecast - by Type
- 7.2.1. Probiotics
- 7.2.2. Prebiotics
- 7.2.3. Drugs
- 7.1. Market Analysis, Insights and Forecast - by Application
- 8. South America Skin Probiotic Regulator Analysis, Insights and Forecast, 2020-2032
- 8.1. Market Analysis, Insights and Forecast - by Application
- 8.1.1. Skin Care
- 8.1.2. Hair Care
- 8.1.3. Others
- 8.2. Market Analysis, Insights and Forecast - by Type
- 8.2.1. Probiotics
- 8.2.2. Prebiotics
- 8.2.3. Drugs
- 8.1. Market Analysis, Insights and Forecast - by Application
- 9. Europe Skin Probiotic Regulator Analysis, Insights and Forecast, 2020-2032
- 9.1. Market Analysis, Insights and Forecast - by Application
- 9.1.1. Skin Care
- 9.1.2. Hair Care
- 9.1.3. Others
- 9.2. Market Analysis, Insights and Forecast - by Type
- 9.2.1. Probiotics
- 9.2.2. Prebiotics
- 9.2.3. Drugs
- 9.1. Market Analysis, Insights and Forecast - by Application
- 10. Middle East & Africa Skin Probiotic Regulator Analysis, Insights and Forecast, 2020-2032
- 10.1. Market Analysis, Insights and Forecast - by Application
- 10.1.1. Skin Care
- 10.1.2. Hair Care
- 10.1.3. Others
- 10.2. Market Analysis, Insights and Forecast - by Type
- 10.2.1. Probiotics
- 10.2.2. Prebiotics
- 10.2.3. Drugs
- 10.1. Market Analysis, Insights and Forecast - by Application
- 11. Asia Pacific Skin Probiotic Regulator Analysis, Insights and Forecast, 2020-2032
- 11.1. Market Analysis, Insights and Forecast - by Application
- 11.1.1. Skin Care
- 11.1.2. Hair Care
- 11.1.3. Others
- 11.2. Market Analysis, Insights and Forecast - by Type
- 11.2.1. Probiotics
- 11.2.2. Prebiotics
- 11.2.3. Drugs
- 11.1. Market Analysis, Insights and Forecast - by Application
- 12. Competitive Analysis
- 12.1. Company Profiles
- 12.1.1 L’Oréal S.A.
- 12.1.1.1. Company Overview
- 12.1.1.2. Products
- 12.1.1.3. Company Financials
- 12.1.1.4. SWOT Analysis
- 12.1.2 Unilever
- 12.1.2.1. Company Overview
- 12.1.2.2. Products
- 12.1.2.3. Company Financials
- 12.1.2.4. SWOT Analysis
- 12.1.3 The Estée Lauder Companies
- 12.1.3.1. Company Overview
- 12.1.3.2. Products
- 12.1.3.3. Company Financials
- 12.1.3.4. SWOT Analysis
- 12.1.4 Johnson & Johnson
- 12.1.4.1. Company Overview
- 12.1.4.2. Products
- 12.1.4.3. Company Financials
- 12.1.4.4. SWOT Analysis
- 12.1.5 Revlon
- 12.1.5.1. Company Overview
- 12.1.5.2. Products
- 12.1.5.3. Company Financials
- 12.1.5.4. SWOT Analysis
- 12.1.6 Evelo Biosciences
- 12.1.6.1. Company Overview
- 12.1.6.2. Products
- 12.1.6.3. Company Financials
- 12.1.6.4. SWOT Analysis
- 12.1.7 AOBiome
- 12.1.7.1. Company Overview
- 12.1.7.2. Products
- 12.1.7.3. Company Financials
- 12.1.7.4. SWOT Analysis
- 12.1.8 Azitra
- 12.1.8.1. Company Overview
- 12.1.8.2. Products
- 12.1.8.3. Company Financials
- 12.1.8.4. SWOT Analysis
- 12.1.9 GALLINÉE
- 12.1.9.1. Company Overview
- 12.1.9.2. Products
- 12.1.9.3. Company Financials
- 12.1.9.4. SWOT Analysis
- 12.1.10 Glowbiotics
- 12.1.10.1. Company Overview
- 12.1.10.2. Products
- 12.1.10.3. Company Financials
- 12.1.10.4. SWOT Analysis
- 12.1.1 L’Oréal S.A.
- 12.2. Market Entropy
- 12.2.1 Company's Key Areas Served
- 12.2.2 Recent Developments
- 12.3. Company Market Share Analysis 2025
- 12.3.1 Top 5 Companies Market Share Analysis
- 12.3.2 Top 3 Companies Market Share Analysis
- 12.4. List of Potential Customers
- 13. Research Methodology
List of Figures
- Figure 1: Global Skin Probiotic Regulator Revenue Breakdown (undefined, %) by Region 2025 & 2033
- Figure 2: Global Skin Probiotic Regulator Volume Breakdown (K, %) by Region 2025 & 2033
- Figure 3: North America Skin Probiotic Regulator Revenue (undefined), by Application 2025 & 2033
- Figure 4: North America Skin Probiotic Regulator Volume (K), by Application 2025 & 2033
- Figure 5: North America Skin Probiotic Regulator Revenue Share (%), by Application 2025 & 2033
- Figure 6: North America Skin Probiotic Regulator Volume Share (%), by Application 2025 & 2033
- Figure 7: North America Skin Probiotic Regulator Revenue (undefined), by Type 2025 & 2033
- Figure 8: North America Skin Probiotic Regulator Volume (K), by Type 2025 & 2033
- Figure 9: North America Skin Probiotic Regulator Revenue Share (%), by Type 2025 & 2033
- Figure 10: North America Skin Probiotic Regulator Volume Share (%), by Type 2025 & 2033
- Figure 11: North America Skin Probiotic Regulator Revenue (undefined), by Country 2025 & 2033
- Figure 12: North America Skin Probiotic Regulator Volume (K), by Country 2025 & 2033
- Figure 13: North America Skin Probiotic Regulator Revenue Share (%), by Country 2025 & 2033
- Figure 14: North America Skin Probiotic Regulator Volume Share (%), by Country 2025 & 2033
- Figure 15: South America Skin Probiotic Regulator Revenue (undefined), by Application 2025 & 2033
- Figure 16: South America Skin Probiotic Regulator Volume (K), by Application 2025 & 2033
- Figure 17: South America Skin Probiotic Regulator Revenue Share (%), by Application 2025 & 2033
- Figure 18: South America Skin Probiotic Regulator Volume Share (%), by Application 2025 & 2033
- Figure 19: South America Skin Probiotic Regulator Revenue (undefined), by Type 2025 & 2033
- Figure 20: South America Skin Probiotic Regulator Volume (K), by Type 2025 & 2033
- Figure 21: South America Skin Probiotic Regulator Revenue Share (%), by Type 2025 & 2033
- Figure 22: South America Skin Probiotic Regulator Volume Share (%), by Type 2025 & 2033
- Figure 23: South America Skin Probiotic Regulator Revenue (undefined), by Country 2025 & 2033
- Figure 24: South America Skin Probiotic Regulator Volume (K), by Country 2025 & 2033
- Figure 25: South America Skin Probiotic Regulator Revenue Share (%), by Country 2025 & 2033
- Figure 26: South America Skin Probiotic Regulator Volume Share (%), by Country 2025 & 2033
- Figure 27: Europe Skin Probiotic Regulator Revenue (undefined), by Application 2025 & 2033
- Figure 28: Europe Skin Probiotic Regulator Volume (K), by Application 2025 & 2033
- Figure 29: Europe Skin Probiotic Regulator Revenue Share (%), by Application 2025 & 2033
- Figure 30: Europe Skin Probiotic Regulator Volume Share (%), by Application 2025 & 2033
- Figure 31: Europe Skin Probiotic Regulator Revenue (undefined), by Type 2025 & 2033
- Figure 32: Europe Skin Probiotic Regulator Volume (K), by Type 2025 & 2033
- Figure 33: Europe Skin Probiotic Regulator Revenue Share (%), by Type 2025 & 2033
- Figure 34: Europe Skin Probiotic Regulator Volume Share (%), by Type 2025 & 2033
- Figure 35: Europe Skin Probiotic Regulator Revenue (undefined), by Country 2025 & 2033
- Figure 36: Europe Skin Probiotic Regulator Volume (K), by Country 2025 & 2033
- Figure 37: Europe Skin Probiotic Regulator Revenue Share (%), by Country 2025 & 2033
- Figure 38: Europe Skin Probiotic Regulator Volume Share (%), by Country 2025 & 2033
- Figure 39: Middle East & Africa Skin Probiotic Regulator Revenue (undefined), by Application 2025 & 2033
- Figure 40: Middle East & Africa Skin Probiotic Regulator Volume (K), by Application 2025 & 2033
- Figure 41: Middle East & Africa Skin Probiotic Regulator Revenue Share (%), by Application 2025 & 2033
- Figure 42: Middle East & Africa Skin Probiotic Regulator Volume Share (%), by Application 2025 & 2033
- Figure 43: Middle East & Africa Skin Probiotic Regulator Revenue (undefined), by Type 2025 & 2033
- Figure 44: Middle East & Africa Skin Probiotic Regulator Volume (K), by Type 2025 & 2033
- Figure 45: Middle East & Africa Skin Probiotic Regulator Revenue Share (%), by Type 2025 & 2033
- Figure 46: Middle East & Africa Skin Probiotic Regulator Volume Share (%), by Type 2025 & 2033
- Figure 47: Middle East & Africa Skin Probiotic Regulator Revenue (undefined), by Country 2025 & 2033
- Figure 48: Middle East & Africa Skin Probiotic Regulator Volume (K), by Country 2025 & 2033
- Figure 49: Middle East & Africa Skin Probiotic Regulator Revenue Share (%), by Country 2025 & 2033
- Figure 50: Middle East & Africa Skin Probiotic Regulator Volume Share (%), by Country 2025 & 2033
- Figure 51: Asia Pacific Skin Probiotic Regulator Revenue (undefined), by Application 2025 & 2033
- Figure 52: Asia Pacific Skin Probiotic Regulator Volume (K), by Application 2025 & 2033
- Figure 53: Asia Pacific Skin Probiotic Regulator Revenue Share (%), by Application 2025 & 2033
- Figure 54: Asia Pacific Skin Probiotic Regulator Volume Share (%), by Application 2025 & 2033
- Figure 55: Asia Pacific Skin Probiotic Regulator Revenue (undefined), by Type 2025 & 2033
- Figure 56: Asia Pacific Skin Probiotic Regulator Volume (K), by Type 2025 & 2033
- Figure 57: Asia Pacific Skin Probiotic Regulator Revenue Share (%), by Type 2025 & 2033
- Figure 58: Asia Pacific Skin Probiotic Regulator Volume Share (%), by Type 2025 & 2033
- Figure 59: Asia Pacific Skin Probiotic Regulator Revenue (undefined), by Country 2025 & 2033
- Figure 60: Asia Pacific Skin Probiotic Regulator Volume (K), by Country 2025 & 2033
- Figure 61: Asia Pacific Skin Probiotic Regulator Revenue Share (%), by Country 2025 & 2033
- Figure 62: Asia Pacific Skin Probiotic Regulator Volume Share (%), by Country 2025 & 2033
List of Tables
- Table 1: Global Skin Probiotic Regulator Revenue undefined Forecast, by Application 2020 & 2033
- Table 2: Global Skin Probiotic Regulator Volume K Forecast, by Application 2020 & 2033
- Table 3: Global Skin Probiotic Regulator Revenue undefined Forecast, by Type 2020 & 2033
- Table 4: Global Skin Probiotic Regulator Volume K Forecast, by Type 2020 & 2033
- Table 5: Global Skin Probiotic Regulator Revenue undefined Forecast, by Region 2020 & 2033
- Table 6: Global Skin Probiotic Regulator Volume K Forecast, by Region 2020 & 2033
- Table 7: Global Skin Probiotic Regulator Revenue undefined Forecast, by Application 2020 & 2033
- Table 8: Global Skin Probiotic Regulator Volume K Forecast, by Application 2020 & 2033
- Table 9: Global Skin Probiotic Regulator Revenue undefined Forecast, by Type 2020 & 2033
- Table 10: Global Skin Probiotic Regulator Volume K Forecast, by Type 2020 & 2033
- Table 11: Global Skin Probiotic Regulator Revenue undefined Forecast, by Country 2020 & 2033
- Table 12: Global Skin Probiotic Regulator Volume K Forecast, by Country 2020 & 2033
- Table 13: United States Skin Probiotic Regulator Revenue (undefined) Forecast, by Application 2020 & 2033
- Table 14: United States Skin Probiotic Regulator Volume (K) Forecast, by Application 2020 & 2033
- Table 15: Canada Skin Probiotic Regulator Revenue (undefined) Forecast, by Application 2020 & 2033
- Table 16: Canada Skin Probiotic Regulator Volume (K) Forecast, by Application 2020 & 2033
- Table 17: Mexico Skin Probiotic Regulator Revenue (undefined) Forecast, by Application 2020 & 2033
- Table 18: Mexico Skin Probiotic Regulator Volume (K) Forecast, by Application 2020 & 2033
- Table 19: Global Skin Probiotic Regulator Revenue undefined Forecast, by Application 2020 & 2033
- Table 20: Global Skin Probiotic Regulator Volume K Forecast, by Application 2020 & 2033
- Table 21: Global Skin Probiotic Regulator Revenue undefined Forecast, by Type 2020 & 2033
- Table 22: Global Skin Probiotic Regulator Volume K Forecast, by Type 2020 & 2033
- Table 23: Global Skin Probiotic Regulator Revenue undefined Forecast, by Country 2020 & 2033
- Table 24: Global Skin Probiotic Regulator Volume K Forecast, by Country 2020 & 2033
- Table 25: Brazil Skin Probiotic Regulator Revenue (undefined) Forecast, by Application 2020 & 2033
- Table 26: Brazil Skin Probiotic Regulator Volume (K) Forecast, by Application 2020 & 2033
- Table 27: Argentina Skin Probiotic Regulator Revenue (undefined) Forecast, by Application 2020 & 2033
- Table 28: Argentina Skin Probiotic Regulator Volume (K) Forecast, by Application 2020 & 2033
- Table 29: Rest of South America Skin Probiotic Regulator Revenue (undefined) Forecast, by Application 2020 & 2033
- Table 30: Rest of South America Skin Probiotic Regulator Volume (K) Forecast, by Application 2020 & 2033
- Table 31: Global Skin Probiotic Regulator Revenue undefined Forecast, by Application 2020 & 2033
- Table 32: Global Skin Probiotic Regulator Volume K Forecast, by Application 2020 & 2033
- Table 33: Global Skin Probiotic Regulator Revenue undefined Forecast, by Type 2020 & 2033
- Table 34: Global Skin Probiotic Regulator Volume K Forecast, by Type 2020 & 2033
- Table 35: Global Skin Probiotic Regulator Revenue undefined Forecast, by Country 2020 & 2033
- Table 36: Global Skin Probiotic Regulator Volume K Forecast, by Country 2020 & 2033
- Table 37: United Kingdom Skin Probiotic Regulator Revenue (undefined) Forecast, by Application 2020 & 2033
- Table 38: United Kingdom Skin Probiotic Regulator Volume (K) Forecast, by Application 2020 & 2033
- Table 39: Germany Skin Probiotic Regulator Revenue (undefined) Forecast, by Application 2020 & 2033
- Table 40: Germany Skin Probiotic Regulator Volume (K) Forecast, by Application 2020 & 2033
- Table 41: France Skin Probiotic Regulator Revenue (undefined) Forecast, by Application 2020 & 2033
- Table 42: France Skin Probiotic Regulator Volume (K) Forecast, by Application 2020 & 2033
- Table 43: Italy Skin Probiotic Regulator Revenue (undefined) Forecast, by Application 2020 & 2033
- Table 44: Italy Skin Probiotic Regulator Volume (K) Forecast, by Application 2020 & 2033
- Table 45: Spain Skin Probiotic Regulator Revenue (undefined) Forecast, by Application 2020 & 2033
- Table 46: Spain Skin Probiotic Regulator Volume (K) Forecast, by Application 2020 & 2033
- Table 47: Russia Skin Probiotic Regulator Revenue (undefined) Forecast, by Application 2020 & 2033
- Table 48: Russia Skin Probiotic Regulator Volume (K) Forecast, by Application 2020 & 2033
- Table 49: Benelux Skin Probiotic Regulator Revenue (undefined) Forecast, by Application 2020 & 2033
- Table 50: Benelux Skin Probiotic Regulator Volume (K) Forecast, by Application 2020 & 2033
- Table 51: Nordics Skin Probiotic Regulator Revenue (undefined) Forecast, by Application 2020 & 2033
- Table 52: Nordics Skin Probiotic Regulator Volume (K) Forecast, by Application 2020 & 2033
- Table 53: Rest of Europe Skin Probiotic Regulator Revenue (undefined) Forecast, by Application 2020 & 2033
- Table 54: Rest of Europe Skin Probiotic Regulator Volume (K) Forecast, by Application 2020 & 2033
- Table 55: Global Skin Probiotic Regulator Revenue undefined Forecast, by Application 2020 & 2033
- Table 56: Global Skin Probiotic Regulator Volume K Forecast, by Application 2020 & 2033
- Table 57: Global Skin Probiotic Regulator Revenue undefined Forecast, by Type 2020 & 2033
- Table 58: Global Skin Probiotic Regulator Volume K Forecast, by Type 2020 & 2033
- Table 59: Global Skin Probiotic Regulator Revenue undefined Forecast, by Country 2020 & 2033
- Table 60: Global Skin Probiotic Regulator Volume K Forecast, by Country 2020 & 2033
- Table 61: Turkey Skin Probiotic Regulator Revenue (undefined) Forecast, by Application 2020 & 2033
- Table 62: Turkey Skin Probiotic Regulator Volume (K) Forecast, by Application 2020 & 2033
- Table 63: Israel Skin Probiotic Regulator Revenue (undefined) Forecast, by Application 2020 & 2033
- Table 64: Israel Skin Probiotic Regulator Volume (K) Forecast, by Application 2020 & 2033
- Table 65: GCC Skin Probiotic Regulator Revenue (undefined) Forecast, by Application 2020 & 2033
- Table 66: GCC Skin Probiotic Regulator Volume (K) Forecast, by Application 2020 & 2033
- Table 67: North Africa Skin Probiotic Regulator Revenue (undefined) Forecast, by Application 2020 & 2033
- Table 68: North Africa Skin Probiotic Regulator Volume (K) Forecast, by Application 2020 & 2033
- Table 69: South Africa Skin Probiotic Regulator Revenue (undefined) Forecast, by Application 2020 & 2033
- Table 70: South Africa Skin Probiotic Regulator Volume (K) Forecast, by Application 2020 & 2033
- Table 71: Rest of Middle East & Africa Skin Probiotic Regulator Revenue (undefined) Forecast, by Application 2020 & 2033
- Table 72: Rest of Middle East & Africa Skin Probiotic Regulator Volume (K) Forecast, by Application 2020 & 2033
- Table 73: Global Skin Probiotic Regulator Revenue undefined Forecast, by Application 2020 & 2033
- Table 74: Global Skin Probiotic Regulator Volume K Forecast, by Application 2020 & 2033
- Table 75: Global Skin Probiotic Regulator Revenue undefined Forecast, by Type 2020 & 2033
- Table 76: Global Skin Probiotic Regulator Volume K Forecast, by Type 2020 & 2033
- Table 77: Global Skin Probiotic Regulator Revenue undefined Forecast, by Country 2020 & 2033
- Table 78: Global Skin Probiotic Regulator Volume K Forecast, by Country 2020 & 2033
- Table 79: China Skin Probiotic Regulator Revenue (undefined) Forecast, by Application 2020 & 2033
- Table 80: China Skin Probiotic Regulator Volume (K) Forecast, by Application 2020 & 2033
- Table 81: India Skin Probiotic Regulator Revenue (undefined) Forecast, by Application 2020 & 2033
- Table 82: India Skin Probiotic Regulator Volume (K) Forecast, by Application 2020 & 2033
- Table 83: Japan Skin Probiotic Regulator Revenue (undefined) Forecast, by Application 2020 & 2033
- Table 84: Japan Skin Probiotic Regulator Volume (K) Forecast, by Application 2020 & 2033
- Table 85: South Korea Skin Probiotic Regulator Revenue (undefined) Forecast, by Application 2020 & 2033
- Table 86: South Korea Skin Probiotic Regulator Volume (K) Forecast, by Application 2020 & 2033
- Table 87: ASEAN Skin Probiotic Regulator Revenue (undefined) Forecast, by Application 2020 & 2033
- Table 88: ASEAN Skin Probiotic Regulator Volume (K) Forecast, by Application 2020 & 2033
- Table 89: Oceania Skin Probiotic Regulator Revenue (undefined) Forecast, by Application 2020 & 2033
- Table 90: Oceania Skin Probiotic Regulator Volume (K) Forecast, by Application 2020 & 2033
- Table 91: Rest of Asia Pacific Skin Probiotic Regulator Revenue (undefined) Forecast, by Application 2020 & 2033
- Table 92: Rest of Asia Pacific Skin Probiotic Regulator Volume (K) Forecast, by Application 2020 & 2033
Frequently Asked Questions
1. What is the projected Compound Annual Growth Rate (CAGR) of the Skin Probiotic Regulator?
The projected CAGR is approximately 11.9%.
2. Which companies are prominent players in the Skin Probiotic Regulator?
Key companies in the market include L’Oréal S.A., Unilever, The Estée Lauder Companies, Johnson & Johnson, Revlon, Evelo Biosciences, AOBiome, Azitra, GALLINÉE, Glowbiotics.
3. What are the main segments of the Skin Probiotic Regulator?
The market segments include Application, Type.
4. Can you provide details about the market size?
The market size is estimated to be USD XXX N/A as of 2022.
5. What are some drivers contributing to market growth?
N/A
6. What are the notable trends driving market growth?
N/A
7. Are there any restraints impacting market growth?
N/A
8. Can you provide examples of recent developments in the market?
N/A
9. What pricing options are available for accessing the report?
Pricing options include single-user, multi-user, and enterprise licenses priced at USD 3950.00, USD 5925.00, and USD 7900.00 respectively.
10. Is the market size provided in terms of value or volume?
The market size is provided in terms of value, measured in N/A and volume, measured in K.
11. Are there any specific market keywords associated with the report?
Yes, the market keyword associated with the report is "Skin Probiotic Regulator," which aids in identifying and referencing the specific market segment covered.
12. How do I determine which pricing option suits my needs best?
The pricing options vary based on user requirements and access needs. Individual users may opt for single-user licenses, while businesses requiring broader access may choose multi-user or enterprise licenses for cost-effective access to the report.
13. Are there any additional resources or data provided in the Skin Probiotic Regulator report?
While the report offers comprehensive insights, it's advisable to review the specific contents or supplementary materials provided to ascertain if additional resources or data are available.
14. How can I stay updated on further developments or reports in the Skin Probiotic Regulator?
To stay informed about further developments, trends, and reports in the Skin Probiotic Regulator, consider subscribing to industry newsletters, following relevant companies and organizations, or regularly checking reputable industry news sources and publications.
Methodology
Step 1 - Identification of Relevant Samples Size from Population Database


Step 2 - Approaches for Defining Global Market Size (Value, Volume* & Price*)

Note*: In applicable scenarios
Step 3 - Data Sources
Primary Research
- Web Analytics
- Survey Reports
- Research Institute
- Latest Research Reports
- Opinion Leaders
Secondary Research
- Annual Reports
- White Paper
- Latest Press Release
- Industry Association
- Paid Database
- Investor Presentations

Step 4 - Data Triangulation
Involves using different sources of information in order to increase the validity of a study
These sources are likely to be stakeholders in a program - participants, other researchers, program staff, other community members, and so on.
Then we put all data in single framework & apply various statistical tools to find out the dynamic on the market.
During the analysis stage, feedback from the stakeholder groups would be compared to determine areas of agreement as well as areas of divergence