

Key Insights
The Software Asset Management (SAM) Managed Service market is poised for significant expansion, driven by increasing software complexity, escalating license costs, and the imperative for robust compliance. Valued at an estimated $13.03 billion in 2025, this dynamic sector is projected to grow at a compound annual growth rate (CAGR) of 17.59% through 2033. This robust growth is fueled by organizations grappling with decentralized IT environments, the proliferation of SaaS applications, and the constant threat of audit penalties. Businesses are increasingly recognizing that proactive SAM managed services are not just about cost savings, but also about mitigating substantial risks associated with software licensing and intellectual property. The shift towards cloud-based solutions further accelerates this trend, as managing distributed cloud assets presents new challenges that outsourced SAM expertise can effectively address.
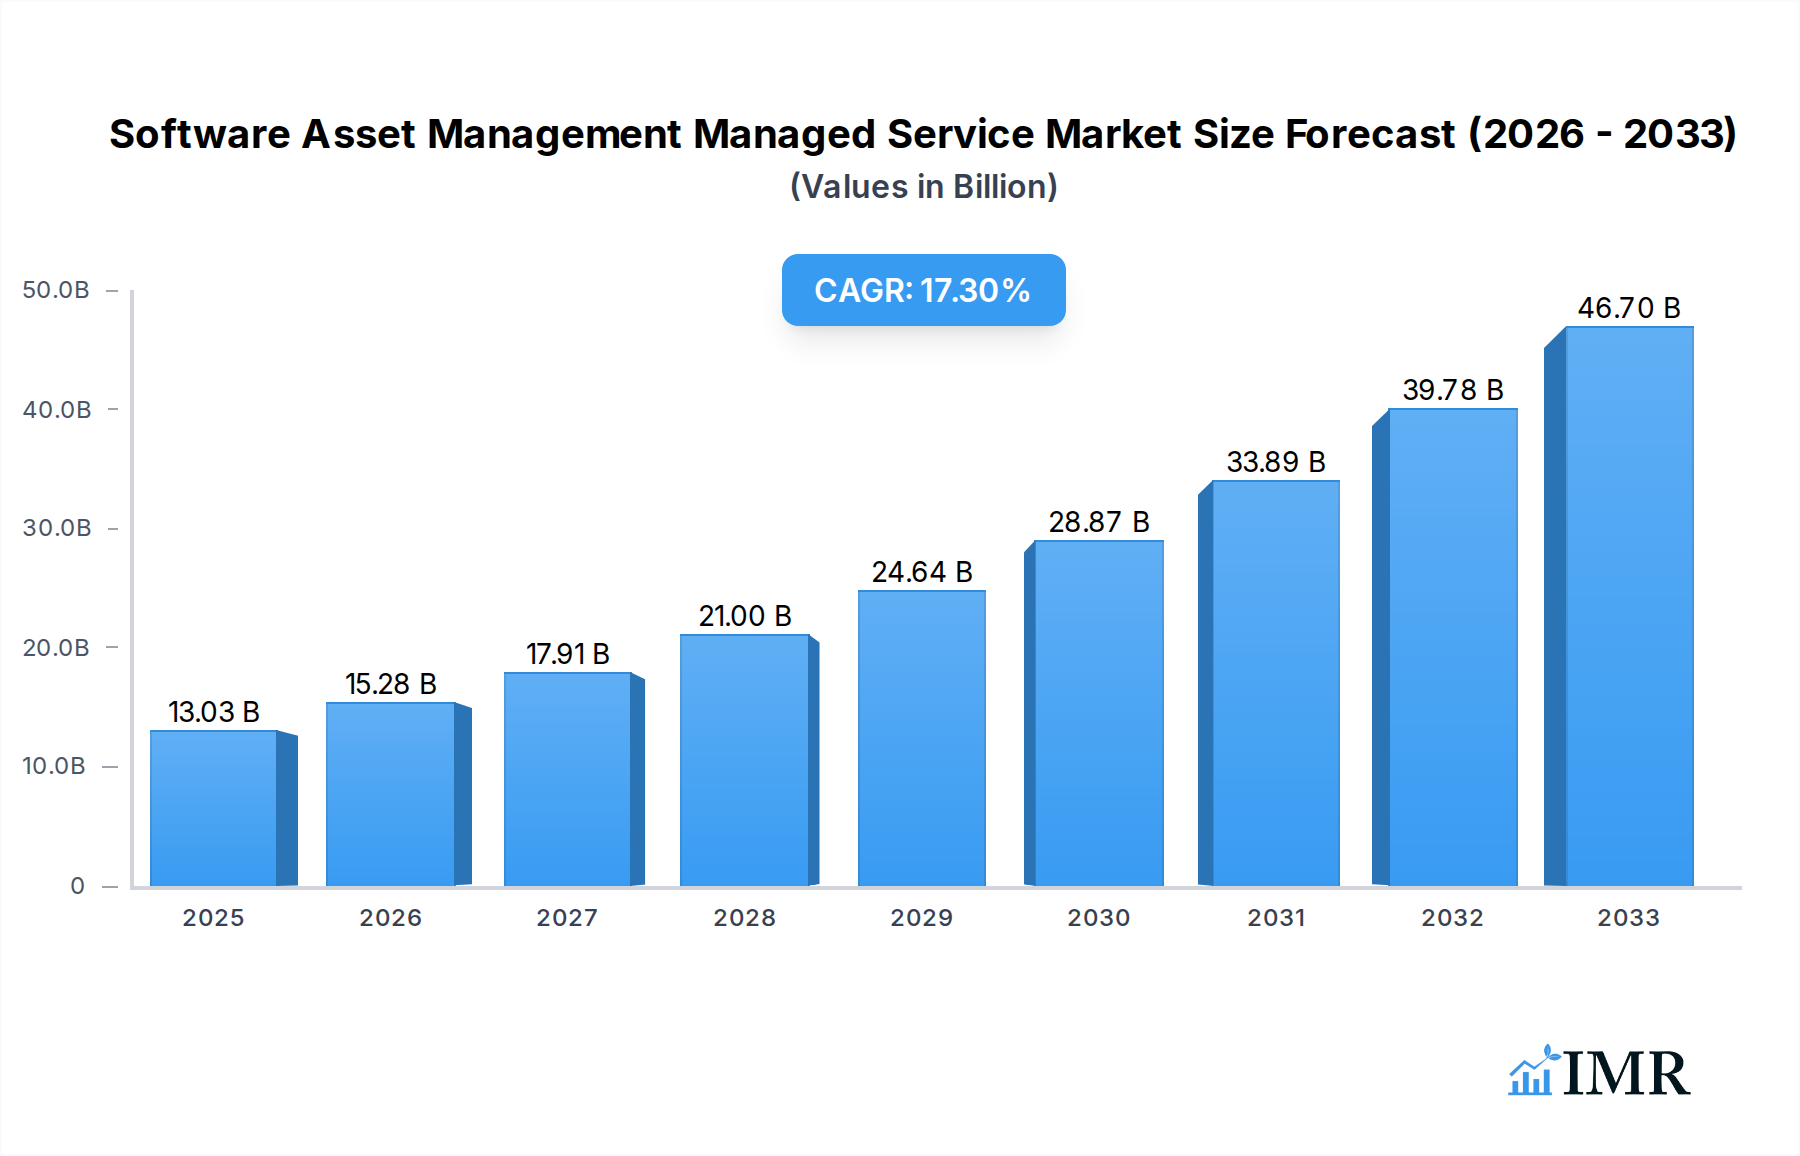
Software Asset Management Managed Service Market Size (In Billion)
Key drivers for this market's ascent include the growing demand for optimized software spending, the need to reduce operational overhead associated with in-house SAM teams, and the rising complexity of software license agreements across diverse vendor portfolios. Trends such as the adoption of AI and machine learning for automated discovery and reconciliation, coupled with a focus on proactive license optimization and cybersecurity, are shaping the SAM managed service landscape. While the initial investment in SAM solutions and the challenge of data accuracy can present restraints, the overwhelming benefits of enhanced control, improved security posture, and substantial cost avoidance are compelling organizations to invest in these specialized services. The market caters to a wide range of enterprises, from large corporations to small businesses, underscoring the universal need for effective software asset governance.

Software Asset Management Managed Service Company Market Share
Report Description: Software Asset Management Managed Service Market Analysis 2019-2033
This comprehensive report delivers an in-depth analysis of the Software Asset Management (SAM) Managed Service market, offering critical insights into its dynamics, growth trajectories, and future outlook. Spanning the historical period of 2019–2024 and projecting through 2033, this study is essential for industry professionals seeking to understand market concentration, technological innovation, regulatory landscapes, and competitive strategies within the global SAM managed service ecosystem. We provide granular data segmented by enterprise size (Large Enterprises 1000+ Users, Medium-Sized Enterprises 499-1000 Users, Small Enterprises 1-499 Users) and deployment type (Cloud-Based, On-Premises). With the base year set at 2025, the report leverages extensive research to forecast market evolution, identifying key drivers, emerging opportunities, and dominant players shaping this critical IT management sector.
Software Asset Management Managed Service Market Dynamics & Structure
The Software Asset Management Managed Service market exhibits a moderately fragmented structure, characterized by the presence of both established global players and specialized regional providers. Technological innovation, particularly in areas like AI-powered license optimization and automated compliance checking, serves as a primary driver, pushing organizations towards more sophisticated SAM solutions. The increasing complexity of software licensing models, especially within cloud environments, further fuels demand for managed services. Regulatory frameworks, including GDPR and upcoming data privacy legislation, necessitate robust SAM practices to ensure compliance and mitigate significant financial and reputational risks. Competitive product substitutes, such as in-house SAM teams or basic discovery tools, are increasingly being overshadowed by the comprehensive capabilities and cost-efficiency offered by managed services. End-user demographics are shifting, with a growing emphasis on cost optimization, risk reduction, and efficient resource allocation across all enterprise sizes. Mergers and acquisitions (M&A) activity is a notable trend, with larger SAM providers acquiring niche players to expand their service portfolios and geographical reach.
- Market Concentration: Moderately fragmented, with a mix of large global players and specialized niche providers.
- Technological Innovation: Driven by AI, machine learning for license optimization, and automated compliance.
- Regulatory Frameworks: Increasing scrutiny on data privacy and software compliance drives adoption.
- Competitive Substitutes: Managed services are outperforming in-house solutions and basic tools due to complexity.
- End-User Demographics: Growing demand for cost savings, risk mitigation, and resource optimization.
- M&A Trends: Active consolidation as companies seek to broaden service offerings and market presence.
Software Asset Management Managed Service Growth Trends & Insights
The Software Asset Management Managed Service market is poised for substantial growth over the forecast period, driven by an increasing recognition of the strategic importance of software license optimization and risk mitigation. The global market size, valued at $18.5 billion in 2025, is projected to expand at a Compound Annual Growth Rate (CAGR) of 9.2% from 2025 to 2033, reaching an estimated $37.8 billion by 2033. Adoption rates for managed SAM services are escalating across all enterprise segments, fueled by the rising complexity of software deployment models, including hybrid and multi-cloud environments. Technological disruptions, such as the integration of AI and machine learning for predictive license usage and automated reconciliation, are transforming SAM capabilities, moving beyond traditional inventory and compliance. Consumer behavior shifts are also playing a crucial role, with organizations increasingly prioritizing proactive risk management, cost containment through optimized license utilization, and the freeing up of internal IT resources to focus on strategic initiatives. The increasing prevalence of subscription-based software and Software-as-a-Service (SaaS) has amplified the need for continuous monitoring and management, a core strength of managed SAM services. Furthermore, the growing sophistication of cyber threats targeting software vulnerabilities underscores the essential role of robust SAM in an organization's overall security posture. The market penetration of managed SAM services is expected to deepen, as more businesses realize the tangible return on investment through reduced audit penalties, avoidance of shelfware, and improved negotiation power with software vendors. The insights derived from the historical period (2019–2024) indicate a steady upward trend, with early adopters demonstrating significant cost savings and compliance efficiencies, setting a precedent for wider market acceptance.
Dominant Regions, Countries, or Segments in Software Asset Management Managed Service
The North America region is projected to be the dominant force in the Software Asset Management Managed Service market, driven by a confluence of factors including a mature IT infrastructure, high adoption of advanced technologies, and stringent regulatory compliance mandates. The United States, in particular, represents a significant market share due to the presence of a large number of enterprises across various sectors, including technology, finance, and healthcare, all of whom are increasingly reliant on complex software portfolios. The robust economic policies that encourage technology investment and innovation further bolster the region's leadership.
Within the application segments, Large Enterprises (1000+ Users) are currently the largest contributors to the SAM managed service market, accounting for approximately 45% of the market value in 2025, estimated at $8.3 billion. Their extensive software deployments, complex licensing agreements, and significant financial stakes in compliance make them prime candidates for managed services. The need to manage vast software estates, mitigate substantial audit risks, and optimize expenditures across thousands of users drives their investment.
The Cloud-Based deployment type is exhibiting the fastest growth, projected to capture 55% of the market share by 2033, with an estimated market size of $20.8 billion in 2025. This dominance is attributed to the rapid migration of enterprises to cloud platforms, necessitating specialized SAM capabilities to manage SaaS, PaaS, and IaaS environments effectively. Cloud-based SAM solutions offer scalability, flexibility, and often a more cost-effective approach to managing dynamic cloud infrastructures compared to traditional on-premises solutions.
Key Drivers in North America:
- High concentration of large enterprises with complex software needs.
- Strict regulatory enforcement regarding software compliance and data privacy.
- Early adoption and widespread use of advanced IT technologies and cloud services.
- Strong demand for cost optimization and risk mitigation strategies.
Dominance Factors in Large Enterprises Segment:
- Extensive software portfolios across multiple vendors and platforms.
- High financial exposure to software audit penalties and non-compliance.
- Need for specialized expertise to navigate complex licensing agreements.
- Desire to offload the burden of SAM to dedicated service providers.
Factors Driving Cloud-Based Dominance:
- Rapid cloud migration across industries.
- Dynamic nature of cloud environments requiring continuous monitoring.
- Scalability and flexibility benefits of cloud-native SAM solutions.
- Integration capabilities with cloud management platforms.
Software Asset Management Managed Service Product Landscape
The Software Asset Management Managed Service product landscape is defined by increasingly sophisticated, integrated, and intelligent solutions. Innovations are centered around leveraging AI and machine learning for predictive license optimization, automated compliance checks, and anomaly detection in software usage. Platforms offer seamless integration with various cloud environments (AWS, Azure, GCP) and on-premises infrastructure, providing a unified view of the software estate. Performance metrics are measured by reduction in software spend, minimization of audit risks, and improvements in license utilization rates. Unique selling propositions include proactive threat detection related to software vulnerabilities and enhanced vendor negotiation leverage derived from granular usage data.
Key Drivers, Barriers & Challenges in Software Asset Management Managed Service
Key drivers propelling the Software Asset Management Managed Service market include the escalating complexity of software licensing, particularly in cloud and hybrid environments, and the rising threat of software audits with substantial financial penalties. The increasing demand for cost optimization and a desire to reduce IT operational overhead further fuel adoption. Moreover, stringent regulatory compliance mandates, such as GDPR and data privacy laws, necessitate robust SAM practices.
Barriers and challenges include the initial investment cost and perceived complexity of implementing SAM solutions, even managed ones. Resistance to change and a lack of awareness regarding the full benefits of SAM among some organizations can also hinder adoption. Supply chain disruptions, though less direct for services, can impact the availability of specialized SAM tools and expertise. Competitive pressures from in-house IT teams attempting to manage SAM internally, albeit often with less efficiency, remain a challenge.
Emerging Opportunities in Software Asset Management Managed Service
Emerging opportunities lie in the expanding managed services for niche software categories, such as specialized engineering or design software, where licensing is particularly complex. The growing adoption of IoT devices and the associated software management needs present a new frontier. Furthermore, integrating SAM managed services with broader IT risk management and cybersecurity frameworks offers significant potential for creating more holistic value propositions for clients. The rise of FinOps, which emphasizes financial accountability in the cloud, creates a natural synergy for SAM managed services to play a crucial role in cloud cost optimization.
Growth Accelerators in the Software Asset Management Managed Service Industry
Technological breakthroughs, particularly in the application of artificial intelligence and machine learning for automated license reconciliation and predictive usage analysis, are significant growth accelerators. Strategic partnerships between SAM managed service providers and cloud service providers, as well as major software vendors, are expanding market reach and service offerings. Market expansion strategies targeting underserved mid-market and small enterprises, by offering tailored and more affordable managed SAM solutions, are also key accelerators driving long-term growth.
Key Players Shaping the Software Asset Management Managed Service Market
- Anglepoint
- Certero
- IT Asset Management Solutions
- B-lay
- TMG
- Business Continuity Services (BCS)
- Derive Logic
- Elee
- Aspera
- Bytes Technology Group
- Crayon
- Deloitte
Notable Milestones in Software Asset Management Managed Service Sector
- 2019: Increased vendor audits for SaaS subscriptions highlight the growing need for managed cloud SAM.
- 2020: COVID-19 pandemic accelerates remote work, increasing the complexity of software license management for distributed workforces, boosting demand for SAM.
- 2021: Major software vendors introduce new, complex subscription and consumption-based licensing models, driving demand for expert SAM management.
- 2022: Growing focus on cybersecurity and data privacy compliance elevates the importance of SAM for software vulnerability management.
- 2023: Advancements in AI and machine learning begin to be integrated into SAM platforms, offering enhanced automation and predictive analytics.
- 2024: Increased M&A activity as larger SAM players acquire niche providers to expand service portfolios and market reach.
In-Depth Software Asset Management Managed Service Market Outlook
The future of the Software Asset Management Managed Service market is bright, driven by continuous technological advancements, increasing regulatory pressures, and the persistent need for cost optimization in IT environments. The integration of AI and machine learning will further automate complex SAM processes, providing deeper insights into software utilization and risk. Strategic partnerships and the expansion of services to new market segments, particularly small and medium-sized enterprises, will fuel continued growth. The evolving landscape of cloud computing and emerging technologies like IoT will present new challenges and opportunities, solidifying the indispensable role of managed SAM services in ensuring operational efficiency, financial control, and robust compliance for organizations worldwide.
Software Asset Management Managed Service Segmentation
-
1. Application
- 1.1. Large Enterprises (1000+Users)
- 1.2. Medium-Sized Enterprise (499-1000 Users)
- 1.3. Small Enterprises (1-499Users)
-
2. Types
- 2.1. Cloud-Based
- 2.2. On-Premises
Software Asset Management Managed Service Segmentation By Geography
-
1. North America
- 1.1. United States
- 1.2. Canada
- 1.3. Mexico
-
2. South America
- 2.1. Brazil
- 2.2. Argentina
- 2.3. Rest of South America
-
3. Europe
- 3.1. United Kingdom
- 3.2. Germany
- 3.3. France
- 3.4. Italy
- 3.5. Spain
- 3.6. Russia
- 3.7. Benelux
- 3.8. Nordics
- 3.9. Rest of Europe
-
4. Middle East & Africa
- 4.1. Turkey
- 4.2. Israel
- 4.3. GCC
- 4.4. North Africa
- 4.5. South Africa
- 4.6. Rest of Middle East & Africa
-
5. Asia Pacific
- 5.1. China
- 5.2. India
- 5.3. Japan
- 5.4. South Korea
- 5.5. ASEAN
- 5.6. Oceania
- 5.7. Rest of Asia Pacific
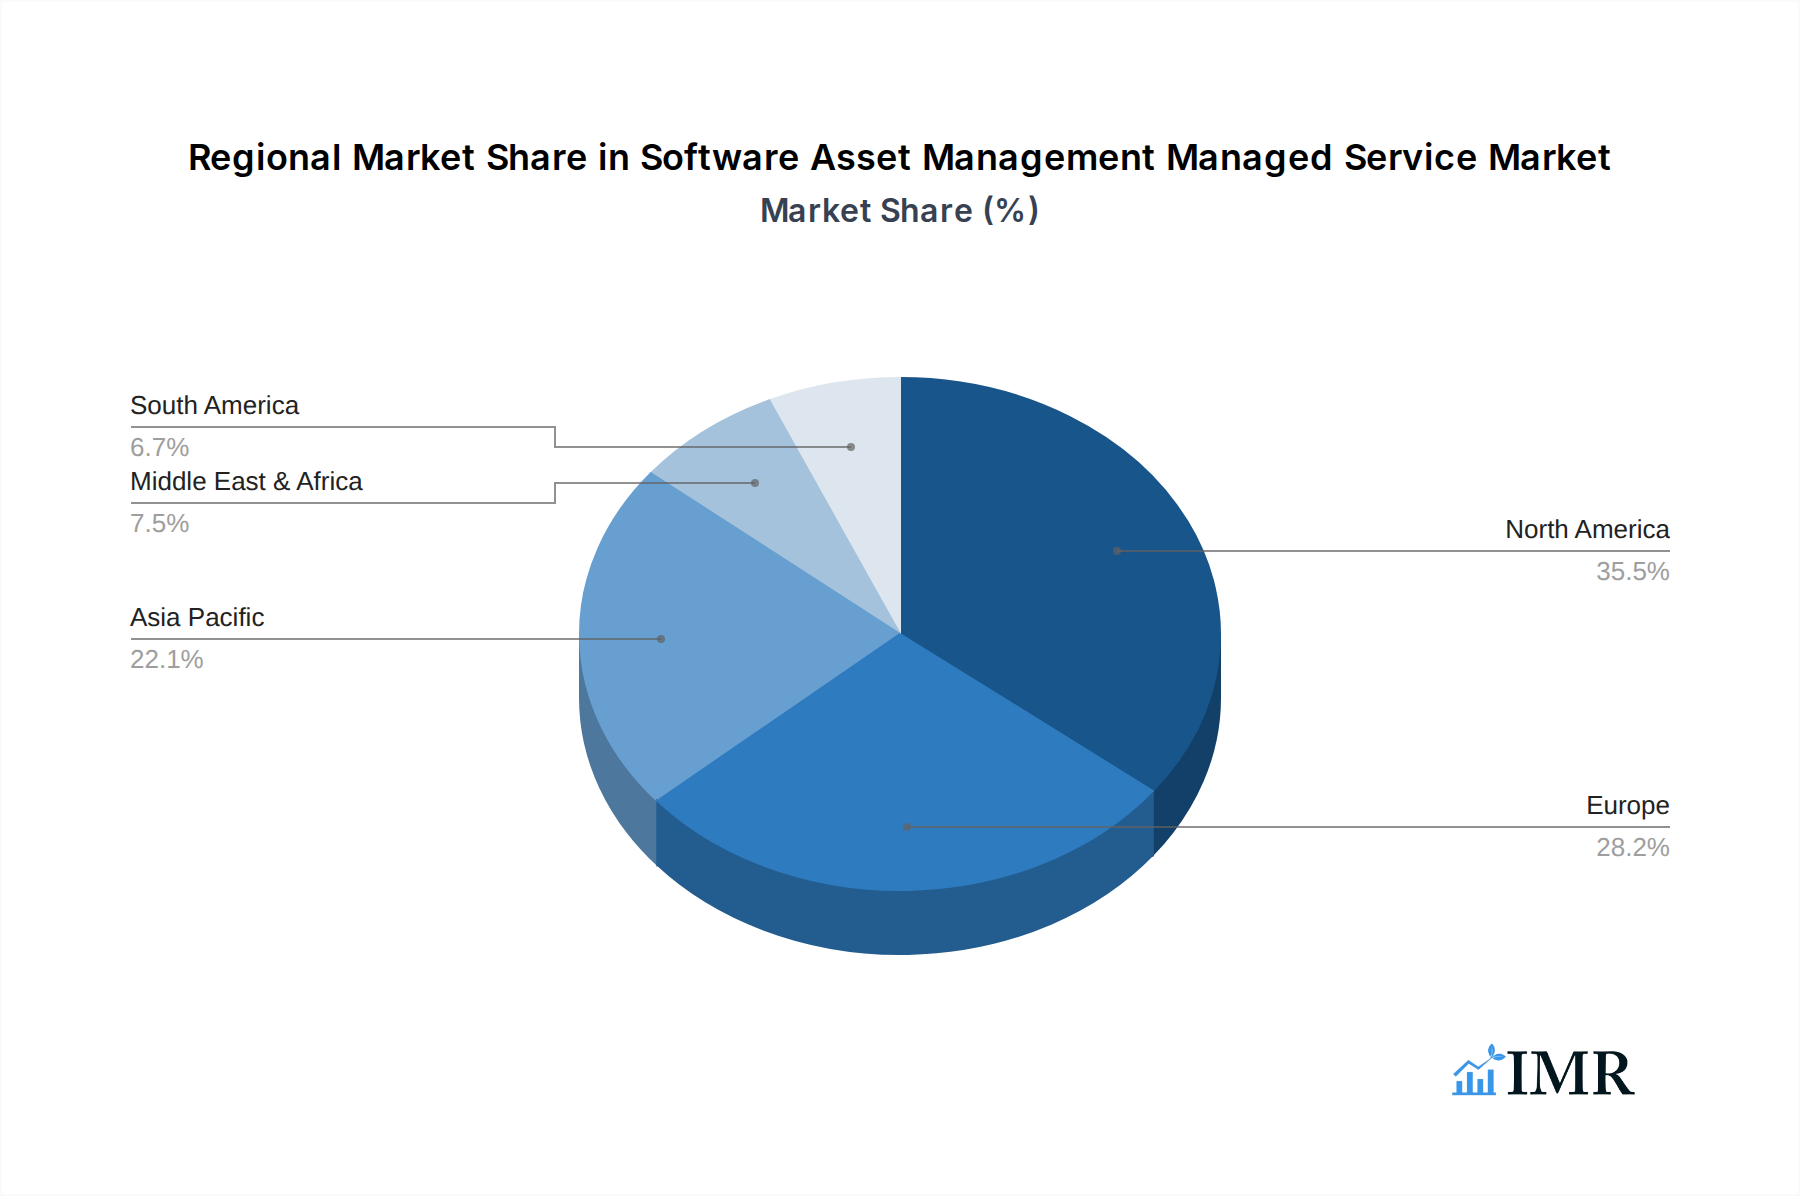
Software Asset Management Managed Service Regional Market Share
Geographic Coverage of Software Asset Management Managed Service
Software Asset Management Managed Service REPORT HIGHLIGHTS
| Aspects | Details |
|---|---|
| Study Period | 2020-2034 |
| Base Year | 2025 |
| Estimated Year | 2026 |
| Forecast Period | 2026-2034 |
| Historical Period | 2020-2025 |
| Growth Rate | CAGR of 17.59% from 2020-2034 |
| Segmentation |
|
Table of Contents
- 1. Introduction
- 1.1. Research Scope
- 1.2. Market Segmentation
- 1.3. Research Methodology
- 1.4. Definitions and Assumptions
- 2. Executive Summary
- 2.1. Introduction
- 3. Market Dynamics
- 3.1. Introduction
- 3.2. Market Drivers
- 3.3. Market Restrains
- 3.4. Market Trends
- 4. Market Factor Analysis
- 4.1. Porters Five Forces
- 4.2. Supply/Value Chain
- 4.3. PESTEL analysis
- 4.4. Market Entropy
- 4.5. Patent/Trademark Analysis
- 5. Global Software Asset Management Managed Service Analysis, Insights and Forecast, 2020-2032
- 5.1. Market Analysis, Insights and Forecast - by Application
- 5.1.1. Large Enterprises (1000+Users)
- 5.1.2. Medium-Sized Enterprise (499-1000 Users)
- 5.1.3. Small Enterprises (1-499Users)
- 5.2. Market Analysis, Insights and Forecast - by Types
- 5.2.1. Cloud-Based
- 5.2.2. On-Premises
- 5.3. Market Analysis, Insights and Forecast - by Region
- 5.3.1. North America
- 5.3.2. South America
- 5.3.3. Europe
- 5.3.4. Middle East & Africa
- 5.3.5. Asia Pacific
- 5.1. Market Analysis, Insights and Forecast - by Application
- 6. North America Software Asset Management Managed Service Analysis, Insights and Forecast, 2020-2032
- 6.1. Market Analysis, Insights and Forecast - by Application
- 6.1.1. Large Enterprises (1000+Users)
- 6.1.2. Medium-Sized Enterprise (499-1000 Users)
- 6.1.3. Small Enterprises (1-499Users)
- 6.2. Market Analysis, Insights and Forecast - by Types
- 6.2.1. Cloud-Based
- 6.2.2. On-Premises
- 6.1. Market Analysis, Insights and Forecast - by Application
- 7. South America Software Asset Management Managed Service Analysis, Insights and Forecast, 2020-2032
- 7.1. Market Analysis, Insights and Forecast - by Application
- 7.1.1. Large Enterprises (1000+Users)
- 7.1.2. Medium-Sized Enterprise (499-1000 Users)
- 7.1.3. Small Enterprises (1-499Users)
- 7.2. Market Analysis, Insights and Forecast - by Types
- 7.2.1. Cloud-Based
- 7.2.2. On-Premises
- 7.1. Market Analysis, Insights and Forecast - by Application
- 8. Europe Software Asset Management Managed Service Analysis, Insights and Forecast, 2020-2032
- 8.1. Market Analysis, Insights and Forecast - by Application
- 8.1.1. Large Enterprises (1000+Users)
- 8.1.2. Medium-Sized Enterprise (499-1000 Users)
- 8.1.3. Small Enterprises (1-499Users)
- 8.2. Market Analysis, Insights and Forecast - by Types
- 8.2.1. Cloud-Based
- 8.2.2. On-Premises
- 8.1. Market Analysis, Insights and Forecast - by Application
- 9. Middle East & Africa Software Asset Management Managed Service Analysis, Insights and Forecast, 2020-2032
- 9.1. Market Analysis, Insights and Forecast - by Application
- 9.1.1. Large Enterprises (1000+Users)
- 9.1.2. Medium-Sized Enterprise (499-1000 Users)
- 9.1.3. Small Enterprises (1-499Users)
- 9.2. Market Analysis, Insights and Forecast - by Types
- 9.2.1. Cloud-Based
- 9.2.2. On-Premises
- 9.1. Market Analysis, Insights and Forecast - by Application
- 10. Asia Pacific Software Asset Management Managed Service Analysis, Insights and Forecast, 2020-2032
- 10.1. Market Analysis, Insights and Forecast - by Application
- 10.1.1. Large Enterprises (1000+Users)
- 10.1.2. Medium-Sized Enterprise (499-1000 Users)
- 10.1.3. Small Enterprises (1-499Users)
- 10.2. Market Analysis, Insights and Forecast - by Types
- 10.2.1. Cloud-Based
- 10.2.2. On-Premises
- 10.1. Market Analysis, Insights and Forecast - by Application
- 11. Competitive Analysis
- 11.1. Global Market Share Analysis 2025
- 11.2. Company Profiles
- 11.2.1 Anglepoint
- 11.2.1.1. Overview
- 11.2.1.2. Products
- 11.2.1.3. SWOT Analysis
- 11.2.1.4. Recent Developments
- 11.2.1.5. Financials (Based on Availability)
- 11.2.2 Certero
- 11.2.2.1. Overview
- 11.2.2.2. Products
- 11.2.2.3. SWOT Analysis
- 11.2.2.4. Recent Developments
- 11.2.2.5. Financials (Based on Availability)
- 11.2.3 IT Asset Management Solutions
- 11.2.3.1. Overview
- 11.2.3.2. Products
- 11.2.3.3. SWOT Analysis
- 11.2.3.4. Recent Developments
- 11.2.3.5. Financials (Based on Availability)
- 11.2.4 B-lay
- 11.2.4.1. Overview
- 11.2.4.2. Products
- 11.2.4.3. SWOT Analysis
- 11.2.4.4. Recent Developments
- 11.2.4.5. Financials (Based on Availability)
- 11.2.5 TMG
- 11.2.5.1. Overview
- 11.2.5.2. Products
- 11.2.5.3. SWOT Analysis
- 11.2.5.4. Recent Developments
- 11.2.5.5. Financials (Based on Availability)
- 11.2.6 Business Continuity Services (BCS)
- 11.2.6.1. Overview
- 11.2.6.2. Products
- 11.2.6.3. SWOT Analysis
- 11.2.6.4. Recent Developments
- 11.2.6.5. Financials (Based on Availability)
- 11.2.7 Derive Logic
- 11.2.7.1. Overview
- 11.2.7.2. Products
- 11.2.7.3. SWOT Analysis
- 11.2.7.4. Recent Developments
- 11.2.7.5. Financials (Based on Availability)
- 11.2.8 Elee
- 11.2.8.1. Overview
- 11.2.8.2. Products
- 11.2.8.3. SWOT Analysis
- 11.2.8.4. Recent Developments
- 11.2.8.5. Financials (Based on Availability)
- 11.2.9 Aspera
- 11.2.9.1. Overview
- 11.2.9.2. Products
- 11.2.9.3. SWOT Analysis
- 11.2.9.4. Recent Developments
- 11.2.9.5. Financials (Based on Availability)
- 11.2.10 Bytes Technology Group
- 11.2.10.1. Overview
- 11.2.10.2. Products
- 11.2.10.3. SWOT Analysis
- 11.2.10.4. Recent Developments
- 11.2.10.5. Financials (Based on Availability)
- 11.2.11 Crayon
- 11.2.11.1. Overview
- 11.2.11.2. Products
- 11.2.11.3. SWOT Analysis
- 11.2.11.4. Recent Developments
- 11.2.11.5. Financials (Based on Availability)
- 11.2.12 Deloitte
- 11.2.12.1. Overview
- 11.2.12.2. Products
- 11.2.12.3. SWOT Analysis
- 11.2.12.4. Recent Developments
- 11.2.12.5. Financials (Based on Availability)
- 11.2.1 Anglepoint
List of Figures
- Figure 1: Global Software Asset Management Managed Service Revenue Breakdown (undefined, %) by Region 2025 & 2033
- Figure 2: North America Software Asset Management Managed Service Revenue (undefined), by Application 2025 & 2033
- Figure 3: North America Software Asset Management Managed Service Revenue Share (%), by Application 2025 & 2033
- Figure 4: North America Software Asset Management Managed Service Revenue (undefined), by Types 2025 & 2033
- Figure 5: North America Software Asset Management Managed Service Revenue Share (%), by Types 2025 & 2033
- Figure 6: North America Software Asset Management Managed Service Revenue (undefined), by Country 2025 & 2033
- Figure 7: North America Software Asset Management Managed Service Revenue Share (%), by Country 2025 & 2033
- Figure 8: South America Software Asset Management Managed Service Revenue (undefined), by Application 2025 & 2033
- Figure 9: South America Software Asset Management Managed Service Revenue Share (%), by Application 2025 & 2033
- Figure 10: South America Software Asset Management Managed Service Revenue (undefined), by Types 2025 & 2033
- Figure 11: South America Software Asset Management Managed Service Revenue Share (%), by Types 2025 & 2033
- Figure 12: South America Software Asset Management Managed Service Revenue (undefined), by Country 2025 & 2033
- Figure 13: South America Software Asset Management Managed Service Revenue Share (%), by Country 2025 & 2033
- Figure 14: Europe Software Asset Management Managed Service Revenue (undefined), by Application 2025 & 2033
- Figure 15: Europe Software Asset Management Managed Service Revenue Share (%), by Application 2025 & 2033
- Figure 16: Europe Software Asset Management Managed Service Revenue (undefined), by Types 2025 & 2033
- Figure 17: Europe Software Asset Management Managed Service Revenue Share (%), by Types 2025 & 2033
- Figure 18: Europe Software Asset Management Managed Service Revenue (undefined), by Country 2025 & 2033
- Figure 19: Europe Software Asset Management Managed Service Revenue Share (%), by Country 2025 & 2033
- Figure 20: Middle East & Africa Software Asset Management Managed Service Revenue (undefined), by Application 2025 & 2033
- Figure 21: Middle East & Africa Software Asset Management Managed Service Revenue Share (%), by Application 2025 & 2033
- Figure 22: Middle East & Africa Software Asset Management Managed Service Revenue (undefined), by Types 2025 & 2033
- Figure 23: Middle East & Africa Software Asset Management Managed Service Revenue Share (%), by Types 2025 & 2033
- Figure 24: Middle East & Africa Software Asset Management Managed Service Revenue (undefined), by Country 2025 & 2033
- Figure 25: Middle East & Africa Software Asset Management Managed Service Revenue Share (%), by Country 2025 & 2033
- Figure 26: Asia Pacific Software Asset Management Managed Service Revenue (undefined), by Application 2025 & 2033
- Figure 27: Asia Pacific Software Asset Management Managed Service Revenue Share (%), by Application 2025 & 2033
- Figure 28: Asia Pacific Software Asset Management Managed Service Revenue (undefined), by Types 2025 & 2033
- Figure 29: Asia Pacific Software Asset Management Managed Service Revenue Share (%), by Types 2025 & 2033
- Figure 30: Asia Pacific Software Asset Management Managed Service Revenue (undefined), by Country 2025 & 2033
- Figure 31: Asia Pacific Software Asset Management Managed Service Revenue Share (%), by Country 2025 & 2033
List of Tables
- Table 1: Global Software Asset Management Managed Service Revenue undefined Forecast, by Application 2020 & 2033
- Table 2: Global Software Asset Management Managed Service Revenue undefined Forecast, by Types 2020 & 2033
- Table 3: Global Software Asset Management Managed Service Revenue undefined Forecast, by Region 2020 & 2033
- Table 4: Global Software Asset Management Managed Service Revenue undefined Forecast, by Application 2020 & 2033
- Table 5: Global Software Asset Management Managed Service Revenue undefined Forecast, by Types 2020 & 2033
- Table 6: Global Software Asset Management Managed Service Revenue undefined Forecast, by Country 2020 & 2033
- Table 7: United States Software Asset Management Managed Service Revenue (undefined) Forecast, by Application 2020 & 2033
- Table 8: Canada Software Asset Management Managed Service Revenue (undefined) Forecast, by Application 2020 & 2033
- Table 9: Mexico Software Asset Management Managed Service Revenue (undefined) Forecast, by Application 2020 & 2033
- Table 10: Global Software Asset Management Managed Service Revenue undefined Forecast, by Application 2020 & 2033
- Table 11: Global Software Asset Management Managed Service Revenue undefined Forecast, by Types 2020 & 2033
- Table 12: Global Software Asset Management Managed Service Revenue undefined Forecast, by Country 2020 & 2033
- Table 13: Brazil Software Asset Management Managed Service Revenue (undefined) Forecast, by Application 2020 & 2033
- Table 14: Argentina Software Asset Management Managed Service Revenue (undefined) Forecast, by Application 2020 & 2033
- Table 15: Rest of South America Software Asset Management Managed Service Revenue (undefined) Forecast, by Application 2020 & 2033
- Table 16: Global Software Asset Management Managed Service Revenue undefined Forecast, by Application 2020 & 2033
- Table 17: Global Software Asset Management Managed Service Revenue undefined Forecast, by Types 2020 & 2033
- Table 18: Global Software Asset Management Managed Service Revenue undefined Forecast, by Country 2020 & 2033
- Table 19: United Kingdom Software Asset Management Managed Service Revenue (undefined) Forecast, by Application 2020 & 2033
- Table 20: Germany Software Asset Management Managed Service Revenue (undefined) Forecast, by Application 2020 & 2033
- Table 21: France Software Asset Management Managed Service Revenue (undefined) Forecast, by Application 2020 & 2033
- Table 22: Italy Software Asset Management Managed Service Revenue (undefined) Forecast, by Application 2020 & 2033
- Table 23: Spain Software Asset Management Managed Service Revenue (undefined) Forecast, by Application 2020 & 2033
- Table 24: Russia Software Asset Management Managed Service Revenue (undefined) Forecast, by Application 2020 & 2033
- Table 25: Benelux Software Asset Management Managed Service Revenue (undefined) Forecast, by Application 2020 & 2033
- Table 26: Nordics Software Asset Management Managed Service Revenue (undefined) Forecast, by Application 2020 & 2033
- Table 27: Rest of Europe Software Asset Management Managed Service Revenue (undefined) Forecast, by Application 2020 & 2033
- Table 28: Global Software Asset Management Managed Service Revenue undefined Forecast, by Application 2020 & 2033
- Table 29: Global Software Asset Management Managed Service Revenue undefined Forecast, by Types 2020 & 2033
- Table 30: Global Software Asset Management Managed Service Revenue undefined Forecast, by Country 2020 & 2033
- Table 31: Turkey Software Asset Management Managed Service Revenue (undefined) Forecast, by Application 2020 & 2033
- Table 32: Israel Software Asset Management Managed Service Revenue (undefined) Forecast, by Application 2020 & 2033
- Table 33: GCC Software Asset Management Managed Service Revenue (undefined) Forecast, by Application 2020 & 2033
- Table 34: North Africa Software Asset Management Managed Service Revenue (undefined) Forecast, by Application 2020 & 2033
- Table 35: South Africa Software Asset Management Managed Service Revenue (undefined) Forecast, by Application 2020 & 2033
- Table 36: Rest of Middle East & Africa Software Asset Management Managed Service Revenue (undefined) Forecast, by Application 2020 & 2033
- Table 37: Global Software Asset Management Managed Service Revenue undefined Forecast, by Application 2020 & 2033
- Table 38: Global Software Asset Management Managed Service Revenue undefined Forecast, by Types 2020 & 2033
- Table 39: Global Software Asset Management Managed Service Revenue undefined Forecast, by Country 2020 & 2033
- Table 40: China Software Asset Management Managed Service Revenue (undefined) Forecast, by Application 2020 & 2033
- Table 41: India Software Asset Management Managed Service Revenue (undefined) Forecast, by Application 2020 & 2033
- Table 42: Japan Software Asset Management Managed Service Revenue (undefined) Forecast, by Application 2020 & 2033
- Table 43: South Korea Software Asset Management Managed Service Revenue (undefined) Forecast, by Application 2020 & 2033
- Table 44: ASEAN Software Asset Management Managed Service Revenue (undefined) Forecast, by Application 2020 & 2033
- Table 45: Oceania Software Asset Management Managed Service Revenue (undefined) Forecast, by Application 2020 & 2033
- Table 46: Rest of Asia Pacific Software Asset Management Managed Service Revenue (undefined) Forecast, by Application 2020 & 2033
Frequently Asked Questions
1. What is the projected Compound Annual Growth Rate (CAGR) of the Software Asset Management Managed Service?
The projected CAGR is approximately 17.59%.
2. Which companies are prominent players in the Software Asset Management Managed Service?
Key companies in the market include Anglepoint, Certero, IT Asset Management Solutions, B-lay, TMG, Business Continuity Services (BCS), Derive Logic, Elee, Aspera, Bytes Technology Group, Crayon, Deloitte.
3. What are the main segments of the Software Asset Management Managed Service?
The market segments include Application, Types.
4. Can you provide details about the market size?
The market size is estimated to be USD XXX N/A as of 2022.
5. What are some drivers contributing to market growth?
N/A
6. What are the notable trends driving market growth?
N/A
7. Are there any restraints impacting market growth?
N/A
8. Can you provide examples of recent developments in the market?
N/A
9. What pricing options are available for accessing the report?
Pricing options include single-user, multi-user, and enterprise licenses priced at USD 3950.00, USD 5925.00, and USD 7900.00 respectively.
10. Is the market size provided in terms of value or volume?
The market size is provided in terms of value, measured in N/A.
11. Are there any specific market keywords associated with the report?
Yes, the market keyword associated with the report is "Software Asset Management Managed Service," which aids in identifying and referencing the specific market segment covered.
12. How do I determine which pricing option suits my needs best?
The pricing options vary based on user requirements and access needs. Individual users may opt for single-user licenses, while businesses requiring broader access may choose multi-user or enterprise licenses for cost-effective access to the report.
13. Are there any additional resources or data provided in the Software Asset Management Managed Service report?
While the report offers comprehensive insights, it's advisable to review the specific contents or supplementary materials provided to ascertain if additional resources or data are available.
14. How can I stay updated on further developments or reports in the Software Asset Management Managed Service?
To stay informed about further developments, trends, and reports in the Software Asset Management Managed Service, consider subscribing to industry newsletters, following relevant companies and organizations, or regularly checking reputable industry news sources and publications.
Methodology
Step 1 - Identification of Relevant Samples Size from Population Database


Step 2 - Approaches for Defining Global Market Size (Value, Volume* & Price*)

Note*: In applicable scenarios
Step 3 - Data Sources
Primary Research
- Web Analytics
- Survey Reports
- Research Institute
- Latest Research Reports
- Opinion Leaders
Secondary Research
- Annual Reports
- White Paper
- Latest Press Release
- Industry Association
- Paid Database
- Investor Presentations

Step 4 - Data Triangulation
Involves using different sources of information in order to increase the validity of a study
These sources are likely to be stakeholders in a program - participants, other researchers, program staff, other community members, and so on.
Then we put all data in single framework & apply various statistical tools to find out the dynamic on the market.
During the analysis stage, feedback from the stakeholder groups would be compared to determine areas of agreement as well as areas of divergence