

Key Insights
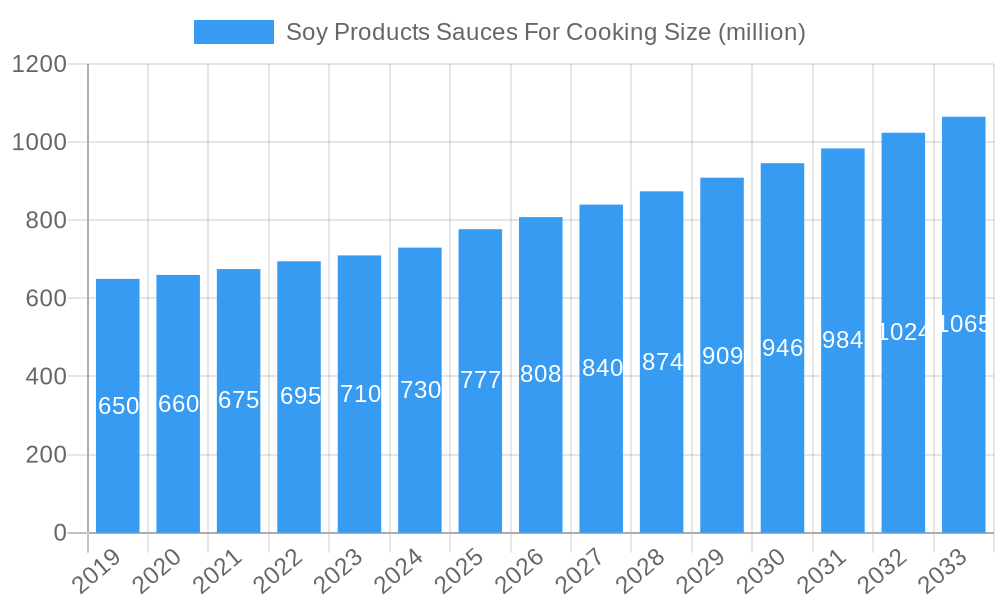
The global Soy Products Sauces For Cooking market is poised for robust expansion, projected to reach approximately \$777 million by 2025. This growth is underpinned by a Compound Annual Growth Rate (CAGR) of 4%, indicating a steady and sustained upward trajectory for the industry. Key drivers fueling this market expansion include the increasing consumer preference for authentic and diverse culinary experiences, a rising global population, and the growing adoption of soy-based products as healthier alternatives to traditional sauces. The demand for convenient and flavorful cooking ingredients continues to surge, especially with busy lifestyles and a greater emphasis on home cooking. Furthermore, the expanding e-commerce landscape and the accessibility of a wide array of soy sauce varieties are significantly contributing to market penetration across diverse demographics. Innovations in product formulations, including the introduction of low-sodium, organic, and gluten-free options, are also attracting a broader consumer base and addressing specific dietary needs.
Soy Products Sauces For Cooking Market Size (In Million)
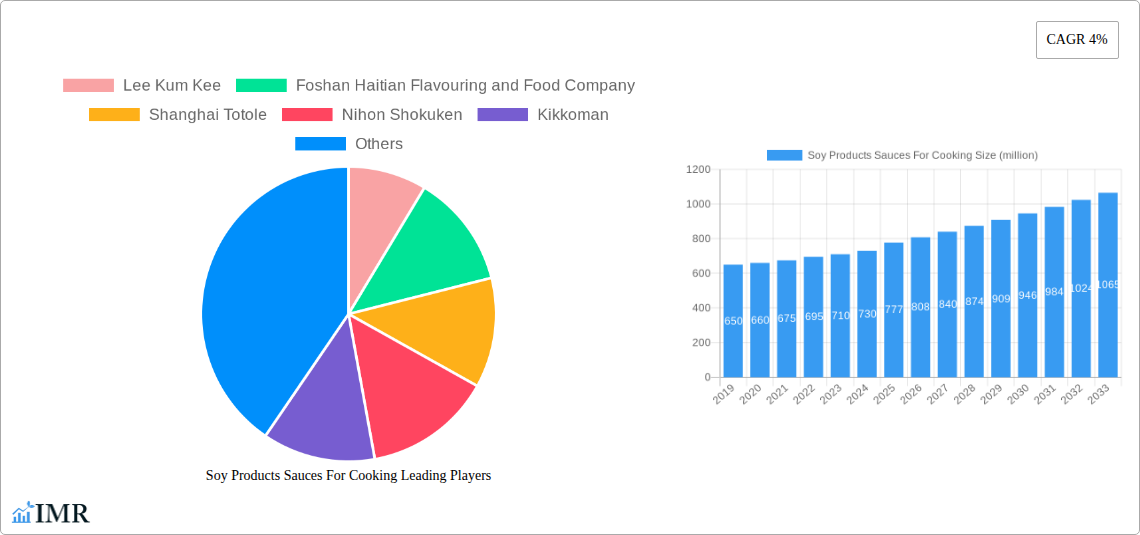
The market's segmentation reveals distinct opportunities within both consumer and business-to-business (B2B) channels. Online sales are expected to witness substantial growth, driven by the convenience and reach of e-commerce platforms, while offline retail channels will continue to cater to traditional purchasing habits. In the B2B segment, restaurants and food processing plants represent significant demand centers, leveraging soy sauces for their versatility in marinades, stir-fries, and a multitude of other dishes. By type, Soybean Paste and Pea Sauce are anticipated to lead, reflecting their widespread culinary applications and cultural significance, with "Others" also presenting promising potential as niche and emerging soy-based sauce varieties gain traction. Geographically, the Asia Pacific region, particularly China and India, is a dominant force due to its deep-rooted culinary traditions and large consumer base. However, North America and Europe are also exhibiting strong growth, driven by increasing awareness of Asian cuisines and the health benefits associated with soy products. Companies like Lee Kum Kee, Foshan Haitian Flavouring and Food Company, and Kikkoman are at the forefront of innovation and market expansion, strategically positioning themselves to capitalize on these evolving market dynamics.
Soy Products Sauces For Cooking Company Market Share
This in-depth report provides a definitive analysis of the global Soy Products Sauces for Cooking market, encompassing its intricate dynamics, growth trajectories, regional dominance, product innovation, and competitive landscape. Designed for industry professionals, investors, and strategic planners, this report offers actionable insights, leveraging high-traffic SEO keywords to ensure maximum visibility and engagement within the food and beverage sector. We meticulously examine the parent and child market segments to deliver a holistic understanding of market drivers and potential.
Soy Products Sauces For Cooking Market Dynamics & Structure
The Soy Products Sauces for Cooking market exhibits a moderately consolidated structure, characterized by the strong presence of both multinational corporations and significant regional players. Technological innovation is a primary driver, with companies investing in advanced fermentation techniques, flavor enhancement, and sustainable sourcing to meet evolving consumer demands for healthier and more authentic culinary experiences. Regulatory frameworks, particularly concerning food safety standards and labeling requirements in major markets, play a crucial role in shaping product development and market entry strategies. Competitive product substitutes, such as other fermented sauces and spice blends, pose a constant challenge, necessitating continuous product differentiation and value addition. End-user demographics are shifting, with a growing demand from health-conscious consumers seeking natural ingredients and reduced sodium options. Mergers and acquisitions (M&A) trends are observed, indicating a strategic consolidation to expand market reach, acquire new technologies, and enhance product portfolios. For instance, a recent M&A deal in the Asian market involved a leading Chinese soy sauce producer acquiring a smaller specialty sauce manufacturer, aiming to broaden its product offerings and tap into niche markets. The market concentration is estimated to be around 65%, with the top five players holding a significant share. M&A deal volumes are projected to increase by 8% annually over the forecast period, driven by the pursuit of economies of scale and market penetration. Innovation barriers include the high cost of research and development for novel fermentation processes and the stringent regulatory approvals required for new product introductions.
Soy Products Sauces For Cooking Growth Trends & Insights
The global Soy Products Sauces for Cooking market is poised for substantial growth, projected to expand from an estimated market size of $14,500 million units in the base year of 2025 to $21,000 million units by the end of the forecast period in 2033, exhibiting a Compound Annual Growth Rate (CAGR) of approximately 4.8%. This growth is underpinned by an increasing global appetite for diverse culinary flavors, particularly within Asian cuisine, which heavily relies on soy-based sauces. Adoption rates for premium and specialty soy sauces are accelerating as consumers become more discerning about ingredients and taste profiles. Technological disruptions, such as the development of advanced flavor profiling technologies and bio-fermentation advancements, are enabling the creation of more sophisticated and health-conscious sauce options, including low-sodium and organic variants. Consumer behavior shifts are playing a pivotal role; there's a discernible trend towards home cooking, amplified by recent global events, leading to increased demand for cooking ingredients. Furthermore, a growing awareness of the functional benefits of fermented foods, including improved gut health, is contributing to the popularity of soy sauces. The penetration of online sales channels for specialty food products has also surged, making a wider range of soy sauces accessible to a global consumer base. The market penetration of specialized soy sauces is estimated to grow from 30% in 2019 to 45% by 2033. Technological advancements in shelf-life extension and flavor preservation are also key contributors, reducing wastage and enhancing product appeal. The increasing disposable income in developing economies further fuels this growth, as consumers are willing to spend more on quality food ingredients.
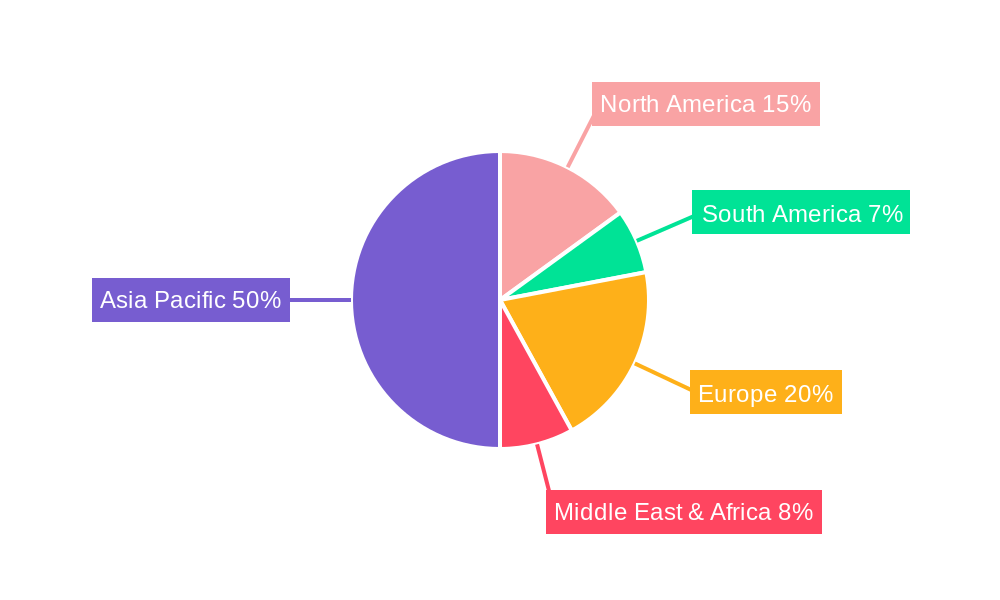
Dominant Regions, Countries, or Segments in Soy Products Sauces For Cooking
The Asian region, particularly East and Southeast Asia, unequivocally dominates the Soy Products Sauces for Cooking market. Within this region, China stands out as the largest consumer and producer, driven by its deeply ingrained culinary traditions and a burgeoning middle class with a strong preference for authentic flavors. The Restaurant (to B) segment is a primary growth engine within China and across Asia, accounting for an estimated 45% of the total market share in 2025. This is attributed to the widespread presence of Chinese restaurants globally and the high volume of soy sauce consumed in professional kitchens. Furthermore, the Food Processing Plant (to B) segment is also experiencing significant growth, as manufacturers incorporate soy sauces into a wide array of processed food products, including marinades, ready-to-eat meals, and snacks. The Soybean Paste type also holds a significant market share, estimated at 55% in 2025, due to its versatility in various Asian cuisines. Key drivers in this dominant region include robust economic policies supporting the food industry, significant investments in agricultural infrastructure for soybean cultivation, and a vast domestic market with a high per capita consumption of soy-based products. The growth potential in other Asian countries like Japan, South Korea, and Vietnam remains substantial, fueled by their unique culinary applications of soy sauces. The Offline Sales (to C) segment, while still significant, is witnessing a gradual shift towards online channels, especially in urban areas. The economic policies in China, focusing on food security and agricultural innovation, directly benefit soybean cultivation and processing, thus supporting the soy sauce industry. The infrastructure development in terms of logistics and cold chain management further enhances the reach and availability of these products across vast geographies. Market share for Soybean Paste in Asia is projected to remain above 50% throughout the forecast period, indicating its enduring popularity.
Soy Products Sauces For Cooking Product Landscape
The product landscape of Soy Products Sauces for Cooking is characterized by a continuous evolution driven by innovation and the pursuit of enhanced consumer experiences. Manufacturers are actively developing a diverse range of soy sauces, from traditional, slow-fermented varieties boasting complex umami profiles to modern, health-focused options with reduced sodium and organic certifications. Applications extend beyond simple seasoning, with soy sauces being integral components in marinades, glazes, dipping sauces, and as a base for more complex flavor formulations. Performance metrics are increasingly focused on ingredient quality, fermentation consistency, and flavor intensity. Unique selling propositions often revolve around the origin of soybeans, the traditional brewing methods employed, or the incorporation of specific regional flavor profiles. Technological advancements are enabling the creation of specialized soy sauces, such as gluten-free options, allergen-friendly formulations, and those enriched with probiotics, catering to a wider spectrum of consumer needs and preferences.
Key Drivers, Barriers & Challenges in Soy Products Sauces For Cooking
Key Drivers:
- Growing Global Appetite for Asian Cuisine: The increasing popularity of Asian food globally is a primary driver, leading to higher demand for authentic soy sauces.
- Health and Wellness Trends: A rising consumer focus on natural ingredients, lower sodium content, and the perceived health benefits of fermented products are propelling demand for premium and specialized soy sauces.
- Innovation in Product Development: Manufacturers are continuously innovating with new flavor profiles, functional ingredients, and packaging solutions to meet evolving consumer preferences.
- E-commerce Growth: The expansion of online retail channels provides wider accessibility and convenience for consumers to purchase soy sauce products globally.
Barriers & Challenges:
- Supply Chain Volatility: Fluctuations in soybean prices and availability, influenced by weather patterns and geopolitical factors, can impact production costs and supply chain stability.
- Regulatory Hurdles: Navigating diverse and evolving food safety regulations across different countries presents a significant challenge for market entry and product compliance.
- Intense Competition: The market is characterized by a high degree of competition from established global brands, regional players, and emerging niche producers, leading to price pressures.
- Consumer Perception of Health: While some consumers associate soy sauce with health benefits, others remain concerned about its sodium content, necessitating ongoing education and the development of low-sodium alternatives. Supply chain disruptions due to natural disasters have, in the past year, led to an average increase of 5% in raw material costs for key manufacturers.
Emerging Opportunities in Soy Products Sauces For Cooking
Emerging opportunities lie in the development of specialty and gourmet soy sauces tailored to specific culinary applications and regional tastes. There is a significant untapped market for plant-based alternatives that mimic the flavor profile of traditional soy sauce without the use of soybeans, catering to a growing vegan and flexitarian population. Furthermore, the demand for fortified soy sauces with added functional ingredients like vitamins or probiotics presents a novel avenue for market expansion. Innovations in sustainable packaging and transparent sourcing initiatives are also gaining traction, appealing to environmentally conscious consumers. The increasing interest in DIY and home gourmet cooking further opens doors for premium, artisanal soy sauces.
Growth Accelerators in the Soy Products Sauces For Cooking Industry
Long-term growth in the Soy Products Sauces for Cooking industry will be significantly accelerated by strategic partnerships between soy sauce manufacturers and culinary influencers, as well as food bloggers, to enhance brand visibility and product adoption. Technological breakthroughs in fermentation science will enable the creation of novel flavor compounds and improved nutritional profiles, differentiating products in a crowded market. Furthermore, market expansion strategies targeting emerging economies with growing disposable incomes and an increasing exposure to global cuisines will unlock substantial growth potential. Investments in vertical integration to secure soybean supply and control quality from farm to bottle will also act as a key accelerator.
Key Players Shaping the Soy Products Sauces For Cooking Market
- Lee Kum Kee
- Foshan Haitian Flavouring and Food Company
- Shanghai Totole
- Nihon Shokuken
- Kikkoman
- Lao Gan Ma
- Yihai International
- Teway Food
- Kewpie Food
- House Foods
- Ajinomoto
- Zhumadian Wangshouyi Multi-Flavoured Spice Group
Notable Milestones in Soy Products Sauces For Cooking Sector
- 2019: Lee Kum Kee launches a new line of organic, non-GMO soy sauces in response to growing consumer demand for healthier options.
- 2020: Foshan Haitian Flavouring and Food Company invests heavily in automation and R&D to expand its production capacity for its core product lines.
- 2021: Kikkoman introduces a series of innovative flavor-infused soy sauces in the North American market, catering to evolving taste preferences.
- 2022: Yihai International announces plans for significant expansion into Southeast Asian markets, focusing on localizing product offerings.
- 2023: Nihon Shokuken patents a new enzymatic process for producing low-sodium soy sauce with enhanced flavor complexity.
- 2024: Lao Gan Ma reports record sales driven by its strong online presence and international brand recognition.
In-Depth Soy Products Sauces For Cooking Market Outlook
The future outlook for the Soy Products Sauces for Cooking market remains exceptionally bright, driven by persistent global trends in culinary exploration and a heightened focus on health and wellness. Growth accelerators, including technological advancements in fermentation and strategic market expansion, will continue to propel the industry forward. The increasing consumer preference for premium, artisanal, and functional soy sauce variants presents significant opportunities for product differentiation and value creation. Strategic partnerships and a commitment to sustainable practices will be crucial for sustained growth and competitive advantage in the coming years, ensuring the market reaches an estimated $21,000 million units by 2033.
Soy Products Sauces For Cooking Segmentation
-
1. Application
- 1.1. Online Sales (to C)
- 1.2. Offline Sales (to C)
- 1.3. Restaurant (to B)
- 1.4. Food Processing Plant (to B)
-
2. Type
- 2.1. Soybean Paste
- 2.2. Pea Sauce
- 2.3. Others
Soy Products Sauces For Cooking Segmentation By Geography
-
1. North America
- 1.1. United States
- 1.2. Canada
- 1.3. Mexico
-
2. South America
- 2.1. Brazil
- 2.2. Argentina
- 2.3. Rest of South America
-
3. Europe
- 3.1. United Kingdom
- 3.2. Germany
- 3.3. France
- 3.4. Italy
- 3.5. Spain
- 3.6. Russia
- 3.7. Benelux
- 3.8. Nordics
- 3.9. Rest of Europe
-
4. Middle East & Africa
- 4.1. Turkey
- 4.2. Israel
- 4.3. GCC
- 4.4. North Africa
- 4.5. South Africa
- 4.6. Rest of Middle East & Africa
-
5. Asia Pacific
- 5.1. China
- 5.2. India
- 5.3. Japan
- 5.4. South Korea
- 5.5. ASEAN
- 5.6. Oceania
- 5.7. Rest of Asia Pacific
Soy Products Sauces For Cooking Regional Market Share
Geographic Coverage of Soy Products Sauces For Cooking
Soy Products Sauces For Cooking REPORT HIGHLIGHTS
| Aspects | Details |
|---|---|
| Study Period | 2020-2034 |
| Base Year | 2025 |
| Estimated Year | 2026 |
| Forecast Period | 2026-2034 |
| Historical Period | 2020-2025 |
| Growth Rate | CAGR of 4% from 2020-2034 |
| Segmentation |
|
Table of Contents
- 1. Introduction
- 1.1. Research Scope
- 1.2. Market Segmentation
- 1.3. Research Objective
- 1.4. Definitions and Assumptions
- 2. Executive Summary
- 2.1. Market Snapshot
- 3. Market Dynamics
- 3.1. Market Drivers
- 3.2. Market Restrains
- 3.3. Market Trends
- 3.4. Market Opportunities
- 4. Market Factor Analysis
- 4.1. Porters Five Forces
- 4.1.1. Bargaining Power of Suppliers
- 4.1.2. Bargaining Power of Buyers
- 4.1.3. Threat of New Entrants
- 4.1.4. Threat of Substitutes
- 4.1.5. Competitive Rivalry
- 4.2. PESTEL analysis
- 4.3. BCG Analysis
- 4.3.1. Stars (High Growth, High Market Share)
- 4.3.2. Cash Cows (Low Growth, High Market Share)
- 4.3.3. Question Mark (High Growth, Low Market Share)
- 4.3.4. Dogs (Low Growth, Low Market Share)
- 4.4. Ansoff Matrix Analysis
- 4.5. Supply Chain Analysis
- 4.6. Regulatory Landscape
- 4.7. Current Market Potential and Opportunity Assessment (TAM–SAM–SOM Framework)
- 4.8. IMR Analyst Note
- 4.1. Porters Five Forces
- 5. Market Analysis, Insights and Forecast 2021-2033
- 5.1. Market Analysis, Insights and Forecast - by Application
- 5.1.1. Online Sales (to C)
- 5.1.2. Offline Sales (to C)
- 5.1.3. Restaurant (to B)
- 5.1.4. Food Processing Plant (to B)
- 5.2. Market Analysis, Insights and Forecast - by Type
- 5.2.1. Soybean Paste
- 5.2.2. Pea Sauce
- 5.2.3. Others
- 5.3. Market Analysis, Insights and Forecast - by Region
- 5.3.1. North America
- 5.3.2. South America
- 5.3.3. Europe
- 5.3.4. Middle East & Africa
- 5.3.5. Asia Pacific
- 5.1. Market Analysis, Insights and Forecast - by Application
- 6. Global Soy Products Sauces For Cooking Analysis, Insights and Forecast, 2021-2033
- 6.1. Market Analysis, Insights and Forecast - by Application
- 6.1.1. Online Sales (to C)
- 6.1.2. Offline Sales (to C)
- 6.1.3. Restaurant (to B)
- 6.1.4. Food Processing Plant (to B)
- 6.2. Market Analysis, Insights and Forecast - by Type
- 6.2.1. Soybean Paste
- 6.2.2. Pea Sauce
- 6.2.3. Others
- 6.1. Market Analysis, Insights and Forecast - by Application
- 7. North America Soy Products Sauces For Cooking Analysis, Insights and Forecast, 2020-2032
- 7.1. Market Analysis, Insights and Forecast - by Application
- 7.1.1. Online Sales (to C)
- 7.1.2. Offline Sales (to C)
- 7.1.3. Restaurant (to B)
- 7.1.4. Food Processing Plant (to B)
- 7.2. Market Analysis, Insights and Forecast - by Type
- 7.2.1. Soybean Paste
- 7.2.2. Pea Sauce
- 7.2.3. Others
- 7.1. Market Analysis, Insights and Forecast - by Application
- 8. South America Soy Products Sauces For Cooking Analysis, Insights and Forecast, 2020-2032
- 8.1. Market Analysis, Insights and Forecast - by Application
- 8.1.1. Online Sales (to C)
- 8.1.2. Offline Sales (to C)
- 8.1.3. Restaurant (to B)
- 8.1.4. Food Processing Plant (to B)
- 8.2. Market Analysis, Insights and Forecast - by Type
- 8.2.1. Soybean Paste
- 8.2.2. Pea Sauce
- 8.2.3. Others
- 8.1. Market Analysis, Insights and Forecast - by Application
- 9. Europe Soy Products Sauces For Cooking Analysis, Insights and Forecast, 2020-2032
- 9.1. Market Analysis, Insights and Forecast - by Application
- 9.1.1. Online Sales (to C)
- 9.1.2. Offline Sales (to C)
- 9.1.3. Restaurant (to B)
- 9.1.4. Food Processing Plant (to B)
- 9.2. Market Analysis, Insights and Forecast - by Type
- 9.2.1. Soybean Paste
- 9.2.2. Pea Sauce
- 9.2.3. Others
- 9.1. Market Analysis, Insights and Forecast - by Application
- 10. Middle East & Africa Soy Products Sauces For Cooking Analysis, Insights and Forecast, 2020-2032
- 10.1. Market Analysis, Insights and Forecast - by Application
- 10.1.1. Online Sales (to C)
- 10.1.2. Offline Sales (to C)
- 10.1.3. Restaurant (to B)
- 10.1.4. Food Processing Plant (to B)
- 10.2. Market Analysis, Insights and Forecast - by Type
- 10.2.1. Soybean Paste
- 10.2.2. Pea Sauce
- 10.2.3. Others
- 10.1. Market Analysis, Insights and Forecast - by Application
- 11. Asia Pacific Soy Products Sauces For Cooking Analysis, Insights and Forecast, 2020-2032
- 11.1. Market Analysis, Insights and Forecast - by Application
- 11.1.1. Online Sales (to C)
- 11.1.2. Offline Sales (to C)
- 11.1.3. Restaurant (to B)
- 11.1.4. Food Processing Plant (to B)
- 11.2. Market Analysis, Insights and Forecast - by Type
- 11.2.1. Soybean Paste
- 11.2.2. Pea Sauce
- 11.2.3. Others
- 11.1. Market Analysis, Insights and Forecast - by Application
- 12. Competitive Analysis
- 12.1. Company Profiles
- 12.1.1 Lee Kum Kee
- 12.1.1.1. Company Overview
- 12.1.1.2. Products
- 12.1.1.3. Company Financials
- 12.1.1.4. SWOT Analysis
- 12.1.2 Foshan Haitian Flavouring and Food Company
- 12.1.2.1. Company Overview
- 12.1.2.2. Products
- 12.1.2.3. Company Financials
- 12.1.2.4. SWOT Analysis
- 12.1.3 Shanghai Totole
- 12.1.3.1. Company Overview
- 12.1.3.2. Products
- 12.1.3.3. Company Financials
- 12.1.3.4. SWOT Analysis
- 12.1.4 Nihon Shokuken
- 12.1.4.1. Company Overview
- 12.1.4.2. Products
- 12.1.4.3. Company Financials
- 12.1.4.4. SWOT Analysis
- 12.1.5 Kikkoman
- 12.1.5.1. Company Overview
- 12.1.5.2. Products
- 12.1.5.3. Company Financials
- 12.1.5.4. SWOT Analysis
- 12.1.6 Lao Gan Ma
- 12.1.6.1. Company Overview
- 12.1.6.2. Products
- 12.1.6.3. Company Financials
- 12.1.6.4. SWOT Analysis
- 12.1.7 Yihai International
- 12.1.7.1. Company Overview
- 12.1.7.2. Products
- 12.1.7.3. Company Financials
- 12.1.7.4. SWOT Analysis
- 12.1.8 Teway Food
- 12.1.8.1. Company Overview
- 12.1.8.2. Products
- 12.1.8.3. Company Financials
- 12.1.8.4. SWOT Analysis
- 12.1.9 Kewpie Food
- 12.1.9.1. Company Overview
- 12.1.9.2. Products
- 12.1.9.3. Company Financials
- 12.1.9.4. SWOT Analysis
- 12.1.10 House Foods
- 12.1.10.1. Company Overview
- 12.1.10.2. Products
- 12.1.10.3. Company Financials
- 12.1.10.4. SWOT Analysis
- 12.1.11 Ajinomoto
- 12.1.11.1. Company Overview
- 12.1.11.2. Products
- 12.1.11.3. Company Financials
- 12.1.11.4. SWOT Analysis
- 12.1.12 Zhumadian Wangshouyi Multi-Flavoured Spice Group
- 12.1.12.1. Company Overview
- 12.1.12.2. Products
- 12.1.12.3. Company Financials
- 12.1.12.4. SWOT Analysis
- 12.1.1 Lee Kum Kee
- 12.2. Market Entropy
- 12.2.1 Company's Key Areas Served
- 12.2.2 Recent Developments
- 12.3. Company Market Share Analysis 2025
- 12.3.1 Top 5 Companies Market Share Analysis
- 12.3.2 Top 3 Companies Market Share Analysis
- 12.4. List of Potential Customers
- 13. Research Methodology
List of Figures
- Figure 1: Global Soy Products Sauces For Cooking Revenue Breakdown (million, %) by Region 2025 & 2033
- Figure 2: Global Soy Products Sauces For Cooking Volume Breakdown (K, %) by Region 2025 & 2033
- Figure 3: North America Soy Products Sauces For Cooking Revenue (million), by Application 2025 & 2033
- Figure 4: North America Soy Products Sauces For Cooking Volume (K), by Application 2025 & 2033
- Figure 5: North America Soy Products Sauces For Cooking Revenue Share (%), by Application 2025 & 2033
- Figure 6: North America Soy Products Sauces For Cooking Volume Share (%), by Application 2025 & 2033
- Figure 7: North America Soy Products Sauces For Cooking Revenue (million), by Type 2025 & 2033
- Figure 8: North America Soy Products Sauces For Cooking Volume (K), by Type 2025 & 2033
- Figure 9: North America Soy Products Sauces For Cooking Revenue Share (%), by Type 2025 & 2033
- Figure 10: North America Soy Products Sauces For Cooking Volume Share (%), by Type 2025 & 2033
- Figure 11: North America Soy Products Sauces For Cooking Revenue (million), by Country 2025 & 2033
- Figure 12: North America Soy Products Sauces For Cooking Volume (K), by Country 2025 & 2033
- Figure 13: North America Soy Products Sauces For Cooking Revenue Share (%), by Country 2025 & 2033
- Figure 14: North America Soy Products Sauces For Cooking Volume Share (%), by Country 2025 & 2033
- Figure 15: South America Soy Products Sauces For Cooking Revenue (million), by Application 2025 & 2033
- Figure 16: South America Soy Products Sauces For Cooking Volume (K), by Application 2025 & 2033
- Figure 17: South America Soy Products Sauces For Cooking Revenue Share (%), by Application 2025 & 2033
- Figure 18: South America Soy Products Sauces For Cooking Volume Share (%), by Application 2025 & 2033
- Figure 19: South America Soy Products Sauces For Cooking Revenue (million), by Type 2025 & 2033
- Figure 20: South America Soy Products Sauces For Cooking Volume (K), by Type 2025 & 2033
- Figure 21: South America Soy Products Sauces For Cooking Revenue Share (%), by Type 2025 & 2033
- Figure 22: South America Soy Products Sauces For Cooking Volume Share (%), by Type 2025 & 2033
- Figure 23: South America Soy Products Sauces For Cooking Revenue (million), by Country 2025 & 2033
- Figure 24: South America Soy Products Sauces For Cooking Volume (K), by Country 2025 & 2033
- Figure 25: South America Soy Products Sauces For Cooking Revenue Share (%), by Country 2025 & 2033
- Figure 26: South America Soy Products Sauces For Cooking Volume Share (%), by Country 2025 & 2033
- Figure 27: Europe Soy Products Sauces For Cooking Revenue (million), by Application 2025 & 2033
- Figure 28: Europe Soy Products Sauces For Cooking Volume (K), by Application 2025 & 2033
- Figure 29: Europe Soy Products Sauces For Cooking Revenue Share (%), by Application 2025 & 2033
- Figure 30: Europe Soy Products Sauces For Cooking Volume Share (%), by Application 2025 & 2033
- Figure 31: Europe Soy Products Sauces For Cooking Revenue (million), by Type 2025 & 2033
- Figure 32: Europe Soy Products Sauces For Cooking Volume (K), by Type 2025 & 2033
- Figure 33: Europe Soy Products Sauces For Cooking Revenue Share (%), by Type 2025 & 2033
- Figure 34: Europe Soy Products Sauces For Cooking Volume Share (%), by Type 2025 & 2033
- Figure 35: Europe Soy Products Sauces For Cooking Revenue (million), by Country 2025 & 2033
- Figure 36: Europe Soy Products Sauces For Cooking Volume (K), by Country 2025 & 2033
- Figure 37: Europe Soy Products Sauces For Cooking Revenue Share (%), by Country 2025 & 2033
- Figure 38: Europe Soy Products Sauces For Cooking Volume Share (%), by Country 2025 & 2033
- Figure 39: Middle East & Africa Soy Products Sauces For Cooking Revenue (million), by Application 2025 & 2033
- Figure 40: Middle East & Africa Soy Products Sauces For Cooking Volume (K), by Application 2025 & 2033
- Figure 41: Middle East & Africa Soy Products Sauces For Cooking Revenue Share (%), by Application 2025 & 2033
- Figure 42: Middle East & Africa Soy Products Sauces For Cooking Volume Share (%), by Application 2025 & 2033
- Figure 43: Middle East & Africa Soy Products Sauces For Cooking Revenue (million), by Type 2025 & 2033
- Figure 44: Middle East & Africa Soy Products Sauces For Cooking Volume (K), by Type 2025 & 2033
- Figure 45: Middle East & Africa Soy Products Sauces For Cooking Revenue Share (%), by Type 2025 & 2033
- Figure 46: Middle East & Africa Soy Products Sauces For Cooking Volume Share (%), by Type 2025 & 2033
- Figure 47: Middle East & Africa Soy Products Sauces For Cooking Revenue (million), by Country 2025 & 2033
- Figure 48: Middle East & Africa Soy Products Sauces For Cooking Volume (K), by Country 2025 & 2033
- Figure 49: Middle East & Africa Soy Products Sauces For Cooking Revenue Share (%), by Country 2025 & 2033
- Figure 50: Middle East & Africa Soy Products Sauces For Cooking Volume Share (%), by Country 2025 & 2033
- Figure 51: Asia Pacific Soy Products Sauces For Cooking Revenue (million), by Application 2025 & 2033
- Figure 52: Asia Pacific Soy Products Sauces For Cooking Volume (K), by Application 2025 & 2033
- Figure 53: Asia Pacific Soy Products Sauces For Cooking Revenue Share (%), by Application 2025 & 2033
- Figure 54: Asia Pacific Soy Products Sauces For Cooking Volume Share (%), by Application 2025 & 2033
- Figure 55: Asia Pacific Soy Products Sauces For Cooking Revenue (million), by Type 2025 & 2033
- Figure 56: Asia Pacific Soy Products Sauces For Cooking Volume (K), by Type 2025 & 2033
- Figure 57: Asia Pacific Soy Products Sauces For Cooking Revenue Share (%), by Type 2025 & 2033
- Figure 58: Asia Pacific Soy Products Sauces For Cooking Volume Share (%), by Type 2025 & 2033
- Figure 59: Asia Pacific Soy Products Sauces For Cooking Revenue (million), by Country 2025 & 2033
- Figure 60: Asia Pacific Soy Products Sauces For Cooking Volume (K), by Country 2025 & 2033
- Figure 61: Asia Pacific Soy Products Sauces For Cooking Revenue Share (%), by Country 2025 & 2033
- Figure 62: Asia Pacific Soy Products Sauces For Cooking Volume Share (%), by Country 2025 & 2033
List of Tables
- Table 1: Global Soy Products Sauces For Cooking Revenue million Forecast, by Application 2020 & 2033
- Table 2: Global Soy Products Sauces For Cooking Volume K Forecast, by Application 2020 & 2033
- Table 3: Global Soy Products Sauces For Cooking Revenue million Forecast, by Type 2020 & 2033
- Table 4: Global Soy Products Sauces For Cooking Volume K Forecast, by Type 2020 & 2033
- Table 5: Global Soy Products Sauces For Cooking Revenue million Forecast, by Region 2020 & 2033
- Table 6: Global Soy Products Sauces For Cooking Volume K Forecast, by Region 2020 & 2033
- Table 7: Global Soy Products Sauces For Cooking Revenue million Forecast, by Application 2020 & 2033
- Table 8: Global Soy Products Sauces For Cooking Volume K Forecast, by Application 2020 & 2033
- Table 9: Global Soy Products Sauces For Cooking Revenue million Forecast, by Type 2020 & 2033
- Table 10: Global Soy Products Sauces For Cooking Volume K Forecast, by Type 2020 & 2033
- Table 11: Global Soy Products Sauces For Cooking Revenue million Forecast, by Country 2020 & 2033
- Table 12: Global Soy Products Sauces For Cooking Volume K Forecast, by Country 2020 & 2033
- Table 13: United States Soy Products Sauces For Cooking Revenue (million) Forecast, by Application 2020 & 2033
- Table 14: United States Soy Products Sauces For Cooking Volume (K) Forecast, by Application 2020 & 2033
- Table 15: Canada Soy Products Sauces For Cooking Revenue (million) Forecast, by Application 2020 & 2033
- Table 16: Canada Soy Products Sauces For Cooking Volume (K) Forecast, by Application 2020 & 2033
- Table 17: Mexico Soy Products Sauces For Cooking Revenue (million) Forecast, by Application 2020 & 2033
- Table 18: Mexico Soy Products Sauces For Cooking Volume (K) Forecast, by Application 2020 & 2033
- Table 19: Global Soy Products Sauces For Cooking Revenue million Forecast, by Application 2020 & 2033
- Table 20: Global Soy Products Sauces For Cooking Volume K Forecast, by Application 2020 & 2033
- Table 21: Global Soy Products Sauces For Cooking Revenue million Forecast, by Type 2020 & 2033
- Table 22: Global Soy Products Sauces For Cooking Volume K Forecast, by Type 2020 & 2033
- Table 23: Global Soy Products Sauces For Cooking Revenue million Forecast, by Country 2020 & 2033
- Table 24: Global Soy Products Sauces For Cooking Volume K Forecast, by Country 2020 & 2033
- Table 25: Brazil Soy Products Sauces For Cooking Revenue (million) Forecast, by Application 2020 & 2033
- Table 26: Brazil Soy Products Sauces For Cooking Volume (K) Forecast, by Application 2020 & 2033
- Table 27: Argentina Soy Products Sauces For Cooking Revenue (million) Forecast, by Application 2020 & 2033
- Table 28: Argentina Soy Products Sauces For Cooking Volume (K) Forecast, by Application 2020 & 2033
- Table 29: Rest of South America Soy Products Sauces For Cooking Revenue (million) Forecast, by Application 2020 & 2033
- Table 30: Rest of South America Soy Products Sauces For Cooking Volume (K) Forecast, by Application 2020 & 2033
- Table 31: Global Soy Products Sauces For Cooking Revenue million Forecast, by Application 2020 & 2033
- Table 32: Global Soy Products Sauces For Cooking Volume K Forecast, by Application 2020 & 2033
- Table 33: Global Soy Products Sauces For Cooking Revenue million Forecast, by Type 2020 & 2033
- Table 34: Global Soy Products Sauces For Cooking Volume K Forecast, by Type 2020 & 2033
- Table 35: Global Soy Products Sauces For Cooking Revenue million Forecast, by Country 2020 & 2033
- Table 36: Global Soy Products Sauces For Cooking Volume K Forecast, by Country 2020 & 2033
- Table 37: United Kingdom Soy Products Sauces For Cooking Revenue (million) Forecast, by Application 2020 & 2033
- Table 38: United Kingdom Soy Products Sauces For Cooking Volume (K) Forecast, by Application 2020 & 2033
- Table 39: Germany Soy Products Sauces For Cooking Revenue (million) Forecast, by Application 2020 & 2033
- Table 40: Germany Soy Products Sauces For Cooking Volume (K) Forecast, by Application 2020 & 2033
- Table 41: France Soy Products Sauces For Cooking Revenue (million) Forecast, by Application 2020 & 2033
- Table 42: France Soy Products Sauces For Cooking Volume (K) Forecast, by Application 2020 & 2033
- Table 43: Italy Soy Products Sauces For Cooking Revenue (million) Forecast, by Application 2020 & 2033
- Table 44: Italy Soy Products Sauces For Cooking Volume (K) Forecast, by Application 2020 & 2033
- Table 45: Spain Soy Products Sauces For Cooking Revenue (million) Forecast, by Application 2020 & 2033
- Table 46: Spain Soy Products Sauces For Cooking Volume (K) Forecast, by Application 2020 & 2033
- Table 47: Russia Soy Products Sauces For Cooking Revenue (million) Forecast, by Application 2020 & 2033
- Table 48: Russia Soy Products Sauces For Cooking Volume (K) Forecast, by Application 2020 & 2033
- Table 49: Benelux Soy Products Sauces For Cooking Revenue (million) Forecast, by Application 2020 & 2033
- Table 50: Benelux Soy Products Sauces For Cooking Volume (K) Forecast, by Application 2020 & 2033
- Table 51: Nordics Soy Products Sauces For Cooking Revenue (million) Forecast, by Application 2020 & 2033
- Table 52: Nordics Soy Products Sauces For Cooking Volume (K) Forecast, by Application 2020 & 2033
- Table 53: Rest of Europe Soy Products Sauces For Cooking Revenue (million) Forecast, by Application 2020 & 2033
- Table 54: Rest of Europe Soy Products Sauces For Cooking Volume (K) Forecast, by Application 2020 & 2033
- Table 55: Global Soy Products Sauces For Cooking Revenue million Forecast, by Application 2020 & 2033
- Table 56: Global Soy Products Sauces For Cooking Volume K Forecast, by Application 2020 & 2033
- Table 57: Global Soy Products Sauces For Cooking Revenue million Forecast, by Type 2020 & 2033
- Table 58: Global Soy Products Sauces For Cooking Volume K Forecast, by Type 2020 & 2033
- Table 59: Global Soy Products Sauces For Cooking Revenue million Forecast, by Country 2020 & 2033
- Table 60: Global Soy Products Sauces For Cooking Volume K Forecast, by Country 2020 & 2033
- Table 61: Turkey Soy Products Sauces For Cooking Revenue (million) Forecast, by Application 2020 & 2033
- Table 62: Turkey Soy Products Sauces For Cooking Volume (K) Forecast, by Application 2020 & 2033
- Table 63: Israel Soy Products Sauces For Cooking Revenue (million) Forecast, by Application 2020 & 2033
- Table 64: Israel Soy Products Sauces For Cooking Volume (K) Forecast, by Application 2020 & 2033
- Table 65: GCC Soy Products Sauces For Cooking Revenue (million) Forecast, by Application 2020 & 2033
- Table 66: GCC Soy Products Sauces For Cooking Volume (K) Forecast, by Application 2020 & 2033
- Table 67: North Africa Soy Products Sauces For Cooking Revenue (million) Forecast, by Application 2020 & 2033
- Table 68: North Africa Soy Products Sauces For Cooking Volume (K) Forecast, by Application 2020 & 2033
- Table 69: South Africa Soy Products Sauces For Cooking Revenue (million) Forecast, by Application 2020 & 2033
- Table 70: South Africa Soy Products Sauces For Cooking Volume (K) Forecast, by Application 2020 & 2033
- Table 71: Rest of Middle East & Africa Soy Products Sauces For Cooking Revenue (million) Forecast, by Application 2020 & 2033
- Table 72: Rest of Middle East & Africa Soy Products Sauces For Cooking Volume (K) Forecast, by Application 2020 & 2033
- Table 73: Global Soy Products Sauces For Cooking Revenue million Forecast, by Application 2020 & 2033
- Table 74: Global Soy Products Sauces For Cooking Volume K Forecast, by Application 2020 & 2033
- Table 75: Global Soy Products Sauces For Cooking Revenue million Forecast, by Type 2020 & 2033
- Table 76: Global Soy Products Sauces For Cooking Volume K Forecast, by Type 2020 & 2033
- Table 77: Global Soy Products Sauces For Cooking Revenue million Forecast, by Country 2020 & 2033
- Table 78: Global Soy Products Sauces For Cooking Volume K Forecast, by Country 2020 & 2033
- Table 79: China Soy Products Sauces For Cooking Revenue (million) Forecast, by Application 2020 & 2033
- Table 80: China Soy Products Sauces For Cooking Volume (K) Forecast, by Application 2020 & 2033
- Table 81: India Soy Products Sauces For Cooking Revenue (million) Forecast, by Application 2020 & 2033
- Table 82: India Soy Products Sauces For Cooking Volume (K) Forecast, by Application 2020 & 2033
- Table 83: Japan Soy Products Sauces For Cooking Revenue (million) Forecast, by Application 2020 & 2033
- Table 84: Japan Soy Products Sauces For Cooking Volume (K) Forecast, by Application 2020 & 2033
- Table 85: South Korea Soy Products Sauces For Cooking Revenue (million) Forecast, by Application 2020 & 2033
- Table 86: South Korea Soy Products Sauces For Cooking Volume (K) Forecast, by Application 2020 & 2033
- Table 87: ASEAN Soy Products Sauces For Cooking Revenue (million) Forecast, by Application 2020 & 2033
- Table 88: ASEAN Soy Products Sauces For Cooking Volume (K) Forecast, by Application 2020 & 2033
- Table 89: Oceania Soy Products Sauces For Cooking Revenue (million) Forecast, by Application 2020 & 2033
- Table 90: Oceania Soy Products Sauces For Cooking Volume (K) Forecast, by Application 2020 & 2033
- Table 91: Rest of Asia Pacific Soy Products Sauces For Cooking Revenue (million) Forecast, by Application 2020 & 2033
- Table 92: Rest of Asia Pacific Soy Products Sauces For Cooking Volume (K) Forecast, by Application 2020 & 2033
Frequently Asked Questions
1. What is the projected Compound Annual Growth Rate (CAGR) of the Soy Products Sauces For Cooking?
The projected CAGR is approximately 4%.
2. Which companies are prominent players in the Soy Products Sauces For Cooking?
Key companies in the market include Lee Kum Kee, Foshan Haitian Flavouring and Food Company, Shanghai Totole, Nihon Shokuken, Kikkoman, Lao Gan Ma, Yihai International, Teway Food, Kewpie Food, House Foods, Ajinomoto, Zhumadian Wangshouyi Multi-Flavoured Spice Group.
3. What are the main segments of the Soy Products Sauces For Cooking?
The market segments include Application, Type.
4. Can you provide details about the market size?
The market size is estimated to be USD 777 million as of 2022.
5. What are some drivers contributing to market growth?
N/A
6. What are the notable trends driving market growth?
N/A
7. Are there any restraints impacting market growth?
N/A
8. Can you provide examples of recent developments in the market?
N/A
9. What pricing options are available for accessing the report?
Pricing options include single-user, multi-user, and enterprise licenses priced at USD 3950.00, USD 5925.00, and USD 7900.00 respectively.
10. Is the market size provided in terms of value or volume?
The market size is provided in terms of value, measured in million and volume, measured in K.
11. Are there any specific market keywords associated with the report?
Yes, the market keyword associated with the report is "Soy Products Sauces For Cooking," which aids in identifying and referencing the specific market segment covered.
12. How do I determine which pricing option suits my needs best?
The pricing options vary based on user requirements and access needs. Individual users may opt for single-user licenses, while businesses requiring broader access may choose multi-user or enterprise licenses for cost-effective access to the report.
13. Are there any additional resources or data provided in the Soy Products Sauces For Cooking report?
While the report offers comprehensive insights, it's advisable to review the specific contents or supplementary materials provided to ascertain if additional resources or data are available.
14. How can I stay updated on further developments or reports in the Soy Products Sauces For Cooking?
To stay informed about further developments, trends, and reports in the Soy Products Sauces For Cooking, consider subscribing to industry newsletters, following relevant companies and organizations, or regularly checking reputable industry news sources and publications.
Methodology
Step 1 - Identification of Relevant Samples Size from Population Database


Step 2 - Approaches for Defining Global Market Size (Value, Volume* & Price*)

Note*: In applicable scenarios
Step 3 - Data Sources
Primary Research
- Web Analytics
- Survey Reports
- Research Institute
- Latest Research Reports
- Opinion Leaders
Secondary Research
- Annual Reports
- White Paper
- Latest Press Release
- Industry Association
- Paid Database
- Investor Presentations

Step 4 - Data Triangulation
Involves using different sources of information in order to increase the validity of a study
These sources are likely to be stakeholders in a program - participants, other researchers, program staff, other community members, and so on.
Then we put all data in single framework & apply various statistical tools to find out the dynamic on the market.
During the analysis stage, feedback from the stakeholder groups would be compared to determine areas of agreement as well as areas of divergence