

Key Insights
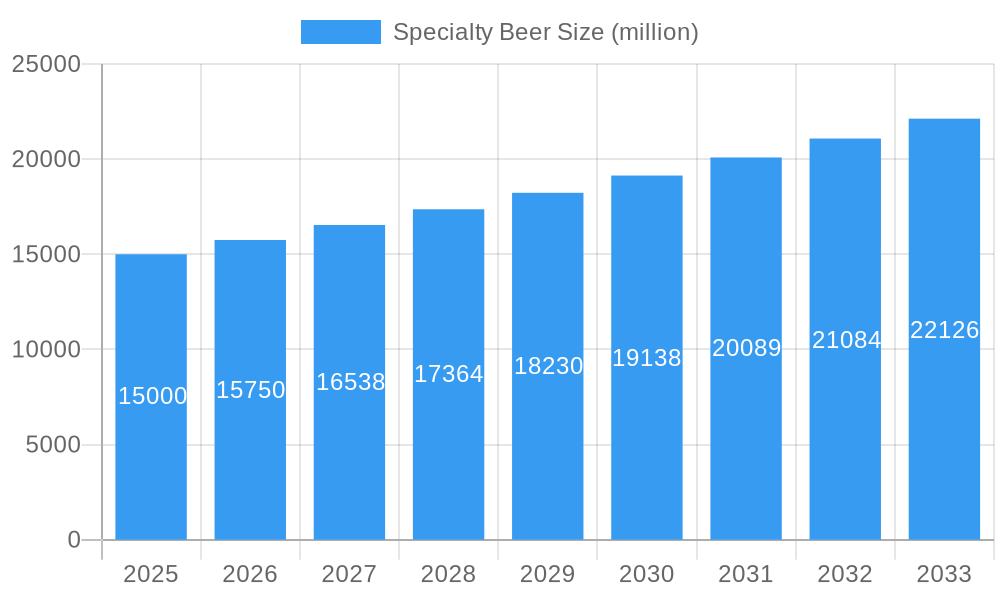
The specialty beer market, encompassing craft brews and unique imported varieties, is experiencing robust growth, driven by increasing consumer demand for high-quality, flavorful, and distinctive beers. This preference for artisanal and experimental brewing styles is fueling expansion across diverse segments, including India Pale Ales (IPAs), stouts, sours, and other niche offerings. The market's expansion is further propelled by the growing popularity of craft breweries, which are often characterized by their commitment to local sourcing, sustainable practices, and community engagement. This resonates strongly with consumers seeking authenticity and unique brand experiences. The established players, such as Yuengling, Boston Beer, and Anheuser-Busch InBev, are strategically navigating this landscape by acquiring craft breweries and introducing innovative products, while smaller, independent brewers are benefiting from increased consumer awareness and niche market opportunities. However, competition remains intense, requiring continuous innovation and targeted marketing to capture consumer attention within an increasingly crowded market. Distribution challenges, especially for smaller regional breweries, and potential regulatory hurdles can also act as restraints. We estimate the 2025 market size to be $15 billion, with a compound annual growth rate (CAGR) of 5% projected through 2033, resulting in a market value exceeding $23 billion by the end of the forecast period.
Specialty Beer Market Size (In Billion)
The specialty beer market's segmentation extends beyond style to encompass packaging (bottles, cans, kegs), distribution channels (on-premise, off-premise), and price points (premium, super-premium). Regional variations exist, with North America and Europe currently dominating the market. However, emerging markets in Asia and Latin America demonstrate significant potential for future growth driven by rising disposable incomes and evolving consumer preferences. Successful players are adept at leveraging digital marketing and social media engagement to reach their target audiences. Sustainability concerns also play a significant role, with environmentally conscious consumers favouring breweries with transparent and responsible practices. The competitive landscape is dynamic, with mergers and acquisitions, brand extensions, and new product launches constantly reshaping the market structure. Maintaining a strong brand identity, focusing on product quality and innovation, and building direct consumer relationships are crucial for sustained success in this competitive sector.
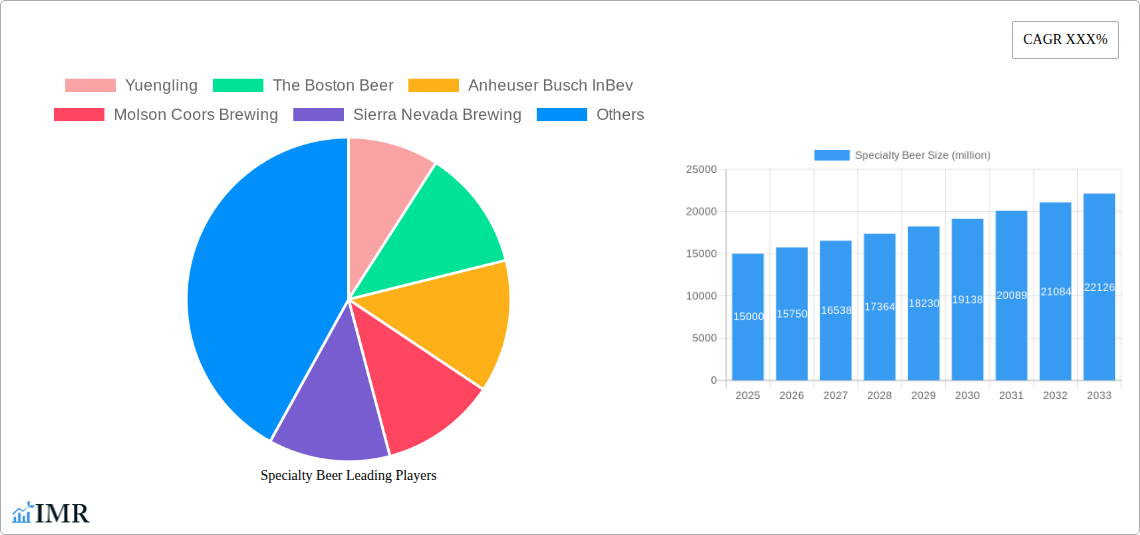
Specialty Beer Company Market Share
Specialty Beer Market Report: 2019-2033
This comprehensive report provides an in-depth analysis of the specialty beer market, encompassing market dynamics, growth trends, regional dominance, product landscape, key players, and future outlook. With a focus on the parent market (alcoholic beverages) and child market (craft beer), this report is essential for industry professionals seeking to understand and capitalize on opportunities within this dynamic sector. The report covers the period 2019-2033, with a base year of 2025 and a forecast period of 2025-2033. Market values are presented in millions of units.
Specialty Beer Market Dynamics & Structure
The specialty beer market is characterized by moderate concentration, with key players like Anheuser-Busch InBev and Molson Coors Brewing holding significant shares, alongside numerous smaller, regional craft brewers. Technological innovation, particularly in brewing techniques and packaging, is a key driver, alongside evolving consumer preferences towards premium and unique flavor profiles. Regulatory frameworks concerning alcohol content, labeling, and distribution vary across regions, creating both opportunities and challenges. Competitive substitutes include other alcoholic beverages (wine, spirits) and non-alcoholic alternatives. The market demonstrates a diverse end-user demographic, ranging from young adults to older connoisseurs. M&A activity has been significant, with larger breweries acquiring smaller craft brewers to expand their portfolio and market reach. This activity is projected to reach xx million deals over the forecast period.
- Market Concentration: Highly fragmented, with top 5 players holding approximately xx% market share in 2025.
- Innovation Drivers: New brewing techniques (e.g., sour beers, barrel-aging), sustainable packaging, and personalized brewing experiences.
- Regulatory Landscape: Varied across regions; compliance costs can be significant, particularly for smaller breweries.
- Competitive Substitutes: Wine, spirits, ready-to-drink cocktails, and non-alcoholic beverages.
- End-User Demographics: Millennials and Gen Z represent significant growth segments, driven by their preference for unique and high-quality products.
- M&A Trends: Increasing consolidation, with larger companies acquiring smaller craft brewers to gain market share and expand their product portfolios.
Specialty Beer Growth Trends & Insights
The specialty beer market experienced significant growth during the historical period (2019-2024), driven by increasing consumer demand for premium and craft beers. The market size is estimated to be xx million units in 2025, with a compound annual growth rate (CAGR) of xx% projected from 2025 to 2033. This growth is fueled by several factors including changing consumer preferences, rising disposable incomes, particularly in emerging markets, and the growing popularity of specialty beer festivals and events. Technological disruptions, such as the introduction of innovative brewing technologies and personalized brewing experiences, further contribute to market expansion. Consumer behavior shifts show an increasing preference for high-quality, locally sourced ingredients and environmentally friendly packaging.
Dominant Regions, Countries, or Segments in Specialty Beer
The North American market (primarily the US) continues to dominate the specialty beer market, fueled by strong consumer demand, a vibrant craft brewing scene, and well-established distribution networks. Europe holds a significant share as well, with established craft beer markets in the UK and Belgium. Growth in Asia-Pacific is projected to be significant over the forecast period, driven by rising disposable incomes and changing consumer preferences.
- Key Drivers (North America): Strong craft beer culture, established distribution channels, high disposable incomes, and robust marketing and promotional activities.
- Key Drivers (Europe): Long-standing beer brewing traditions, high consumer awareness and acceptance of specialty beers, and supportive regulatory environments in specific countries.
- Key Drivers (Asia-Pacific): Rising middle class, increasing disposable incomes, and growing interest in Western-style craft beers.
Specialty Beer Product Landscape
The specialty beer market showcases a diverse product landscape, encompassing a wide range of styles, flavors, and brewing techniques. Innovation extends to unique ingredient combinations, barrel-aging processes, and sustainable packaging solutions. Key trends include the rising popularity of IPAs, sours, stouts, and lagers. Many breweries emphasize unique selling propositions based on locally sourced ingredients, sustainable practices, and distinctive brewing techniques. Technological advancements in brewing and packaging have improved product quality, consistency, and shelf life.
Key Drivers, Barriers & Challenges in Specialty Beer
Key Drivers:
- Increasing consumer demand for premium and craft beers.
- Growing disposable incomes in emerging markets.
- Technological innovation in brewing and packaging.
- Rising popularity of specialty beer events and festivals.
Challenges & Restraints:
- Intense competition from established and emerging players.
- High production costs and stringent regulatory requirements.
- Supply chain disruptions impacting ingredient availability and distribution.
- Fluctuations in raw material prices and energy costs. These fluctuations negatively impacted the market by xx% in 2024.
Emerging Opportunities in Specialty Beer
- Expanding into untapped markets, particularly in emerging economies.
- Leveraging e-commerce and online platforms for direct-to-consumer sales.
- Development of innovative product formats, such as ready-to-drink canned cocktails and alcoholic sparkling waters.
- Personalized brewing experiences and customization options for consumers.
Growth Accelerators in the Specialty Beer Industry
Strategic partnerships and collaborations between large brewers and craft brewers can accelerate market growth. Technological advancements in brewing and packaging, along with marketing and distribution strategies, will also drive growth. Expansion into new markets, particularly those with growing middle classes, offers significant potential for increased market penetration.
Key Players Shaping the Specialty Beer Market
Notable Milestones in Specialty Beer Sector
- 2020: Increased demand for at-home consumption during the pandemic.
- 2021: Several large breweries launched new craft beer brands to capture market share.
- 2022: Significant investment in sustainable packaging solutions by key players.
- 2023: Growing adoption of direct-to-consumer sales models by smaller breweries.
In-Depth Specialty Beer Market Outlook
The specialty beer market is poised for continued growth over the forecast period, driven by a combination of factors including rising consumer demand, product innovation, and strategic investments by key players. The market will likely see further consolidation through mergers and acquisitions, as well as an increased focus on sustainability and ethical sourcing. New product formats and emerging markets will offer significant opportunities for growth and market expansion. The ongoing focus on improving brewing efficiency and distribution strategies will be crucial for success in the coming years.
Specialty Beer Segmentation
-
1. Application
- 1.1. Bar
- 1.2. Food Service
- 1.3. Retail
-
2. Type
- 2.1. Smoked Beers
- 2.2. Herb and Spice Beers
- 2.3. Fruit Beers
- 2.4. Others
Specialty Beer Segmentation By Geography
-
1. North America
- 1.1. United States
- 1.2. Canada
- 1.3. Mexico
-
2. South America
- 2.1. Brazil
- 2.2. Argentina
- 2.3. Rest of South America
-
3. Europe
- 3.1. United Kingdom
- 3.2. Germany
- 3.3. France
- 3.4. Italy
- 3.5. Spain
- 3.6. Russia
- 3.7. Benelux
- 3.8. Nordics
- 3.9. Rest of Europe
-
4. Middle East & Africa
- 4.1. Turkey
- 4.2. Israel
- 4.3. GCC
- 4.4. North Africa
- 4.5. South Africa
- 4.6. Rest of Middle East & Africa
-
5. Asia Pacific
- 5.1. China
- 5.2. India
- 5.3. Japan
- 5.4. South Korea
- 5.5. ASEAN
- 5.6. Oceania
- 5.7. Rest of Asia Pacific
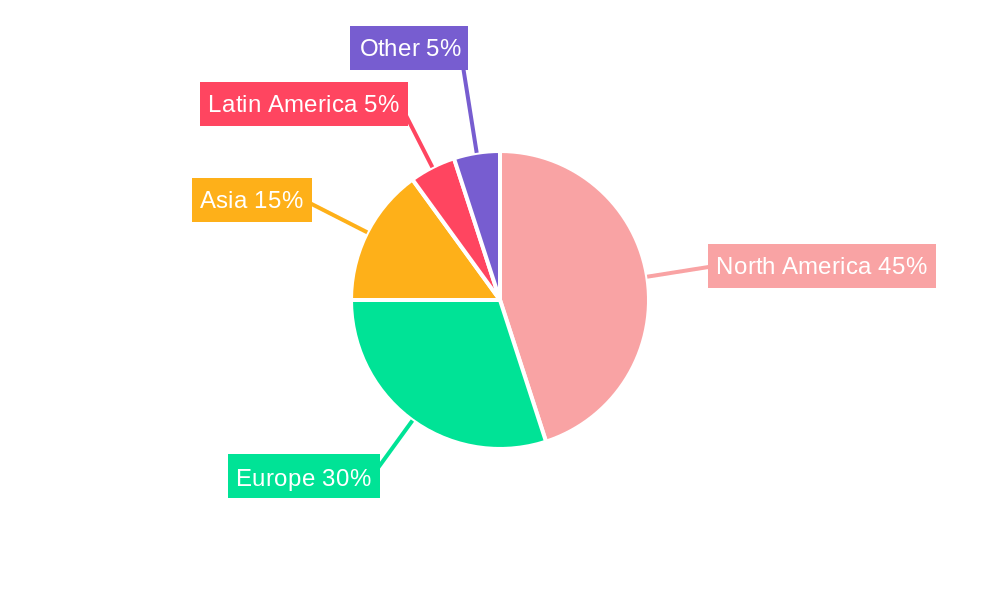
Specialty Beer Regional Market Share
Geographic Coverage of Specialty Beer
Specialty Beer REPORT HIGHLIGHTS
| Aspects | Details |
|---|---|
| Study Period | 2020-2034 |
| Base Year | 2025 |
| Estimated Year | 2026 |
| Forecast Period | 2026-2034 |
| Historical Period | 2020-2025 |
| Growth Rate | CAGR of 4.4% from 2020-2034 |
| Segmentation |
|
Table of Contents
- 1. Introduction
- 1.1. Research Scope
- 1.2. Market Segmentation
- 1.3. Research Objective
- 1.4. Definitions and Assumptions
- 2. Executive Summary
- 2.1. Market Snapshot
- 3. Market Dynamics
- 3.1. Market Drivers
- 3.2. Market Restrains
- 3.3. Market Trends
- 3.4. Market Opportunities
- 4. Market Factor Analysis
- 4.1. Porters Five Forces
- 4.1.1. Bargaining Power of Suppliers
- 4.1.2. Bargaining Power of Buyers
- 4.1.3. Threat of New Entrants
- 4.1.4. Threat of Substitutes
- 4.1.5. Competitive Rivalry
- 4.2. PESTEL analysis
- 4.3. BCG Analysis
- 4.3.1. Stars (High Growth, High Market Share)
- 4.3.2. Cash Cows (Low Growth, High Market Share)
- 4.3.3. Question Mark (High Growth, Low Market Share)
- 4.3.4. Dogs (Low Growth, Low Market Share)
- 4.4. Ansoff Matrix Analysis
- 4.5. Supply Chain Analysis
- 4.6. Regulatory Landscape
- 4.7. Current Market Potential and Opportunity Assessment (TAM–SAM–SOM Framework)
- 4.8. IMR Analyst Note
- 4.1. Porters Five Forces
- 5. Market Analysis, Insights and Forecast 2021-2033
- 5.1. Market Analysis, Insights and Forecast - by Application
- 5.1.1. Bar
- 5.1.2. Food Service
- 5.1.3. Retail
- 5.2. Market Analysis, Insights and Forecast - by Type
- 5.2.1. Smoked Beers
- 5.2.2. Herb and Spice Beers
- 5.2.3. Fruit Beers
- 5.2.4. Others
- 5.3. Market Analysis, Insights and Forecast - by Region
- 5.3.1. North America
- 5.3.2. South America
- 5.3.3. Europe
- 5.3.4. Middle East & Africa
- 5.3.5. Asia Pacific
- 5.1. Market Analysis, Insights and Forecast - by Application
- 6. Global Specialty Beer Analysis, Insights and Forecast, 2021-2033
- 6.1. Market Analysis, Insights and Forecast - by Application
- 6.1.1. Bar
- 6.1.2. Food Service
- 6.1.3. Retail
- 6.2. Market Analysis, Insights and Forecast - by Type
- 6.2.1. Smoked Beers
- 6.2.2. Herb and Spice Beers
- 6.2.3. Fruit Beers
- 6.2.4. Others
- 6.1. Market Analysis, Insights and Forecast - by Application
- 7. North America Specialty Beer Analysis, Insights and Forecast, 2020-2032
- 7.1. Market Analysis, Insights and Forecast - by Application
- 7.1.1. Bar
- 7.1.2. Food Service
- 7.1.3. Retail
- 7.2. Market Analysis, Insights and Forecast - by Type
- 7.2.1. Smoked Beers
- 7.2.2. Herb and Spice Beers
- 7.2.3. Fruit Beers
- 7.2.4. Others
- 7.1. Market Analysis, Insights and Forecast - by Application
- 8. South America Specialty Beer Analysis, Insights and Forecast, 2020-2032
- 8.1. Market Analysis, Insights and Forecast - by Application
- 8.1.1. Bar
- 8.1.2. Food Service
- 8.1.3. Retail
- 8.2. Market Analysis, Insights and Forecast - by Type
- 8.2.1. Smoked Beers
- 8.2.2. Herb and Spice Beers
- 8.2.3. Fruit Beers
- 8.2.4. Others
- 8.1. Market Analysis, Insights and Forecast - by Application
- 9. Europe Specialty Beer Analysis, Insights and Forecast, 2020-2032
- 9.1. Market Analysis, Insights and Forecast - by Application
- 9.1.1. Bar
- 9.1.2. Food Service
- 9.1.3. Retail
- 9.2. Market Analysis, Insights and Forecast - by Type
- 9.2.1. Smoked Beers
- 9.2.2. Herb and Spice Beers
- 9.2.3. Fruit Beers
- 9.2.4. Others
- 9.1. Market Analysis, Insights and Forecast - by Application
- 10. Middle East & Africa Specialty Beer Analysis, Insights and Forecast, 2020-2032
- 10.1. Market Analysis, Insights and Forecast - by Application
- 10.1.1. Bar
- 10.1.2. Food Service
- 10.1.3. Retail
- 10.2. Market Analysis, Insights and Forecast - by Type
- 10.2.1. Smoked Beers
- 10.2.2. Herb and Spice Beers
- 10.2.3. Fruit Beers
- 10.2.4. Others
- 10.1. Market Analysis, Insights and Forecast - by Application
- 11. Asia Pacific Specialty Beer Analysis, Insights and Forecast, 2020-2032
- 11.1. Market Analysis, Insights and Forecast - by Application
- 11.1.1. Bar
- 11.1.2. Food Service
- 11.1.3. Retail
- 11.2. Market Analysis, Insights and Forecast - by Type
- 11.2.1. Smoked Beers
- 11.2.2. Herb and Spice Beers
- 11.2.3. Fruit Beers
- 11.2.4. Others
- 11.1. Market Analysis, Insights and Forecast - by Application
- 12. Competitive Analysis
- 12.1. Company Profiles
- 12.1.1 Yuengling
- 12.1.1.1. Company Overview
- 12.1.1.2. Products
- 12.1.1.3. Company Financials
- 12.1.1.4. SWOT Analysis
- 12.1.2 The Boston Beer
- 12.1.2.1. Company Overview
- 12.1.2.2. Products
- 12.1.2.3. Company Financials
- 12.1.2.4. SWOT Analysis
- 12.1.3 Anheuser Busch InBev
- 12.1.3.1. Company Overview
- 12.1.3.2. Products
- 12.1.3.3. Company Financials
- 12.1.3.4. SWOT Analysis
- 12.1.4 Molson Coors Brewing
- 12.1.4.1. Company Overview
- 12.1.4.2. Products
- 12.1.4.3. Company Financials
- 12.1.4.4. SWOT Analysis
- 12.1.5 Sierra Nevada Brewing
- 12.1.5.1. Company Overview
- 12.1.5.2. Products
- 12.1.5.3. Company Financials
- 12.1.5.4. SWOT Analysis
- 12.1.6 Bell's Brewery
- 12.1.6.1. Company Overview
- 12.1.6.2. Products
- 12.1.6.3. Company Financials
- 12.1.6.4. SWOT Analysis
- 12.1.7 Heinken Holding
- 12.1.7.1. Company Overview
- 12.1.7.2. Products
- 12.1.7.3. Company Financials
- 12.1.7.4. SWOT Analysis
- 12.1.8 Deschutes Brewery
- 12.1.8.1. Company Overview
- 12.1.8.2. Products
- 12.1.8.3. Company Financials
- 12.1.8.4. SWOT Analysis
- 12.1.9 Stone Brewing
- 12.1.9.1. Company Overview
- 12.1.9.2. Products
- 12.1.9.3. Company Financials
- 12.1.9.4. SWOT Analysis
- 12.1.10 SweetWater Brewing
- 12.1.10.1. Company Overview
- 12.1.10.2. Products
- 12.1.10.3. Company Financials
- 12.1.10.4. SWOT Analysis
- 12.1.1 Yuengling
- 12.2. Market Entropy
- 12.2.1 Company's Key Areas Served
- 12.2.2 Recent Developments
- 12.3. Company Market Share Analysis 2025
- 12.3.1 Top 5 Companies Market Share Analysis
- 12.3.2 Top 3 Companies Market Share Analysis
- 12.4. List of Potential Customers
- 13. Research Methodology
List of Figures
- Figure 1: Global Specialty Beer Revenue Breakdown (undefined, %) by Region 2025 & 2033
- Figure 2: Global Specialty Beer Volume Breakdown (K, %) by Region 2025 & 2033
- Figure 3: North America Specialty Beer Revenue (undefined), by Application 2025 & 2033
- Figure 4: North America Specialty Beer Volume (K), by Application 2025 & 2033
- Figure 5: North America Specialty Beer Revenue Share (%), by Application 2025 & 2033
- Figure 6: North America Specialty Beer Volume Share (%), by Application 2025 & 2033
- Figure 7: North America Specialty Beer Revenue (undefined), by Type 2025 & 2033
- Figure 8: North America Specialty Beer Volume (K), by Type 2025 & 2033
- Figure 9: North America Specialty Beer Revenue Share (%), by Type 2025 & 2033
- Figure 10: North America Specialty Beer Volume Share (%), by Type 2025 & 2033
- Figure 11: North America Specialty Beer Revenue (undefined), by Country 2025 & 2033
- Figure 12: North America Specialty Beer Volume (K), by Country 2025 & 2033
- Figure 13: North America Specialty Beer Revenue Share (%), by Country 2025 & 2033
- Figure 14: North America Specialty Beer Volume Share (%), by Country 2025 & 2033
- Figure 15: South America Specialty Beer Revenue (undefined), by Application 2025 & 2033
- Figure 16: South America Specialty Beer Volume (K), by Application 2025 & 2033
- Figure 17: South America Specialty Beer Revenue Share (%), by Application 2025 & 2033
- Figure 18: South America Specialty Beer Volume Share (%), by Application 2025 & 2033
- Figure 19: South America Specialty Beer Revenue (undefined), by Type 2025 & 2033
- Figure 20: South America Specialty Beer Volume (K), by Type 2025 & 2033
- Figure 21: South America Specialty Beer Revenue Share (%), by Type 2025 & 2033
- Figure 22: South America Specialty Beer Volume Share (%), by Type 2025 & 2033
- Figure 23: South America Specialty Beer Revenue (undefined), by Country 2025 & 2033
- Figure 24: South America Specialty Beer Volume (K), by Country 2025 & 2033
- Figure 25: South America Specialty Beer Revenue Share (%), by Country 2025 & 2033
- Figure 26: South America Specialty Beer Volume Share (%), by Country 2025 & 2033
- Figure 27: Europe Specialty Beer Revenue (undefined), by Application 2025 & 2033
- Figure 28: Europe Specialty Beer Volume (K), by Application 2025 & 2033
- Figure 29: Europe Specialty Beer Revenue Share (%), by Application 2025 & 2033
- Figure 30: Europe Specialty Beer Volume Share (%), by Application 2025 & 2033
- Figure 31: Europe Specialty Beer Revenue (undefined), by Type 2025 & 2033
- Figure 32: Europe Specialty Beer Volume (K), by Type 2025 & 2033
- Figure 33: Europe Specialty Beer Revenue Share (%), by Type 2025 & 2033
- Figure 34: Europe Specialty Beer Volume Share (%), by Type 2025 & 2033
- Figure 35: Europe Specialty Beer Revenue (undefined), by Country 2025 & 2033
- Figure 36: Europe Specialty Beer Volume (K), by Country 2025 & 2033
- Figure 37: Europe Specialty Beer Revenue Share (%), by Country 2025 & 2033
- Figure 38: Europe Specialty Beer Volume Share (%), by Country 2025 & 2033
- Figure 39: Middle East & Africa Specialty Beer Revenue (undefined), by Application 2025 & 2033
- Figure 40: Middle East & Africa Specialty Beer Volume (K), by Application 2025 & 2033
- Figure 41: Middle East & Africa Specialty Beer Revenue Share (%), by Application 2025 & 2033
- Figure 42: Middle East & Africa Specialty Beer Volume Share (%), by Application 2025 & 2033
- Figure 43: Middle East & Africa Specialty Beer Revenue (undefined), by Type 2025 & 2033
- Figure 44: Middle East & Africa Specialty Beer Volume (K), by Type 2025 & 2033
- Figure 45: Middle East & Africa Specialty Beer Revenue Share (%), by Type 2025 & 2033
- Figure 46: Middle East & Africa Specialty Beer Volume Share (%), by Type 2025 & 2033
- Figure 47: Middle East & Africa Specialty Beer Revenue (undefined), by Country 2025 & 2033
- Figure 48: Middle East & Africa Specialty Beer Volume (K), by Country 2025 & 2033
- Figure 49: Middle East & Africa Specialty Beer Revenue Share (%), by Country 2025 & 2033
- Figure 50: Middle East & Africa Specialty Beer Volume Share (%), by Country 2025 & 2033
- Figure 51: Asia Pacific Specialty Beer Revenue (undefined), by Application 2025 & 2033
- Figure 52: Asia Pacific Specialty Beer Volume (K), by Application 2025 & 2033
- Figure 53: Asia Pacific Specialty Beer Revenue Share (%), by Application 2025 & 2033
- Figure 54: Asia Pacific Specialty Beer Volume Share (%), by Application 2025 & 2033
- Figure 55: Asia Pacific Specialty Beer Revenue (undefined), by Type 2025 & 2033
- Figure 56: Asia Pacific Specialty Beer Volume (K), by Type 2025 & 2033
- Figure 57: Asia Pacific Specialty Beer Revenue Share (%), by Type 2025 & 2033
- Figure 58: Asia Pacific Specialty Beer Volume Share (%), by Type 2025 & 2033
- Figure 59: Asia Pacific Specialty Beer Revenue (undefined), by Country 2025 & 2033
- Figure 60: Asia Pacific Specialty Beer Volume (K), by Country 2025 & 2033
- Figure 61: Asia Pacific Specialty Beer Revenue Share (%), by Country 2025 & 2033
- Figure 62: Asia Pacific Specialty Beer Volume Share (%), by Country 2025 & 2033
List of Tables
- Table 1: Global Specialty Beer Revenue undefined Forecast, by Application 2020 & 2033
- Table 2: Global Specialty Beer Volume K Forecast, by Application 2020 & 2033
- Table 3: Global Specialty Beer Revenue undefined Forecast, by Type 2020 & 2033
- Table 4: Global Specialty Beer Volume K Forecast, by Type 2020 & 2033
- Table 5: Global Specialty Beer Revenue undefined Forecast, by Region 2020 & 2033
- Table 6: Global Specialty Beer Volume K Forecast, by Region 2020 & 2033
- Table 7: Global Specialty Beer Revenue undefined Forecast, by Application 2020 & 2033
- Table 8: Global Specialty Beer Volume K Forecast, by Application 2020 & 2033
- Table 9: Global Specialty Beer Revenue undefined Forecast, by Type 2020 & 2033
- Table 10: Global Specialty Beer Volume K Forecast, by Type 2020 & 2033
- Table 11: Global Specialty Beer Revenue undefined Forecast, by Country 2020 & 2033
- Table 12: Global Specialty Beer Volume K Forecast, by Country 2020 & 2033
- Table 13: United States Specialty Beer Revenue (undefined) Forecast, by Application 2020 & 2033
- Table 14: United States Specialty Beer Volume (K) Forecast, by Application 2020 & 2033
- Table 15: Canada Specialty Beer Revenue (undefined) Forecast, by Application 2020 & 2033
- Table 16: Canada Specialty Beer Volume (K) Forecast, by Application 2020 & 2033
- Table 17: Mexico Specialty Beer Revenue (undefined) Forecast, by Application 2020 & 2033
- Table 18: Mexico Specialty Beer Volume (K) Forecast, by Application 2020 & 2033
- Table 19: Global Specialty Beer Revenue undefined Forecast, by Application 2020 & 2033
- Table 20: Global Specialty Beer Volume K Forecast, by Application 2020 & 2033
- Table 21: Global Specialty Beer Revenue undefined Forecast, by Type 2020 & 2033
- Table 22: Global Specialty Beer Volume K Forecast, by Type 2020 & 2033
- Table 23: Global Specialty Beer Revenue undefined Forecast, by Country 2020 & 2033
- Table 24: Global Specialty Beer Volume K Forecast, by Country 2020 & 2033
- Table 25: Brazil Specialty Beer Revenue (undefined) Forecast, by Application 2020 & 2033
- Table 26: Brazil Specialty Beer Volume (K) Forecast, by Application 2020 & 2033
- Table 27: Argentina Specialty Beer Revenue (undefined) Forecast, by Application 2020 & 2033
- Table 28: Argentina Specialty Beer Volume (K) Forecast, by Application 2020 & 2033
- Table 29: Rest of South America Specialty Beer Revenue (undefined) Forecast, by Application 2020 & 2033
- Table 30: Rest of South America Specialty Beer Volume (K) Forecast, by Application 2020 & 2033
- Table 31: Global Specialty Beer Revenue undefined Forecast, by Application 2020 & 2033
- Table 32: Global Specialty Beer Volume K Forecast, by Application 2020 & 2033
- Table 33: Global Specialty Beer Revenue undefined Forecast, by Type 2020 & 2033
- Table 34: Global Specialty Beer Volume K Forecast, by Type 2020 & 2033
- Table 35: Global Specialty Beer Revenue undefined Forecast, by Country 2020 & 2033
- Table 36: Global Specialty Beer Volume K Forecast, by Country 2020 & 2033
- Table 37: United Kingdom Specialty Beer Revenue (undefined) Forecast, by Application 2020 & 2033
- Table 38: United Kingdom Specialty Beer Volume (K) Forecast, by Application 2020 & 2033
- Table 39: Germany Specialty Beer Revenue (undefined) Forecast, by Application 2020 & 2033
- Table 40: Germany Specialty Beer Volume (K) Forecast, by Application 2020 & 2033
- Table 41: France Specialty Beer Revenue (undefined) Forecast, by Application 2020 & 2033
- Table 42: France Specialty Beer Volume (K) Forecast, by Application 2020 & 2033
- Table 43: Italy Specialty Beer Revenue (undefined) Forecast, by Application 2020 & 2033
- Table 44: Italy Specialty Beer Volume (K) Forecast, by Application 2020 & 2033
- Table 45: Spain Specialty Beer Revenue (undefined) Forecast, by Application 2020 & 2033
- Table 46: Spain Specialty Beer Volume (K) Forecast, by Application 2020 & 2033
- Table 47: Russia Specialty Beer Revenue (undefined) Forecast, by Application 2020 & 2033
- Table 48: Russia Specialty Beer Volume (K) Forecast, by Application 2020 & 2033
- Table 49: Benelux Specialty Beer Revenue (undefined) Forecast, by Application 2020 & 2033
- Table 50: Benelux Specialty Beer Volume (K) Forecast, by Application 2020 & 2033
- Table 51: Nordics Specialty Beer Revenue (undefined) Forecast, by Application 2020 & 2033
- Table 52: Nordics Specialty Beer Volume (K) Forecast, by Application 2020 & 2033
- Table 53: Rest of Europe Specialty Beer Revenue (undefined) Forecast, by Application 2020 & 2033
- Table 54: Rest of Europe Specialty Beer Volume (K) Forecast, by Application 2020 & 2033
- Table 55: Global Specialty Beer Revenue undefined Forecast, by Application 2020 & 2033
- Table 56: Global Specialty Beer Volume K Forecast, by Application 2020 & 2033
- Table 57: Global Specialty Beer Revenue undefined Forecast, by Type 2020 & 2033
- Table 58: Global Specialty Beer Volume K Forecast, by Type 2020 & 2033
- Table 59: Global Specialty Beer Revenue undefined Forecast, by Country 2020 & 2033
- Table 60: Global Specialty Beer Volume K Forecast, by Country 2020 & 2033
- Table 61: Turkey Specialty Beer Revenue (undefined) Forecast, by Application 2020 & 2033
- Table 62: Turkey Specialty Beer Volume (K) Forecast, by Application 2020 & 2033
- Table 63: Israel Specialty Beer Revenue (undefined) Forecast, by Application 2020 & 2033
- Table 64: Israel Specialty Beer Volume (K) Forecast, by Application 2020 & 2033
- Table 65: GCC Specialty Beer Revenue (undefined) Forecast, by Application 2020 & 2033
- Table 66: GCC Specialty Beer Volume (K) Forecast, by Application 2020 & 2033
- Table 67: North Africa Specialty Beer Revenue (undefined) Forecast, by Application 2020 & 2033
- Table 68: North Africa Specialty Beer Volume (K) Forecast, by Application 2020 & 2033
- Table 69: South Africa Specialty Beer Revenue (undefined) Forecast, by Application 2020 & 2033
- Table 70: South Africa Specialty Beer Volume (K) Forecast, by Application 2020 & 2033
- Table 71: Rest of Middle East & Africa Specialty Beer Revenue (undefined) Forecast, by Application 2020 & 2033
- Table 72: Rest of Middle East & Africa Specialty Beer Volume (K) Forecast, by Application 2020 & 2033
- Table 73: Global Specialty Beer Revenue undefined Forecast, by Application 2020 & 2033
- Table 74: Global Specialty Beer Volume K Forecast, by Application 2020 & 2033
- Table 75: Global Specialty Beer Revenue undefined Forecast, by Type 2020 & 2033
- Table 76: Global Specialty Beer Volume K Forecast, by Type 2020 & 2033
- Table 77: Global Specialty Beer Revenue undefined Forecast, by Country 2020 & 2033
- Table 78: Global Specialty Beer Volume K Forecast, by Country 2020 & 2033
- Table 79: China Specialty Beer Revenue (undefined) Forecast, by Application 2020 & 2033
- Table 80: China Specialty Beer Volume (K) Forecast, by Application 2020 & 2033
- Table 81: India Specialty Beer Revenue (undefined) Forecast, by Application 2020 & 2033
- Table 82: India Specialty Beer Volume (K) Forecast, by Application 2020 & 2033
- Table 83: Japan Specialty Beer Revenue (undefined) Forecast, by Application 2020 & 2033
- Table 84: Japan Specialty Beer Volume (K) Forecast, by Application 2020 & 2033
- Table 85: South Korea Specialty Beer Revenue (undefined) Forecast, by Application 2020 & 2033
- Table 86: South Korea Specialty Beer Volume (K) Forecast, by Application 2020 & 2033
- Table 87: ASEAN Specialty Beer Revenue (undefined) Forecast, by Application 2020 & 2033
- Table 88: ASEAN Specialty Beer Volume (K) Forecast, by Application 2020 & 2033
- Table 89: Oceania Specialty Beer Revenue (undefined) Forecast, by Application 2020 & 2033
- Table 90: Oceania Specialty Beer Volume (K) Forecast, by Application 2020 & 2033
- Table 91: Rest of Asia Pacific Specialty Beer Revenue (undefined) Forecast, by Application 2020 & 2033
- Table 92: Rest of Asia Pacific Specialty Beer Volume (K) Forecast, by Application 2020 & 2033
Frequently Asked Questions
1. What is the projected Compound Annual Growth Rate (CAGR) of the Specialty Beer?
The projected CAGR is approximately 4.4%.
2. Which companies are prominent players in the Specialty Beer?
Key companies in the market include Yuengling, The Boston Beer, Anheuser Busch InBev, Molson Coors Brewing, Sierra Nevada Brewing, Bell's Brewery, Heinken Holding, Deschutes Brewery, Stone Brewing, SweetWater Brewing.
3. What are the main segments of the Specialty Beer?
The market segments include Application, Type.
4. Can you provide details about the market size?
The market size is estimated to be USD XXX N/A as of 2022.
5. What are some drivers contributing to market growth?
N/A
6. What are the notable trends driving market growth?
N/A
7. Are there any restraints impacting market growth?
N/A
8. Can you provide examples of recent developments in the market?
N/A
9. What pricing options are available for accessing the report?
Pricing options include single-user, multi-user, and enterprise licenses priced at USD 3950.00, USD 5925.00, and USD 7900.00 respectively.
10. Is the market size provided in terms of value or volume?
The market size is provided in terms of value, measured in N/A and volume, measured in K.
11. Are there any specific market keywords associated with the report?
Yes, the market keyword associated with the report is "Specialty Beer," which aids in identifying and referencing the specific market segment covered.
12. How do I determine which pricing option suits my needs best?
The pricing options vary based on user requirements and access needs. Individual users may opt for single-user licenses, while businesses requiring broader access may choose multi-user or enterprise licenses for cost-effective access to the report.
13. Are there any additional resources or data provided in the Specialty Beer report?
While the report offers comprehensive insights, it's advisable to review the specific contents or supplementary materials provided to ascertain if additional resources or data are available.
14. How can I stay updated on further developments or reports in the Specialty Beer?
To stay informed about further developments, trends, and reports in the Specialty Beer, consider subscribing to industry newsletters, following relevant companies and organizations, or regularly checking reputable industry news sources and publications.
Methodology
Step 1 - Identification of Relevant Samples Size from Population Database


Step 2 - Approaches for Defining Global Market Size (Value, Volume* & Price*)

Note*: In applicable scenarios
Step 3 - Data Sources
Primary Research
- Web Analytics
- Survey Reports
- Research Institute
- Latest Research Reports
- Opinion Leaders
Secondary Research
- Annual Reports
- White Paper
- Latest Press Release
- Industry Association
- Paid Database
- Investor Presentations

Step 4 - Data Triangulation
Involves using different sources of information in order to increase the validity of a study
These sources are likely to be stakeholders in a program - participants, other researchers, program staff, other community members, and so on.
Then we put all data in single framework & apply various statistical tools to find out the dynamic on the market.
During the analysis stage, feedback from the stakeholder groups would be compared to determine areas of agreement as well as areas of divergence