

Key Insights
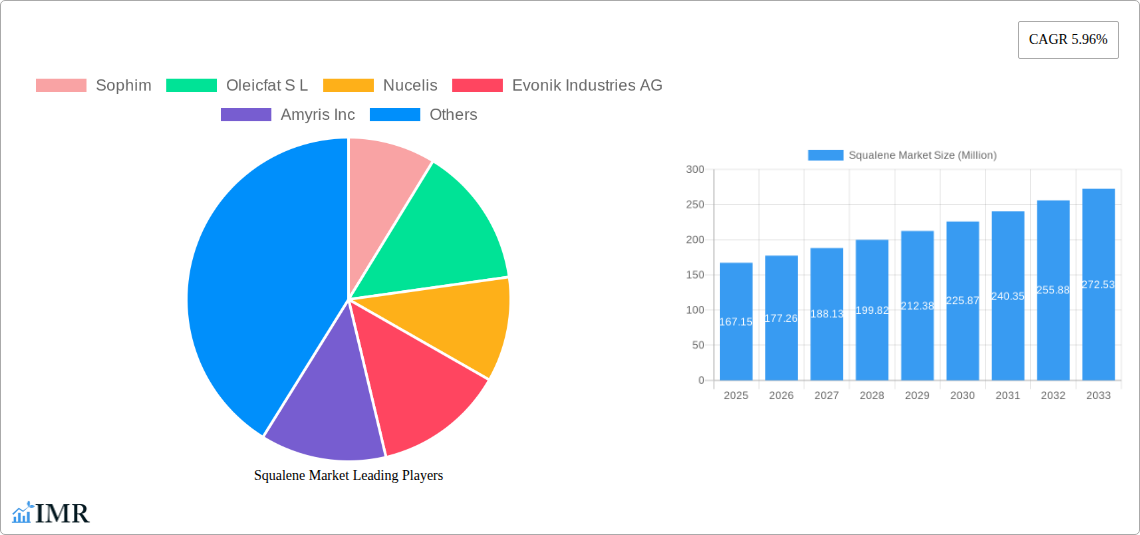
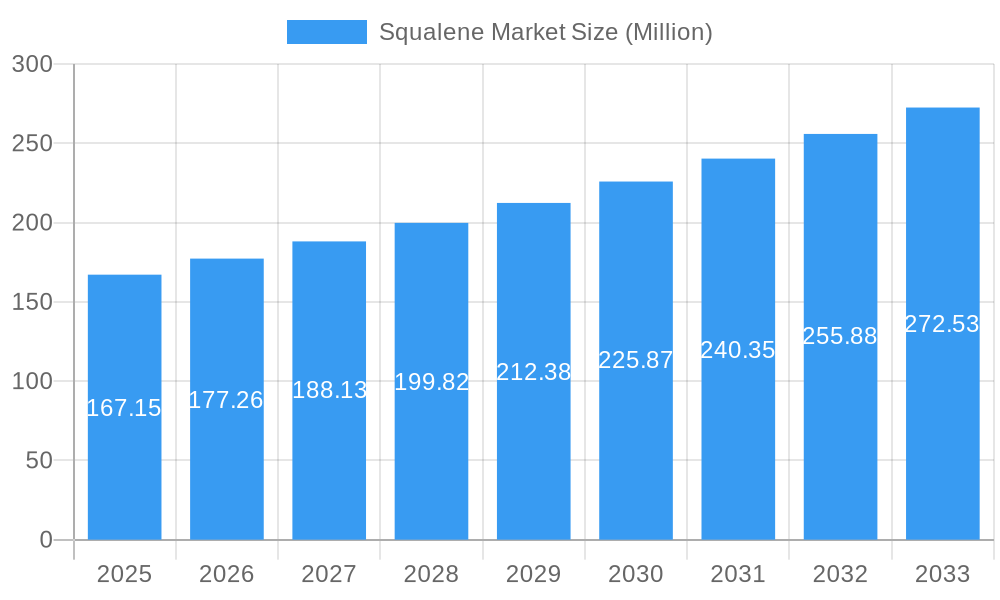
The global squalene market, valued at $167.15 million in 2025, is projected to experience robust growth, driven by a compound annual growth rate (CAGR) of 5.96% from 2025 to 2033. This expansion is fueled by several key factors. The increasing demand for natural and sustainable ingredients in cosmetics and personal care products is a significant driver, with squalene's exceptional moisturizing and skin-regenerating properties making it a highly sought-after ingredient. Furthermore, the growing awareness of squalene's health benefits, particularly its antioxidant and immune-boosting capabilities, is driving its adoption in the pharmaceutical and food industries. The market is segmented by source (animal, vegetable, biosynthetic) and end-user industry (cosmetics, food, pharmaceuticals). The biosynthetic segment is anticipated to witness substantial growth due to increasing concerns regarding animal welfare and the sustainability of sourcing squalene from sharks. Geographically, North America and Europe currently hold significant market share, but the Asia-Pacific region is poised for rapid expansion due to rising disposable incomes and increasing consumer awareness in key markets like China and India.
Squalene Market Market Size (In Million)
Despite the promising outlook, the market faces certain restraints. Fluctuations in raw material prices and the complex extraction and purification processes can impact the overall cost and availability of squalene. Furthermore, ensuring the consistent quality and purity of squalene across various sources remains a challenge. However, ongoing research and development efforts focused on improving extraction techniques and developing cost-effective biosynthetic production methods are expected to mitigate these limitations. The competitive landscape comprises both established players and emerging companies, leading to innovation and diversification in product offerings. Companies are focusing on developing sustainable and ethically sourced squalene to cater to the growing demand for eco-friendly products. This dynamic interplay of drivers, restraints, and technological advancements will shape the future trajectory of the squalene market.
Squalene Market Company Market Share
Squalene Market: A Comprehensive Market Research Report (2019-2033)
This in-depth report provides a comprehensive analysis of the global squalene market, covering market dynamics, growth trends, regional dominance, product landscape, key players, and future outlook. The study period spans from 2019 to 2033, with 2025 serving as the base and estimated year. The report leverages extensive data analysis and industry expertise to provide actionable insights for businesses operating in the cosmetics, food, and pharmaceutical sectors. This report is crucial for strategic decision-making within the broader lipids market, a parent market encompassing squalene. The child market of bio-based squalene is also specifically examined. The market size is projected to reach xx Million by 2033.
Squalene Market Dynamics & Structure
The squalene market is characterized by moderate concentration, with several key players holding significant market share. Technological innovation, particularly in biosynthetic production methods, is a primary growth driver, alongside increasing demand from the pharmaceutical and cosmetics industries. Stringent regulatory frameworks, particularly concerning animal-derived squalene, influence market dynamics. Competitive substitutes include other emollients and moisturizers, impacting overall market share. The market has witnessed a moderate level of M&A activity, with key players strategically expanding their product portfolios and production capabilities.
- Market Concentration: Moderately concentrated, with top 5 players holding approximately xx% of market share in 2024.
- Technological Innovation: Focus on biosynthetic production to address sustainability concerns and cost-effectiveness.
- Regulatory Frameworks: Stringent regulations for animal-derived squalene driving demand for alternatives.
- Competitive Substitutes: Other emollients and moisturizers pose competitive pressure.
- M&A Trends: Moderate M&A activity, with xx deals recorded between 2019 and 2024.
- End-User Demographics: Growing demand driven by increasing health consciousness and cosmetic usage.
Squalene Market Growth Trends & Insights
The global squalene market exhibited a CAGR of xx% during the historical period (2019-2024), driven by rising demand from the cosmetics and pharmaceutical industries. The market is expected to maintain strong growth momentum during the forecast period (2025-2033), with a projected CAGR of xx%. This growth is attributed to several factors, including increasing consumer preference for natural and organic products, the growing popularity of skincare products containing squalene, and the rising demand for squalene as an adjuvant in vaccines. The adoption rate of biosynthetic squalene is significantly increasing, driven by its cost-effectiveness and sustainability benefits. Consumer behavior is shifting towards products with natural and sustainable ingredients, further boosting demand for sustainably sourced squalene. Market penetration in emerging economies is also expected to contribute significantly to market growth.
Dominant Regions, Countries, or Segments in Squalene Market
North America currently dominates the global squalene market, followed by Europe and Asia-Pacific. The strong presence of major players, advanced technological capabilities, and high consumer spending on cosmetics and pharmaceuticals are key contributing factors. The cosmetics segment holds the largest market share, followed by pharmaceuticals. Within the source category, the biosynthetic segment is experiencing the fastest growth due to increased sustainability concerns and technological advancements.
- North America: Strong market presence of key players and high consumer spending in cosmetics and pharmaceuticals.
- Europe: Growing demand for natural and organic products, driving adoption of vegetable-sourced squalene.
- Asia-Pacific: Rapidly expanding cosmetics market, presenting significant growth potential.
- Cosmetics Segment: Highest market share driven by the use of squalene as an emollient and moisturizer.
- Pharmaceuticals Segment: High growth driven by the use of squalene as an adjuvant in vaccines and other pharmaceutical applications.
- Biosynthetic Source: Fastest-growing segment due to sustainability concerns and technological advancements.
Squalene Market Product Landscape
Squalene products are primarily categorized by their source (animal, vegetable, biosynthetic) and their purity levels. Recent innovations focus on improving the purity and efficacy of biosynthetic squalene, reducing production costs, and enhancing its sustainability profile. Unique selling propositions (USPs) for squalene products include its exceptional moisturizing, antioxidant, and skin-regenerating properties. Technological advancements are concentrating on optimizing fermentation processes to increase yields and reduce the production cost of biosynthetic squalene.
Key Drivers, Barriers & Challenges in Squalene Market
Key Drivers: The rising demand for natural and organic ingredients in cosmetics and pharmaceuticals, growing health consciousness among consumers, technological advancements in biosynthetic production, and increasing investments in R&D are driving market growth. Government regulations promoting sustainable practices are also contributing to the market's expansion.
Key Challenges: The high cost of production for biosynthetic squalene, fluctuations in raw material prices, stringent regulatory approvals for pharmaceutical applications, and the availability of substitute ingredients pose challenges to market growth. Supply chain disruptions can cause significant volatility in prices and availability. Maintaining supply chain stability and addressing sustainability concerns are crucial for long-term market success.
Emerging Opportunities in Squalene Market
Untapped markets in developing economies present significant growth opportunities. Emerging applications in nutraceuticals and functional foods are creating new avenues for squalene. Evolving consumer preferences towards sustainable and ethically sourced products are driving demand for sustainably produced squalene. Innovation in product formulations and delivery systems are creating new opportunities to expand market reach.
Growth Accelerators in the Squalene Market Industry
Technological breakthroughs in biosynthetic production, facilitating scalability and cost reduction, are key growth catalysts. Strategic partnerships between ingredient suppliers and manufacturers of end products drive innovation and market expansion. Market expansion into new geographic regions with high growth potential accelerates market growth.
Key Players Shaping the Squalene Market Market
- Sophim
- Oleicfat S L
- Nucelis
- Evonik Industries AG
- Amyris Inc
- Gracefruit Limited
- Vestan S A
- Arbee
- Efpbiotek
- Kishimoto Special Liver Oil Co Ltd
Notable Milestones in Squalene Market Sector
- June 2022: Amyris announced the inauguration of the production of 13 molecules, including squalene, at its plant in Brazil, showcasing commitment to sustainable production.
- December 2022: Evonik Industries AG launched PhytoSquene, a non-animal-derived squalene, addressing sustainability concerns and market demand for alternatives.
- May 2023: Amyris partnered with Croda International Plc to supply biotechnology-derived, pharmaceutical-grade squalene for adjuvants, expanding its reach into the pharmaceutical sector.
In-Depth Squalene Market Market Outlook
The squalene market is poised for robust growth in the coming years, driven by increasing demand from diverse sectors and technological advancements. Strategic partnerships, focused R&D, and expansion into new applications will create substantial opportunities for market players. The continued shift towards sustainable and ethical sourcing will shape the market landscape, emphasizing the importance of biosynthetic squalene. The market's future success hinges on navigating regulatory hurdles, addressing supply chain challenges, and consistently innovating to meet evolving consumer demands.
Squalene Market Segmentation
-
1. Source
- 1.1. Animal Source
- 1.2. Vegetable Source
- 1.3. Biosynthetic
- 1.4. Other Sources
-
2. End-user Industry
- 2.1. Cosmetics
- 2.2. Food
- 2.3. Pharmaceuticals
- 2.4. Other End-user Industries
Squalene Market Segmentation By Geography
-
1. Asia Pacific
- 1.1. China
- 1.2. India
- 1.3. Japan
- 1.4. South Korea
- 1.5. Malaysia
- 1.6. Thailand
- 1.7. Indonesia
- 1.8. Vietnam
- 1.9. Rest of Asia Pacific
-
2. North America
- 2.1. United States
- 2.2. Canada
- 2.3. Mexico
-
3. Europe
- 3.1. Germany
- 3.2. United Kingdom
- 3.3. France
- 3.4. Italy
- 3.5. Spain
- 3.6. NORDIC Countries
- 3.7. Turkey
- 3.8. Russia
- 3.9. Rest of Europe
-
4. South America
- 4.1. Brazil
- 4.2. Argentina
- 4.3. Colombia
- 4.4. Rest of South America
-
5. Middle East and Africa
- 5.1. Saudi Arabia
- 5.2. Qatar
- 5.3. United Arab Emirates
- 5.4. Nigeria
- 5.5. Egypt
- 5.6. South Africa
- 5.7. Rest of Middle East and Africa
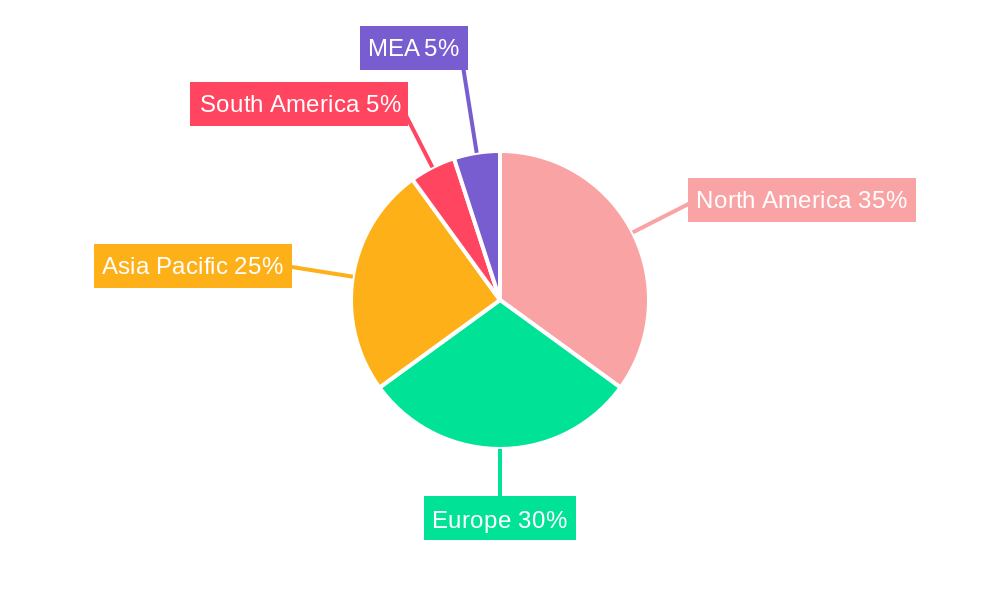
Squalene Market Regional Market Share
Geographic Coverage of Squalene Market
Squalene Market REPORT HIGHLIGHTS
| Aspects | Details |
|---|---|
| Study Period | 2020-2034 |
| Base Year | 2025 |
| Estimated Year | 2026 |
| Forecast Period | 2026-2034 |
| Historical Period | 2020-2025 |
| Growth Rate | CAGR of 10.9% from 2020-2034 |
| Segmentation |
|
Table of Contents
- 1. Introduction
- 1.1. Research Scope
- 1.2. Market Segmentation
- 1.3. Research Objective
- 1.4. Definitions and Assumptions
- 2. Executive Summary
- 2.1. Market Snapshot
- 3. Market Dynamics
- 3.1. Market Drivers
- 3.2. Market Restrains
- 3.3. Market Trends
- 3.4. Market Opportunities
- 4. Market Factor Analysis
- 4.1. Porters Five Forces
- 4.1.1. Bargaining Power of Suppliers
- 4.1.2. Bargaining Power of Buyers
- 4.1.3. Threat of New Entrants
- 4.1.4. Threat of Substitutes
- 4.1.5. Competitive Rivalry
- 4.2. PESTEL analysis
- 4.3. BCG Analysis
- 4.3.1. Stars (High Growth, High Market Share)
- 4.3.2. Cash Cows (Low Growth, High Market Share)
- 4.3.3. Question Mark (High Growth, Low Market Share)
- 4.3.4. Dogs (Low Growth, Low Market Share)
- 4.4. Ansoff Matrix Analysis
- 4.5. Supply Chain Analysis
- 4.6. Regulatory Landscape
- 4.7. Current Market Potential and Opportunity Assessment (TAM–SAM–SOM Framework)
- 4.8. IMR Analyst Note
- 4.1. Porters Five Forces
- 5. Market Analysis, Insights and Forecast 2021-2033
- 5.1. Market Analysis, Insights and Forecast - by Source
- 5.1.1. Animal Source
- 5.1.2. Vegetable Source
- 5.1.3. Biosynthetic
- 5.1.4. Other Sources
- 5.2. Market Analysis, Insights and Forecast - by End-user Industry
- 5.2.1. Cosmetics
- 5.2.2. Food
- 5.2.3. Pharmaceuticals
- 5.2.4. Other End-user Industries
- 5.3. Market Analysis, Insights and Forecast - by Region
- 5.3.1. Asia Pacific
- 5.3.2. North America
- 5.3.3. Europe
- 5.3.4. South America
- 5.3.5. Middle East and Africa
- 5.1. Market Analysis, Insights and Forecast - by Source
- 6. Global Squalene Market Analysis, Insights and Forecast, 2021-2033
- 6.1. Market Analysis, Insights and Forecast - by Source
- 6.1.1. Animal Source
- 6.1.2. Vegetable Source
- 6.1.3. Biosynthetic
- 6.1.4. Other Sources
- 6.2. Market Analysis, Insights and Forecast - by End-user Industry
- 6.2.1. Cosmetics
- 6.2.2. Food
- 6.2.3. Pharmaceuticals
- 6.2.4. Other End-user Industries
- 6.1. Market Analysis, Insights and Forecast - by Source
- 7. Asia Pacific Squalene Market Analysis, Insights and Forecast, 2020-2032
- 7.1. Market Analysis, Insights and Forecast - by Source
- 7.1.1. Animal Source
- 7.1.2. Vegetable Source
- 7.1.3. Biosynthetic
- 7.1.4. Other Sources
- 7.2. Market Analysis, Insights and Forecast - by End-user Industry
- 7.2.1. Cosmetics
- 7.2.2. Food
- 7.2.3. Pharmaceuticals
- 7.2.4. Other End-user Industries
- 7.1. Market Analysis, Insights and Forecast - by Source
- 8. North America Squalene Market Analysis, Insights and Forecast, 2020-2032
- 8.1. Market Analysis, Insights and Forecast - by Source
- 8.1.1. Animal Source
- 8.1.2. Vegetable Source
- 8.1.3. Biosynthetic
- 8.1.4. Other Sources
- 8.2. Market Analysis, Insights and Forecast - by End-user Industry
- 8.2.1. Cosmetics
- 8.2.2. Food
- 8.2.3. Pharmaceuticals
- 8.2.4. Other End-user Industries
- 8.1. Market Analysis, Insights and Forecast - by Source
- 9. Europe Squalene Market Analysis, Insights and Forecast, 2020-2032
- 9.1. Market Analysis, Insights and Forecast - by Source
- 9.1.1. Animal Source
- 9.1.2. Vegetable Source
- 9.1.3. Biosynthetic
- 9.1.4. Other Sources
- 9.2. Market Analysis, Insights and Forecast - by End-user Industry
- 9.2.1. Cosmetics
- 9.2.2. Food
- 9.2.3. Pharmaceuticals
- 9.2.4. Other End-user Industries
- 9.1. Market Analysis, Insights and Forecast - by Source
- 10. South America Squalene Market Analysis, Insights and Forecast, 2020-2032
- 10.1. Market Analysis, Insights and Forecast - by Source
- 10.1.1. Animal Source
- 10.1.2. Vegetable Source
- 10.1.3. Biosynthetic
- 10.1.4. Other Sources
- 10.2. Market Analysis, Insights and Forecast - by End-user Industry
- 10.2.1. Cosmetics
- 10.2.2. Food
- 10.2.3. Pharmaceuticals
- 10.2.4. Other End-user Industries
- 10.1. Market Analysis, Insights and Forecast - by Source
- 11. Middle East and Africa Squalene Market Analysis, Insights and Forecast, 2020-2032
- 11.1. Market Analysis, Insights and Forecast - by Source
- 11.1.1. Animal Source
- 11.1.2. Vegetable Source
- 11.1.3. Biosynthetic
- 11.1.4. Other Sources
- 11.2. Market Analysis, Insights and Forecast - by End-user Industry
- 11.2.1. Cosmetics
- 11.2.2. Food
- 11.2.3. Pharmaceuticals
- 11.2.4. Other End-user Industries
- 11.1. Market Analysis, Insights and Forecast - by Source
- 12. Competitive Analysis
- 12.1. Company Profiles
- 12.1.1 Sophim
- 12.1.1.1. Company Overview
- 12.1.1.2. Products
- 12.1.1.3. Company Financials
- 12.1.1.4. SWOT Analysis
- 12.1.2 Oleicfat S L
- 12.1.2.1. Company Overview
- 12.1.2.2. Products
- 12.1.2.3. Company Financials
- 12.1.2.4. SWOT Analysis
- 12.1.3 Nucelis
- 12.1.3.1. Company Overview
- 12.1.3.2. Products
- 12.1.3.3. Company Financials
- 12.1.3.4. SWOT Analysis
- 12.1.4 Evonik Industries AG
- 12.1.4.1. Company Overview
- 12.1.4.2. Products
- 12.1.4.3. Company Financials
- 12.1.4.4. SWOT Analysis
- 12.1.5 Amyris Inc
- 12.1.5.1. Company Overview
- 12.1.5.2. Products
- 12.1.5.3. Company Financials
- 12.1.5.4. SWOT Analysis
- 12.1.6 Gracefruit Limited
- 12.1.6.1. Company Overview
- 12.1.6.2. Products
- 12.1.6.3. Company Financials
- 12.1.6.4. SWOT Analysis
- 12.1.7 Vestan S A
- 12.1.7.1. Company Overview
- 12.1.7.2. Products
- 12.1.7.3. Company Financials
- 12.1.7.4. SWOT Analysis
- 12.1.8 Arbee
- 12.1.8.1. Company Overview
- 12.1.8.2. Products
- 12.1.8.3. Company Financials
- 12.1.8.4. SWOT Analysis
- 12.1.9 Efpbiotek
- 12.1.9.1. Company Overview
- 12.1.9.2. Products
- 12.1.9.3. Company Financials
- 12.1.9.4. SWOT Analysis
- 12.1.10 Kishimoto Special Liver Oil Co Ltd
- 12.1.10.1. Company Overview
- 12.1.10.2. Products
- 12.1.10.3. Company Financials
- 12.1.10.4. SWOT Analysis
- 12.1.1 Sophim
- 12.2. Market Entropy
- 12.2.1 Company's Key Areas Served
- 12.2.2 Recent Developments
- 12.3. Company Market Share Analysis 2025
- 12.3.1 Top 5 Companies Market Share Analysis
- 12.3.2 Top 3 Companies Market Share Analysis
- 12.4. List of Potential Customers
- 13. Research Methodology
List of Figures
- Figure 1: Global Squalene Market Revenue Breakdown (million, %) by Region 2025 & 2033
- Figure 2: Global Squalene Market Volume Breakdown (K Tons, %) by Region 2025 & 2033
- Figure 3: Asia Pacific Squalene Market Revenue (million), by Source 2025 & 2033
- Figure 4: Asia Pacific Squalene Market Volume (K Tons), by Source 2025 & 2033
- Figure 5: Asia Pacific Squalene Market Revenue Share (%), by Source 2025 & 2033
- Figure 6: Asia Pacific Squalene Market Volume Share (%), by Source 2025 & 2033
- Figure 7: Asia Pacific Squalene Market Revenue (million), by End-user Industry 2025 & 2033
- Figure 8: Asia Pacific Squalene Market Volume (K Tons), by End-user Industry 2025 & 2033
- Figure 9: Asia Pacific Squalene Market Revenue Share (%), by End-user Industry 2025 & 2033
- Figure 10: Asia Pacific Squalene Market Volume Share (%), by End-user Industry 2025 & 2033
- Figure 11: Asia Pacific Squalene Market Revenue (million), by Country 2025 & 2033
- Figure 12: Asia Pacific Squalene Market Volume (K Tons), by Country 2025 & 2033
- Figure 13: Asia Pacific Squalene Market Revenue Share (%), by Country 2025 & 2033
- Figure 14: Asia Pacific Squalene Market Volume Share (%), by Country 2025 & 2033
- Figure 15: North America Squalene Market Revenue (million), by Source 2025 & 2033
- Figure 16: North America Squalene Market Volume (K Tons), by Source 2025 & 2033
- Figure 17: North America Squalene Market Revenue Share (%), by Source 2025 & 2033
- Figure 18: North America Squalene Market Volume Share (%), by Source 2025 & 2033
- Figure 19: North America Squalene Market Revenue (million), by End-user Industry 2025 & 2033
- Figure 20: North America Squalene Market Volume (K Tons), by End-user Industry 2025 & 2033
- Figure 21: North America Squalene Market Revenue Share (%), by End-user Industry 2025 & 2033
- Figure 22: North America Squalene Market Volume Share (%), by End-user Industry 2025 & 2033
- Figure 23: North America Squalene Market Revenue (million), by Country 2025 & 2033
- Figure 24: North America Squalene Market Volume (K Tons), by Country 2025 & 2033
- Figure 25: North America Squalene Market Revenue Share (%), by Country 2025 & 2033
- Figure 26: North America Squalene Market Volume Share (%), by Country 2025 & 2033
- Figure 27: Europe Squalene Market Revenue (million), by Source 2025 & 2033
- Figure 28: Europe Squalene Market Volume (K Tons), by Source 2025 & 2033
- Figure 29: Europe Squalene Market Revenue Share (%), by Source 2025 & 2033
- Figure 30: Europe Squalene Market Volume Share (%), by Source 2025 & 2033
- Figure 31: Europe Squalene Market Revenue (million), by End-user Industry 2025 & 2033
- Figure 32: Europe Squalene Market Volume (K Tons), by End-user Industry 2025 & 2033
- Figure 33: Europe Squalene Market Revenue Share (%), by End-user Industry 2025 & 2033
- Figure 34: Europe Squalene Market Volume Share (%), by End-user Industry 2025 & 2033
- Figure 35: Europe Squalene Market Revenue (million), by Country 2025 & 2033
- Figure 36: Europe Squalene Market Volume (K Tons), by Country 2025 & 2033
- Figure 37: Europe Squalene Market Revenue Share (%), by Country 2025 & 2033
- Figure 38: Europe Squalene Market Volume Share (%), by Country 2025 & 2033
- Figure 39: South America Squalene Market Revenue (million), by Source 2025 & 2033
- Figure 40: South America Squalene Market Volume (K Tons), by Source 2025 & 2033
- Figure 41: South America Squalene Market Revenue Share (%), by Source 2025 & 2033
- Figure 42: South America Squalene Market Volume Share (%), by Source 2025 & 2033
- Figure 43: South America Squalene Market Revenue (million), by End-user Industry 2025 & 2033
- Figure 44: South America Squalene Market Volume (K Tons), by End-user Industry 2025 & 2033
- Figure 45: South America Squalene Market Revenue Share (%), by End-user Industry 2025 & 2033
- Figure 46: South America Squalene Market Volume Share (%), by End-user Industry 2025 & 2033
- Figure 47: South America Squalene Market Revenue (million), by Country 2025 & 2033
- Figure 48: South America Squalene Market Volume (K Tons), by Country 2025 & 2033
- Figure 49: South America Squalene Market Revenue Share (%), by Country 2025 & 2033
- Figure 50: South America Squalene Market Volume Share (%), by Country 2025 & 2033
- Figure 51: Middle East and Africa Squalene Market Revenue (million), by Source 2025 & 2033
- Figure 52: Middle East and Africa Squalene Market Volume (K Tons), by Source 2025 & 2033
- Figure 53: Middle East and Africa Squalene Market Revenue Share (%), by Source 2025 & 2033
- Figure 54: Middle East and Africa Squalene Market Volume Share (%), by Source 2025 & 2033
- Figure 55: Middle East and Africa Squalene Market Revenue (million), by End-user Industry 2025 & 2033
- Figure 56: Middle East and Africa Squalene Market Volume (K Tons), by End-user Industry 2025 & 2033
- Figure 57: Middle East and Africa Squalene Market Revenue Share (%), by End-user Industry 2025 & 2033
- Figure 58: Middle East and Africa Squalene Market Volume Share (%), by End-user Industry 2025 & 2033
- Figure 59: Middle East and Africa Squalene Market Revenue (million), by Country 2025 & 2033
- Figure 60: Middle East and Africa Squalene Market Volume (K Tons), by Country 2025 & 2033
- Figure 61: Middle East and Africa Squalene Market Revenue Share (%), by Country 2025 & 2033
- Figure 62: Middle East and Africa Squalene Market Volume Share (%), by Country 2025 & 2033
List of Tables
- Table 1: Global Squalene Market Revenue million Forecast, by Source 2020 & 2033
- Table 2: Global Squalene Market Volume K Tons Forecast, by Source 2020 & 2033
- Table 3: Global Squalene Market Revenue million Forecast, by End-user Industry 2020 & 2033
- Table 4: Global Squalene Market Volume K Tons Forecast, by End-user Industry 2020 & 2033
- Table 5: Global Squalene Market Revenue million Forecast, by Region 2020 & 2033
- Table 6: Global Squalene Market Volume K Tons Forecast, by Region 2020 & 2033
- Table 7: Global Squalene Market Revenue million Forecast, by Source 2020 & 2033
- Table 8: Global Squalene Market Volume K Tons Forecast, by Source 2020 & 2033
- Table 9: Global Squalene Market Revenue million Forecast, by End-user Industry 2020 & 2033
- Table 10: Global Squalene Market Volume K Tons Forecast, by End-user Industry 2020 & 2033
- Table 11: Global Squalene Market Revenue million Forecast, by Country 2020 & 2033
- Table 12: Global Squalene Market Volume K Tons Forecast, by Country 2020 & 2033
- Table 13: China Squalene Market Revenue (million) Forecast, by Application 2020 & 2033
- Table 14: China Squalene Market Volume (K Tons) Forecast, by Application 2020 & 2033
- Table 15: India Squalene Market Revenue (million) Forecast, by Application 2020 & 2033
- Table 16: India Squalene Market Volume (K Tons) Forecast, by Application 2020 & 2033
- Table 17: Japan Squalene Market Revenue (million) Forecast, by Application 2020 & 2033
- Table 18: Japan Squalene Market Volume (K Tons) Forecast, by Application 2020 & 2033
- Table 19: South Korea Squalene Market Revenue (million) Forecast, by Application 2020 & 2033
- Table 20: South Korea Squalene Market Volume (K Tons) Forecast, by Application 2020 & 2033
- Table 21: Malaysia Squalene Market Revenue (million) Forecast, by Application 2020 & 2033
- Table 22: Malaysia Squalene Market Volume (K Tons) Forecast, by Application 2020 & 2033
- Table 23: Thailand Squalene Market Revenue (million) Forecast, by Application 2020 & 2033
- Table 24: Thailand Squalene Market Volume (K Tons) Forecast, by Application 2020 & 2033
- Table 25: Indonesia Squalene Market Revenue (million) Forecast, by Application 2020 & 2033
- Table 26: Indonesia Squalene Market Volume (K Tons) Forecast, by Application 2020 & 2033
- Table 27: Vietnam Squalene Market Revenue (million) Forecast, by Application 2020 & 2033
- Table 28: Vietnam Squalene Market Volume (K Tons) Forecast, by Application 2020 & 2033
- Table 29: Rest of Asia Pacific Squalene Market Revenue (million) Forecast, by Application 2020 & 2033
- Table 30: Rest of Asia Pacific Squalene Market Volume (K Tons) Forecast, by Application 2020 & 2033
- Table 31: Global Squalene Market Revenue million Forecast, by Source 2020 & 2033
- Table 32: Global Squalene Market Volume K Tons Forecast, by Source 2020 & 2033
- Table 33: Global Squalene Market Revenue million Forecast, by End-user Industry 2020 & 2033
- Table 34: Global Squalene Market Volume K Tons Forecast, by End-user Industry 2020 & 2033
- Table 35: Global Squalene Market Revenue million Forecast, by Country 2020 & 2033
- Table 36: Global Squalene Market Volume K Tons Forecast, by Country 2020 & 2033
- Table 37: United States Squalene Market Revenue (million) Forecast, by Application 2020 & 2033
- Table 38: United States Squalene Market Volume (K Tons) Forecast, by Application 2020 & 2033
- Table 39: Canada Squalene Market Revenue (million) Forecast, by Application 2020 & 2033
- Table 40: Canada Squalene Market Volume (K Tons) Forecast, by Application 2020 & 2033
- Table 41: Mexico Squalene Market Revenue (million) Forecast, by Application 2020 & 2033
- Table 42: Mexico Squalene Market Volume (K Tons) Forecast, by Application 2020 & 2033
- Table 43: Global Squalene Market Revenue million Forecast, by Source 2020 & 2033
- Table 44: Global Squalene Market Volume K Tons Forecast, by Source 2020 & 2033
- Table 45: Global Squalene Market Revenue million Forecast, by End-user Industry 2020 & 2033
- Table 46: Global Squalene Market Volume K Tons Forecast, by End-user Industry 2020 & 2033
- Table 47: Global Squalene Market Revenue million Forecast, by Country 2020 & 2033
- Table 48: Global Squalene Market Volume K Tons Forecast, by Country 2020 & 2033
- Table 49: Germany Squalene Market Revenue (million) Forecast, by Application 2020 & 2033
- Table 50: Germany Squalene Market Volume (K Tons) Forecast, by Application 2020 & 2033
- Table 51: United Kingdom Squalene Market Revenue (million) Forecast, by Application 2020 & 2033
- Table 52: United Kingdom Squalene Market Volume (K Tons) Forecast, by Application 2020 & 2033
- Table 53: France Squalene Market Revenue (million) Forecast, by Application 2020 & 2033
- Table 54: France Squalene Market Volume (K Tons) Forecast, by Application 2020 & 2033
- Table 55: Italy Squalene Market Revenue (million) Forecast, by Application 2020 & 2033
- Table 56: Italy Squalene Market Volume (K Tons) Forecast, by Application 2020 & 2033
- Table 57: Spain Squalene Market Revenue (million) Forecast, by Application 2020 & 2033
- Table 58: Spain Squalene Market Volume (K Tons) Forecast, by Application 2020 & 2033
- Table 59: NORDIC Countries Squalene Market Revenue (million) Forecast, by Application 2020 & 2033
- Table 60: NORDIC Countries Squalene Market Volume (K Tons) Forecast, by Application 2020 & 2033
- Table 61: Turkey Squalene Market Revenue (million) Forecast, by Application 2020 & 2033
- Table 62: Turkey Squalene Market Volume (K Tons) Forecast, by Application 2020 & 2033
- Table 63: Russia Squalene Market Revenue (million) Forecast, by Application 2020 & 2033
- Table 64: Russia Squalene Market Volume (K Tons) Forecast, by Application 2020 & 2033
- Table 65: Rest of Europe Squalene Market Revenue (million) Forecast, by Application 2020 & 2033
- Table 66: Rest of Europe Squalene Market Volume (K Tons) Forecast, by Application 2020 & 2033
- Table 67: Global Squalene Market Revenue million Forecast, by Source 2020 & 2033
- Table 68: Global Squalene Market Volume K Tons Forecast, by Source 2020 & 2033
- Table 69: Global Squalene Market Revenue million Forecast, by End-user Industry 2020 & 2033
- Table 70: Global Squalene Market Volume K Tons Forecast, by End-user Industry 2020 & 2033
- Table 71: Global Squalene Market Revenue million Forecast, by Country 2020 & 2033
- Table 72: Global Squalene Market Volume K Tons Forecast, by Country 2020 & 2033
- Table 73: Brazil Squalene Market Revenue (million) Forecast, by Application 2020 & 2033
- Table 74: Brazil Squalene Market Volume (K Tons) Forecast, by Application 2020 & 2033
- Table 75: Argentina Squalene Market Revenue (million) Forecast, by Application 2020 & 2033
- Table 76: Argentina Squalene Market Volume (K Tons) Forecast, by Application 2020 & 2033
- Table 77: Colombia Squalene Market Revenue (million) Forecast, by Application 2020 & 2033
- Table 78: Colombia Squalene Market Volume (K Tons) Forecast, by Application 2020 & 2033
- Table 79: Rest of South America Squalene Market Revenue (million) Forecast, by Application 2020 & 2033
- Table 80: Rest of South America Squalene Market Volume (K Tons) Forecast, by Application 2020 & 2033
- Table 81: Global Squalene Market Revenue million Forecast, by Source 2020 & 2033
- Table 82: Global Squalene Market Volume K Tons Forecast, by Source 2020 & 2033
- Table 83: Global Squalene Market Revenue million Forecast, by End-user Industry 2020 & 2033
- Table 84: Global Squalene Market Volume K Tons Forecast, by End-user Industry 2020 & 2033
- Table 85: Global Squalene Market Revenue million Forecast, by Country 2020 & 2033
- Table 86: Global Squalene Market Volume K Tons Forecast, by Country 2020 & 2033
- Table 87: Saudi Arabia Squalene Market Revenue (million) Forecast, by Application 2020 & 2033
- Table 88: Saudi Arabia Squalene Market Volume (K Tons) Forecast, by Application 2020 & 2033
- Table 89: Qatar Squalene Market Revenue (million) Forecast, by Application 2020 & 2033
- Table 90: Qatar Squalene Market Volume (K Tons) Forecast, by Application 2020 & 2033
- Table 91: United Arab Emirates Squalene Market Revenue (million) Forecast, by Application 2020 & 2033
- Table 92: United Arab Emirates Squalene Market Volume (K Tons) Forecast, by Application 2020 & 2033
- Table 93: Nigeria Squalene Market Revenue (million) Forecast, by Application 2020 & 2033
- Table 94: Nigeria Squalene Market Volume (K Tons) Forecast, by Application 2020 & 2033
- Table 95: Egypt Squalene Market Revenue (million) Forecast, by Application 2020 & 2033
- Table 96: Egypt Squalene Market Volume (K Tons) Forecast, by Application 2020 & 2033
- Table 97: South Africa Squalene Market Revenue (million) Forecast, by Application 2020 & 2033
- Table 98: South Africa Squalene Market Volume (K Tons) Forecast, by Application 2020 & 2033
- Table 99: Rest of Middle East and Africa Squalene Market Revenue (million) Forecast, by Application 2020 & 2033
- Table 100: Rest of Middle East and Africa Squalene Market Volume (K Tons) Forecast, by Application 2020 & 2033
Frequently Asked Questions
1. What is the projected Compound Annual Growth Rate (CAGR) of the Squalene Market?
The projected CAGR is approximately 10.9%.
2. Which companies are prominent players in the Squalene Market?
Key companies in the market include Sophim, Oleicfat S L, Nucelis, Evonik Industries AG, Amyris Inc, Gracefruit Limited, Vestan S A, Arbee, Efpbiotek, Kishimoto Special Liver Oil Co Ltd.
3. What are the main segments of the Squalene Market?
The market segments include Source, End-user Industry.
4. Can you provide details about the market size?
The market size is estimated to be USD 183.7 million as of 2022.
5. What are some drivers contributing to market growth?
Growing Cosmetics Industry; Growing Demand from the Nutraceutical Industry; Growing Consumption in Pharmaceutical Industry.
6. What are the notable trends driving market growth?
Cosmetics Industry to Dominate the Market.
7. Are there any restraints impacting market growth?
Shark Killing Concerns and Limitations; Other Restraints.
8. Can you provide examples of recent developments in the market?
May 2023: Amyris announced its partnership with Croda International Plc (Croda) to supply biotechnology-derived, pharmaceutical-grade squalene used in adjuvants to boost immune responses.
9. What pricing options are available for accessing the report?
Pricing options include single-user, multi-user, and enterprise licenses priced at USD 4750, USD 5250, and USD 8750 respectively.
10. Is the market size provided in terms of value or volume?
The market size is provided in terms of value, measured in million and volume, measured in K Tons.
11. Are there any specific market keywords associated with the report?
Yes, the market keyword associated with the report is "Squalene Market," which aids in identifying and referencing the specific market segment covered.
12. How do I determine which pricing option suits my needs best?
The pricing options vary based on user requirements and access needs. Individual users may opt for single-user licenses, while businesses requiring broader access may choose multi-user or enterprise licenses for cost-effective access to the report.
13. Are there any additional resources or data provided in the Squalene Market report?
While the report offers comprehensive insights, it's advisable to review the specific contents or supplementary materials provided to ascertain if additional resources or data are available.
14. How can I stay updated on further developments or reports in the Squalene Market?
To stay informed about further developments, trends, and reports in the Squalene Market, consider subscribing to industry newsletters, following relevant companies and organizations, or regularly checking reputable industry news sources and publications.
Methodology
Step 1 - Identification of Relevant Samples Size from Population Database


Step 2 - Approaches for Defining Global Market Size (Value, Volume* & Price*)

Note*: In applicable scenarios
Step 3 - Data Sources
Primary Research
- Web Analytics
- Survey Reports
- Research Institute
- Latest Research Reports
- Opinion Leaders
Secondary Research
- Annual Reports
- White Paper
- Latest Press Release
- Industry Association
- Paid Database
- Investor Presentations

Step 4 - Data Triangulation
Involves using different sources of information in order to increase the validity of a study
These sources are likely to be stakeholders in a program - participants, other researchers, program staff, other community members, and so on.
Then we put all data in single framework & apply various statistical tools to find out the dynamic on the market.
During the analysis stage, feedback from the stakeholder groups would be compared to determine areas of agreement as well as areas of divergence