

Key Insights
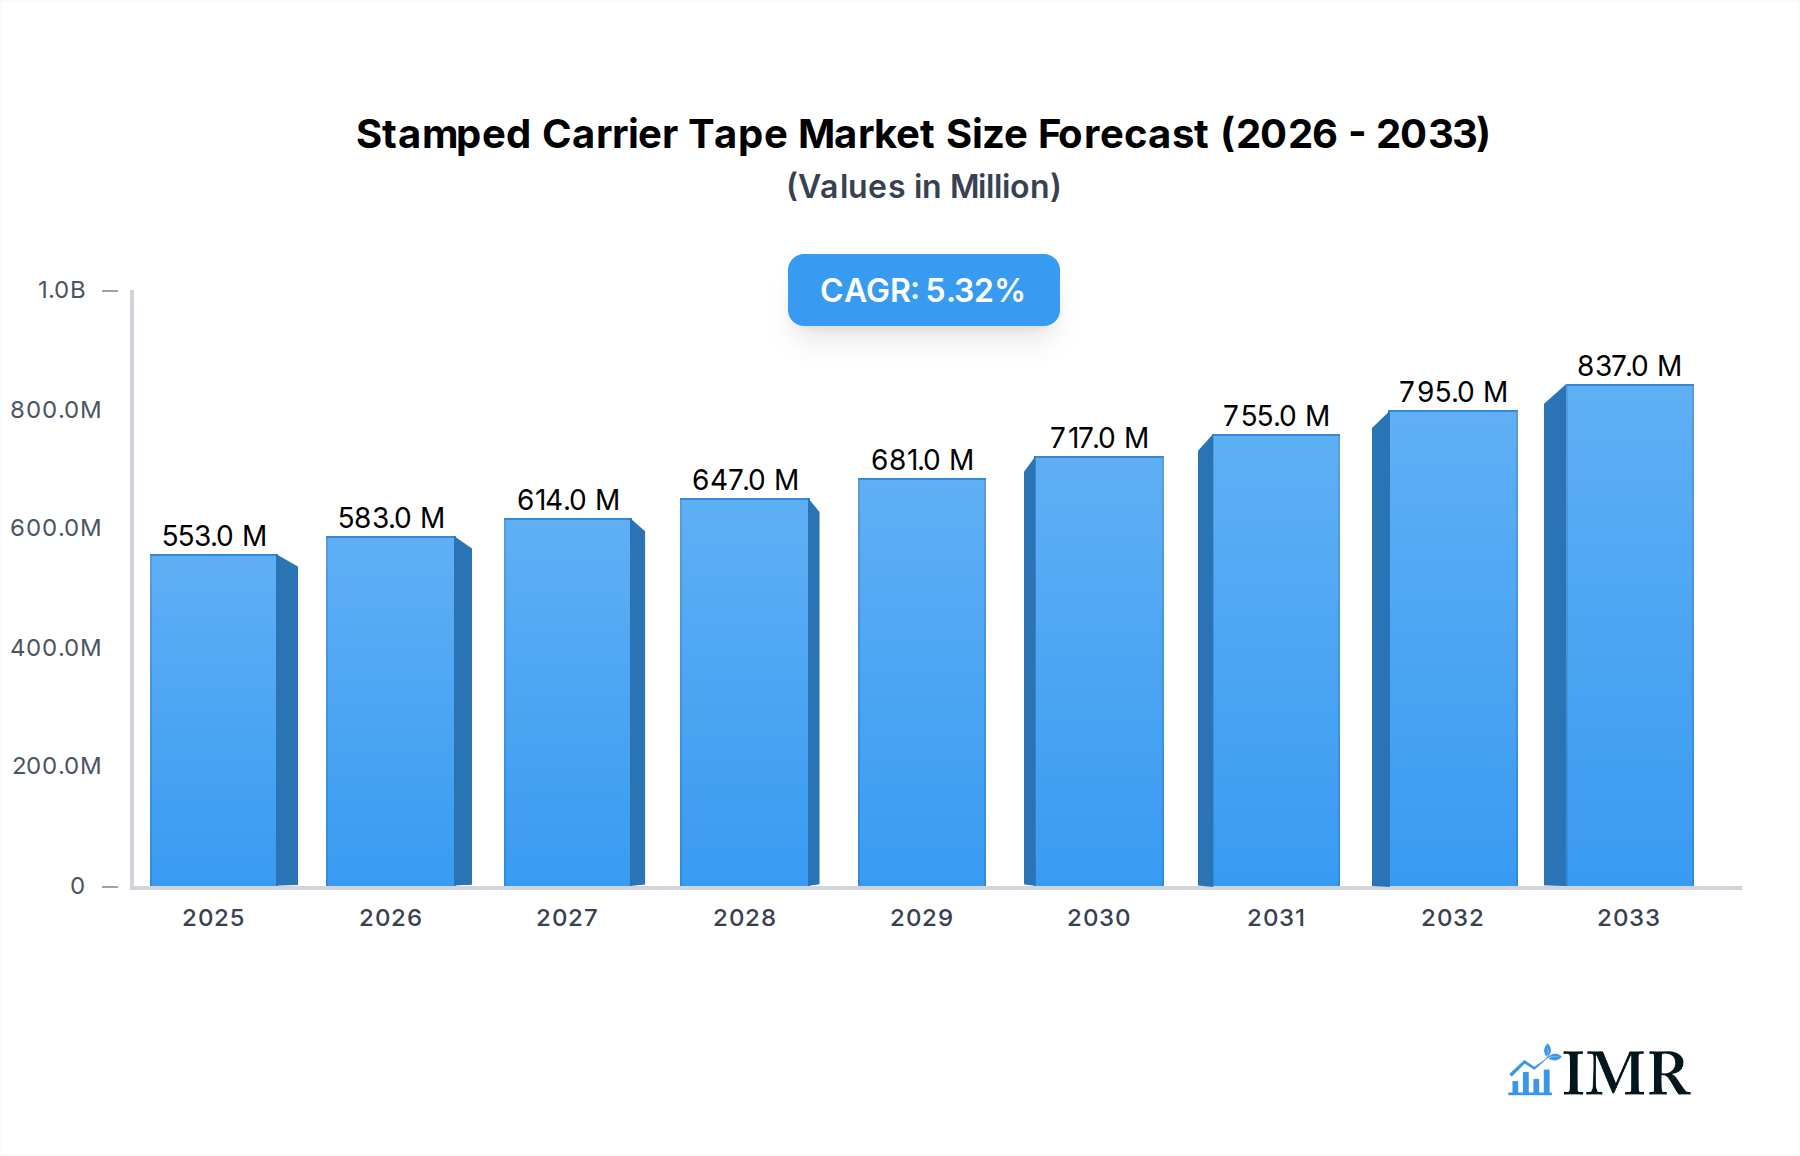
The global Stamped Carrier Tape market is poised for robust expansion, projected to reach a significant $553 million by 2025. This growth trajectory is underpinned by a healthy Compound Annual Growth Rate (CAGR) of 5.5%, indicating sustained demand and innovation within the industry. The market is primarily driven by the increasing adoption of surface-mount technology (SMT) across diverse electronics manufacturing sectors. As electronic devices become smaller, more powerful, and integrated, the precision and reliability offered by stamped carrier tapes in protecting and orienting small electronic components are becoming indispensable. This demand is further amplified by the burgeoning automotive electronics segment, the proliferation of consumer electronics, and the rapid advancements in telecommunications infrastructure, all of which rely heavily on SMT processes. The market's expansion is also being fueled by ongoing technological advancements, leading to the development of carrier tapes with enhanced material properties and improved design for specialized component handling.

Stamped Carrier Tape Market Size (In Million)
The Stamped Carrier Tape market is segmented by application into Active Components and Passive Components, with both areas exhibiting strong growth potential. By type, the market is characterized by distinct material preferences, including Polystyrene, Polycarbonate, Polyethylene Terephthalate (PET), and Polyvinyl Chloride (PVC) carrier tapes, each offering unique advantages in terms of cost, durability, and environmental impact. While the overall market exhibits strong growth, certain restraints, such as fluctuations in raw material prices and the increasing complexity of component miniaturization requiring highly specialized tape designs, may present challenges. However, the widespread presence of key industry players like 3M, Shin-Etsu, and Asahi Kasei, coupled with the expanding manufacturing capabilities in regions like Asia Pacific, are expected to drive innovation and market penetration, ensuring continued expansion throughout the forecast period.
Stamped Carrier Tape Company Market Share
Stamped Carrier Tape Market Research Report: Comprehensive Analysis and Forecast (2019-2033)
This in-depth report offers a detailed examination of the global stamped carrier tape market, a critical component in the electronics packaging and supply chain ecosystem. We analyze market dynamics, growth trends, regional dominance, product landscapes, key players, and emerging opportunities, providing actionable insights for stakeholders. The report covers the historical period (2019-2024), base year (2025), and forecast period (2025-2033), with a focus on quantitative data presented in millions of units.
Stamped Carrier Tape Market Dynamics & Structure
The global stamped carrier tape market is characterized by a moderate concentration, with a few leading players holding significant market share, alongside a robust presence of regional manufacturers. Technological innovation serves as a primary driver, fueled by the relentless demand for miniaturization, increased component density, and enhanced protection in electronic devices. Advancements in material science, particularly in polymers, enable the development of carrier tapes with superior electrostatic discharge (ESD) protection, thermal resistance, and dimensional stability. Regulatory frameworks, primarily focused on environmental sustainability and safety standards (e.g., RoHS, REACH), influence material choices and manufacturing processes. The competitive landscape includes a variety of product substitutes, though stamped carrier tapes offer a balance of performance and cost-effectiveness for many applications. End-user demographics are largely driven by the growth of the consumer electronics, automotive, and industrial automation sectors, each with distinct packaging requirements. Mergers and acquisitions (M&A) are a notable trend, as larger companies seek to consolidate market presence, expand product portfolios, and gain access to new technologies or geographical markets. For instance, the historical period saw an estimated 3-5 significant M&A deals per year, often involving smaller, specialized manufacturers being acquired by established industry leaders to bolster their capabilities in specific carrier tape materials or niche applications.
- Market Concentration: Moderately concentrated, with key players dominating a substantial portion of the market.
- Technological Innovation Drivers: Miniaturization, increased component density, ESD protection, thermal resistance, dimensional stability.
- Regulatory Frameworks: RoHS, REACH, and other environmental and safety compliance standards are shaping material selection and manufacturing.
- Competitive Product Substitutes: While alternatives exist, stamped carrier tapes offer a strong balance of performance and cost.
- End-User Demographics: Driven by consumer electronics, automotive, industrial automation, and medical devices.
- M&A Trends: Ongoing consolidation for market expansion and technological integration.
Stamped Carrier Tape Growth Trends & Insights
The global stamped carrier tape market has witnessed a consistent upward trajectory, driven by the ever-expanding electronics industry. The market size, estimated at $1,850 million in the base year of 2025, is projected to experience a Compound Annual Growth Rate (CAGR) of approximately 6.2% during the forecast period of 2025–2033. This robust growth is underpinned by the increasing adoption of advanced electronic components and the stringent packaging requirements associated with them. Technological disruptions, such as the shift towards higher-density semiconductor packaging and the proliferation of IoT devices, are creating new demands for specialized carrier tapes with enhanced properties like superior ESD protection and higher temperature resistance. Consumer behavior shifts, including the demand for smaller, more powerful, and more durable electronic devices, directly translate into a need for more sophisticated and reliable packaging solutions. The market penetration of stamped carrier tapes in critical sectors like automotive electronics, where the trend towards electrification and advanced driver-assistance systems (ADAS) necessitates high-reliability components, is steadily increasing. In the historical period of 2019-2024, the market size grew from an estimated $1,300 million to $1,750 million, demonstrating sustained expansion. This growth is further amplified by the increasing complexity of components and the need for automated assembly processes, where precise and robust carrier tapes are indispensable. The market's evolution is also shaped by a growing emphasis on sustainable materials and manufacturing processes, encouraging innovation in bio-based or recyclable carrier tape options.
Dominant Regions, Countries, or Segments in Stamped Carrier Tape
The Asia-Pacific region stands as the dominant force in the global stamped carrier tape market, driven by its unparalleled position as a manufacturing hub for electronics. Within this region, China emerges as the leading country, owing to its extensive semiconductor fabrication facilities, a massive consumer electronics manufacturing base, and supportive government policies aimed at fostering the growth of its domestic electronics industry. The dominance of Asia-Pacific, with an estimated market share of 45% in 2025, is further bolstered by its significant presence in key segments, particularly Active Components. This segment, expected to hold approximately 60% of the total market share in 2025, is seeing immense growth due to the continuous demand for processors, memory chips, and other active electronic devices used in smartphones, computers, and advanced automotive systems.
Key Drivers for Asia-Pacific's Dominance:
- Manufacturing Prowess: Unrivaled concentration of electronics manufacturing, from component fabrication to final assembly.
- Government Support: Favorable policies and investments in the semiconductor and electronics sectors.
- Cost-Effectiveness: Competitive manufacturing costs attract global electronics companies.
- Supply Chain Integration: A well-established and interconnected supply chain for electronic components and packaging.
Dominant Segments:
- Application: Active Components: The highest demand driven by the proliferation of advanced semiconductors, microcontrollers, and integrated circuits.
- Type: Polyethylene Terephthalate (PET) Carrier Tape: PET remains a preferred material due to its excellent balance of cost, durability, ESD properties, and moldability for various component geometries. Its market share is estimated to be around 35% of the total carrier tape market by type in 2025. The growing preference for high-performance electronics necessitates PET's ability to withstand demanding manufacturing processes and environmental conditions.
The sheer volume of active components being manufactured and packaged in Asia-Pacific directly fuels the demand for high-quality stamped carrier tapes. Countries like South Korea, Taiwan, and Japan also contribute significantly to the region's dominance, each specializing in different aspects of electronics manufacturing and innovation. The growth potential in this region remains substantial, driven by ongoing technological advancements and the increasing global demand for sophisticated electronic products.
Stamped Carrier Tape Product Landscape
The stamped carrier tape market showcases a dynamic product landscape driven by continuous innovation to meet the evolving demands of the electronics industry. Manufacturers are focused on developing tapes with superior electrostatic discharge (ESD) protection to safeguard sensitive components, enhanced thermal stability for high-temperature processing, and improved dimensional accuracy for high-speed automated assembly. Key product innovations include the development of multi-layer ESD tapes offering broader protection, anti-static tapes with longer-lasting conductivity, and specialized carrier tapes for emerging technologies like advanced packaging for AI chips and flexible electronics. The application of these tapes spans a wide range of electronic components, from tiny surface-mount devices (SMDs) to larger, more complex integrated circuits. Performance metrics such as volume resistivity, surface resistivity, and compliance with industry standards like EIA-481 are critical selling points.
Key Drivers, Barriers & Challenges in Stamped Carrier Tape
Key Drivers:
- Exponential Growth of Electronics Industry: The relentless expansion of consumer electronics, automotive, telecommunications, and industrial automation sectors is the primary growth engine.
- Miniaturization and High-Density Packaging: The trend towards smaller, more powerful electronic devices necessitates precise and reliable packaging solutions offered by stamped carrier tapes.
- Advancements in Semiconductor Technology: The development of sophisticated semiconductors requires specialized carrier tapes with enhanced ESD protection and thermal resistance.
- Increasing Automation in Manufacturing: The reliance on high-speed automated pick-and-place machines mandates carrier tapes with excellent dimensional stability and consistency.
Barriers & Challenges:
- Supply Chain Volatility: Fluctuations in raw material prices (e.g., polymers) and availability can impact production costs and lead times.
- Intense Price Competition: The market is characterized by significant price competition, putting pressure on profit margins, especially for standard tape types.
- Stringent Quality and Compliance Standards: Meeting evolving industry standards for ESD, cleanliness, and material purity adds to manufacturing complexity and cost.
- Development of Alternative Packaging Solutions: While established, carrier tapes face potential competition from emerging packaging technologies. For example, if a breakthrough in direct chip attachment without individual component packaging were to occur, it could significantly impact demand, though this is a long-term, low-probability scenario. The impact of this challenge is currently estimated to be a potential reduction in market growth by 0.5-1% annually if such technologies mature rapidly.
Emerging Opportunities in Stamped Carrier Tape
Emerging opportunities in the stamped carrier tape market are closely tied to the rapid evolution of key technology sectors. The burgeoning demand for advanced semiconductor packaging solutions for artificial intelligence (AI) and machine learning (ML) applications presents a significant growth avenue. Furthermore, the expansion of the Internet of Things (IoT) ecosystem, with its vast array of connected devices, is creating a need for specialized carrier tapes that can accommodate diverse component sizes and stringent reliability requirements. The growth of electric vehicles (EVs) and autonomous driving technologies is also a key opportunity, as these sectors require highly reliable and robust electronic components, thus driving demand for premium carrier tapes. Emerging markets in Southeast Asia and parts of Africa, as they further develop their electronics manufacturing capabilities, also represent untapped potential for market expansion.
Growth Accelerators in the Stamped Carrier Tape Industry
Several factors are acting as significant growth accelerators for the stamped carrier tape industry. Technological breakthroughs in polymer science are enabling the development of carrier tapes with superior ESD performance, higher temperature resistance, and improved environmental sustainability, appealing to a growing eco-conscious market. Strategic partnerships and collaborations between carrier tape manufacturers and semiconductor device makers are crucial for co-developing customized packaging solutions that meet the precise needs of next-generation components. Market expansion strategies, including the penetration into new geographical regions with developing electronics industries and the diversification of product offerings to cater to niche applications, are also vital accelerators. The increasing adoption of advanced automation in electronics manufacturing, which relies heavily on the consistent quality and performance of carrier tapes, further fuels this growth.
Key Players Shaping the Stamped Carrier Tape Market
- 3M
- ZheJiang Jiemei
- Advantek
- Shin-Etsu
- Lasertek
- U-PAK
- ROTHE
- C-Pak
- Oji F-Tex Co., Ltd.
- Accu Tech Plastics
- Asahi Kasei
- ACTECH
- Ant Group (Acupaq)
- Advanced Component Taping
- Argosy Inc.
Notable Milestones in Stamped Carrier Tape Sector
- 2019: Introduction of enhanced ESD protection polymers for carrier tapes by 3M, improving component safety in humid environments.
- 2020: Advantek expands its manufacturing capacity for high-precision polycarbonate carrier tapes to meet growing demand from the automotive sector.
- 2021: Shin-Etsu develops a new generation of anti-static carrier tapes with significantly longer-lasting conductive properties.
- 2022: ZheJiang Jiemei acquires a smaller competitor, strengthening its market position in China and expanding its product portfolio.
- 2023: Oji F-Tex Co., Ltd. launches a range of carrier tapes made from recycled PET, aligning with increasing sustainability demands.
- 2024: Several key players report significant order increases driven by the surge in AI chip manufacturing, indicating a robust market outlook.
In-Depth Stamped Carrier Tape Market Outlook
The outlook for the stamped carrier tape market remains exceptionally positive, with growth accelerators pointing towards sustained expansion. The increasing complexity of electronic components, coupled with the ongoing trend of miniaturization across all sectors, will continue to drive demand for high-performance and precisely manufactured carrier tapes. The market is expected to see significant contributions from the automotive sector, particularly with the rise of electric vehicles and advanced driver-assistance systems, which require robust and reliable packaging for their electronic components. Furthermore, the proliferation of IoT devices and the growing demand for AI-powered solutions will create new opportunities for specialized carrier tapes. Strategic investments in research and development for advanced materials and manufacturing processes will be crucial for market players to maintain a competitive edge and capture emerging market segments. The overall market potential is projected to reach approximately $3,000 million by 2033, underscoring a promising future for the stamped carrier tape industry.
Stamped Carrier Tape Segmentation
-
1. Application
- 1.1. Active Components
- 1.2. Passive Components
-
2. Type
- 2.1. Polystyrene Carrier Tape
- 2.2. Polycarbonate Carrier Tape
- 2.3. Polyethylene Terephthalate Carrier Tape
- 2.4. Polyvinyl Chloride Carrier Tape
- 2.5. Other
Stamped Carrier Tape Segmentation By Geography
-
1. North America
- 1.1. United States
- 1.2. Canada
- 1.3. Mexico
-
2. South America
- 2.1. Brazil
- 2.2. Argentina
- 2.3. Rest of South America
-
3. Europe
- 3.1. United Kingdom
- 3.2. Germany
- 3.3. France
- 3.4. Italy
- 3.5. Spain
- 3.6. Russia
- 3.7. Benelux
- 3.8. Nordics
- 3.9. Rest of Europe
-
4. Middle East & Africa
- 4.1. Turkey
- 4.2. Israel
- 4.3. GCC
- 4.4. North Africa
- 4.5. South Africa
- 4.6. Rest of Middle East & Africa
-
5. Asia Pacific
- 5.1. China
- 5.2. India
- 5.3. Japan
- 5.4. South Korea
- 5.5. ASEAN
- 5.6. Oceania
- 5.7. Rest of Asia Pacific
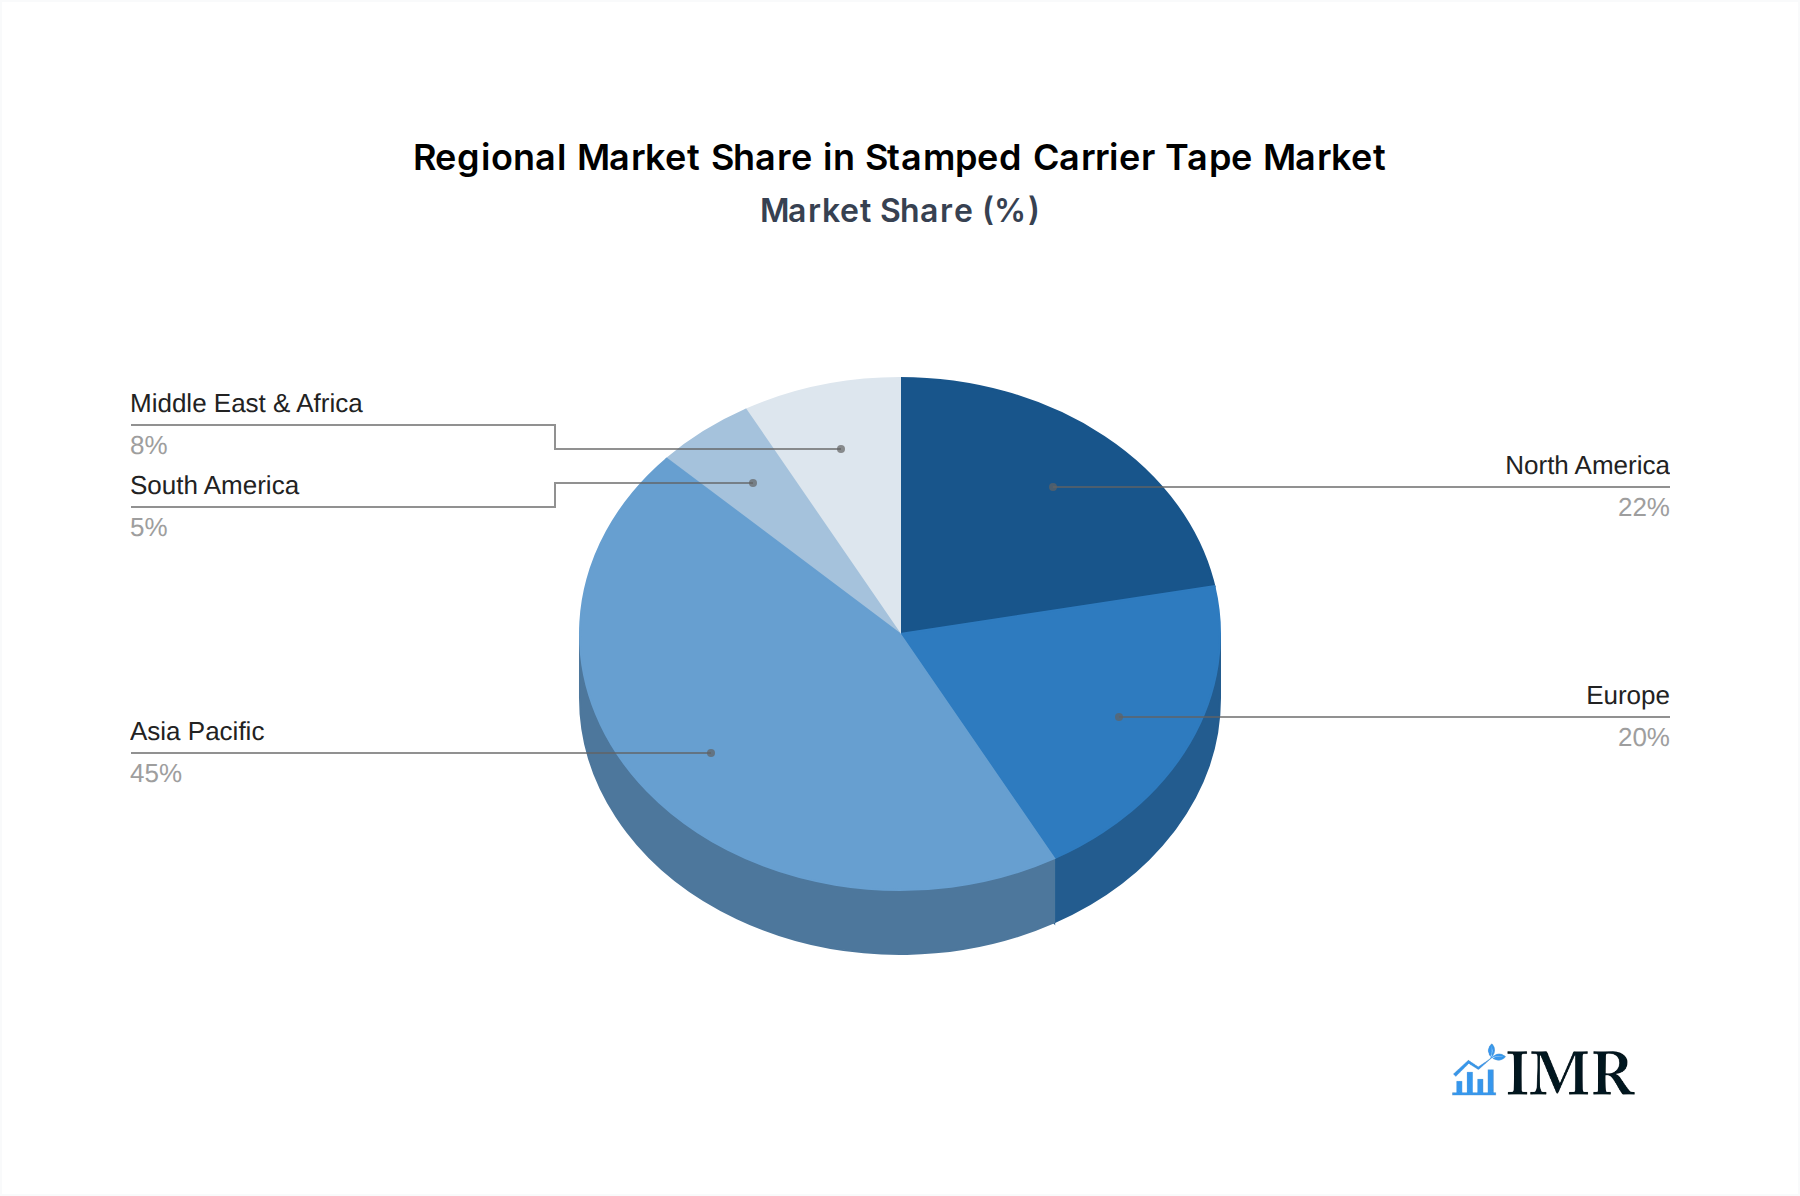
Stamped Carrier Tape Regional Market Share
Geographic Coverage of Stamped Carrier Tape
Stamped Carrier Tape REPORT HIGHLIGHTS
| Aspects | Details |
|---|---|
| Study Period | 2020-2034 |
| Base Year | 2025 |
| Estimated Year | 2026 |
| Forecast Period | 2026-2034 |
| Historical Period | 2020-2025 |
| Growth Rate | CAGR of 5.5% from 2020-2034 |
| Segmentation |
|
Table of Contents
- 1. Introduction
- 1.1. Research Scope
- 1.2. Market Segmentation
- 1.3. Research Objective
- 1.4. Definitions and Assumptions
- 2. Executive Summary
- 2.1. Market Snapshot
- 3. Market Dynamics
- 3.1. Market Drivers
- 3.2. Market Restrains
- 3.3. Market Trends
- 3.4. Market Opportunities
- 4. Market Factor Analysis
- 4.1. Porters Five Forces
- 4.1.1. Bargaining Power of Suppliers
- 4.1.2. Bargaining Power of Buyers
- 4.1.3. Threat of New Entrants
- 4.1.4. Threat of Substitutes
- 4.1.5. Competitive Rivalry
- 4.2. PESTEL analysis
- 4.3. BCG Analysis
- 4.3.1. Stars (High Growth, High Market Share)
- 4.3.2. Cash Cows (Low Growth, High Market Share)
- 4.3.3. Question Mark (High Growth, Low Market Share)
- 4.3.4. Dogs (Low Growth, Low Market Share)
- 4.4. Ansoff Matrix Analysis
- 4.5. Supply Chain Analysis
- 4.6. Regulatory Landscape
- 4.7. Current Market Potential and Opportunity Assessment (TAM–SAM–SOM Framework)
- 4.8. IMR Analyst Note
- 4.1. Porters Five Forces
- 5. Market Analysis, Insights and Forecast 2021-2033
- 5.1. Market Analysis, Insights and Forecast - by Application
- 5.1.1. Active Components
- 5.1.2. Passive Components
- 5.2. Market Analysis, Insights and Forecast - by Type
- 5.2.1. Polystyrene Carrier Tape
- 5.2.2. Polycarbonate Carrier Tape
- 5.2.3. Polyethylene Terephthalate Carrier Tape
- 5.2.4. Polyvinyl Chloride Carrier Tape
- 5.2.5. Other
- 5.3. Market Analysis, Insights and Forecast - by Region
- 5.3.1. North America
- 5.3.2. South America
- 5.3.3. Europe
- 5.3.4. Middle East & Africa
- 5.3.5. Asia Pacific
- 5.1. Market Analysis, Insights and Forecast - by Application
- 6. Global Stamped Carrier Tape Analysis, Insights and Forecast, 2021-2033
- 6.1. Market Analysis, Insights and Forecast - by Application
- 6.1.1. Active Components
- 6.1.2. Passive Components
- 6.2. Market Analysis, Insights and Forecast - by Type
- 6.2.1. Polystyrene Carrier Tape
- 6.2.2. Polycarbonate Carrier Tape
- 6.2.3. Polyethylene Terephthalate Carrier Tape
- 6.2.4. Polyvinyl Chloride Carrier Tape
- 6.2.5. Other
- 6.1. Market Analysis, Insights and Forecast - by Application
- 7. North America Stamped Carrier Tape Analysis, Insights and Forecast, 2020-2032
- 7.1. Market Analysis, Insights and Forecast - by Application
- 7.1.1. Active Components
- 7.1.2. Passive Components
- 7.2. Market Analysis, Insights and Forecast - by Type
- 7.2.1. Polystyrene Carrier Tape
- 7.2.2. Polycarbonate Carrier Tape
- 7.2.3. Polyethylene Terephthalate Carrier Tape
- 7.2.4. Polyvinyl Chloride Carrier Tape
- 7.2.5. Other
- 7.1. Market Analysis, Insights and Forecast - by Application
- 8. South America Stamped Carrier Tape Analysis, Insights and Forecast, 2020-2032
- 8.1. Market Analysis, Insights and Forecast - by Application
- 8.1.1. Active Components
- 8.1.2. Passive Components
- 8.2. Market Analysis, Insights and Forecast - by Type
- 8.2.1. Polystyrene Carrier Tape
- 8.2.2. Polycarbonate Carrier Tape
- 8.2.3. Polyethylene Terephthalate Carrier Tape
- 8.2.4. Polyvinyl Chloride Carrier Tape
- 8.2.5. Other
- 8.1. Market Analysis, Insights and Forecast - by Application
- 9. Europe Stamped Carrier Tape Analysis, Insights and Forecast, 2020-2032
- 9.1. Market Analysis, Insights and Forecast - by Application
- 9.1.1. Active Components
- 9.1.2. Passive Components
- 9.2. Market Analysis, Insights and Forecast - by Type
- 9.2.1. Polystyrene Carrier Tape
- 9.2.2. Polycarbonate Carrier Tape
- 9.2.3. Polyethylene Terephthalate Carrier Tape
- 9.2.4. Polyvinyl Chloride Carrier Tape
- 9.2.5. Other
- 9.1. Market Analysis, Insights and Forecast - by Application
- 10. Middle East & Africa Stamped Carrier Tape Analysis, Insights and Forecast, 2020-2032
- 10.1. Market Analysis, Insights and Forecast - by Application
- 10.1.1. Active Components
- 10.1.2. Passive Components
- 10.2. Market Analysis, Insights and Forecast - by Type
- 10.2.1. Polystyrene Carrier Tape
- 10.2.2. Polycarbonate Carrier Tape
- 10.2.3. Polyethylene Terephthalate Carrier Tape
- 10.2.4. Polyvinyl Chloride Carrier Tape
- 10.2.5. Other
- 10.1. Market Analysis, Insights and Forecast - by Application
- 11. Asia Pacific Stamped Carrier Tape Analysis, Insights and Forecast, 2020-2032
- 11.1. Market Analysis, Insights and Forecast - by Application
- 11.1.1. Active Components
- 11.1.2. Passive Components
- 11.2. Market Analysis, Insights and Forecast - by Type
- 11.2.1. Polystyrene Carrier Tape
- 11.2.2. Polycarbonate Carrier Tape
- 11.2.3. Polyethylene Terephthalate Carrier Tape
- 11.2.4. Polyvinyl Chloride Carrier Tape
- 11.2.5. Other
- 11.1. Market Analysis, Insights and Forecast - by Application
- 12. Competitive Analysis
- 12.1. Company Profiles
- 12.1.1 3M
- 12.1.1.1. Company Overview
- 12.1.1.2. Products
- 12.1.1.3. Company Financials
- 12.1.1.4. SWOT Analysis
- 12.1.2 ZheJiang Jiemei
- 12.1.2.1. Company Overview
- 12.1.2.2. Products
- 12.1.2.3. Company Financials
- 12.1.2.4. SWOT Analysis
- 12.1.3 Advantek
- 12.1.3.1. Company Overview
- 12.1.3.2. Products
- 12.1.3.3. Company Financials
- 12.1.3.4. SWOT Analysis
- 12.1.4 Shin-Etsu
- 12.1.4.1. Company Overview
- 12.1.4.2. Products
- 12.1.4.3. Company Financials
- 12.1.4.4. SWOT Analysis
- 12.1.5 Lasertek
- 12.1.5.1. Company Overview
- 12.1.5.2. Products
- 12.1.5.3. Company Financials
- 12.1.5.4. SWOT Analysis
- 12.1.6 U-PAK
- 12.1.6.1. Company Overview
- 12.1.6.2. Products
- 12.1.6.3. Company Financials
- 12.1.6.4. SWOT Analysis
- 12.1.7 ROTHE
- 12.1.7.1. Company Overview
- 12.1.7.2. Products
- 12.1.7.3. Company Financials
- 12.1.7.4. SWOT Analysis
- 12.1.8 C-Pak
- 12.1.8.1. Company Overview
- 12.1.8.2. Products
- 12.1.8.3. Company Financials
- 12.1.8.4. SWOT Analysis
- 12.1.9 Oji F-Tex Co. Ltd.
- 12.1.9.1. Company Overview
- 12.1.9.2. Products
- 12.1.9.3. Company Financials
- 12.1.9.4. SWOT Analysis
- 12.1.10 Accu Tech Plastics
- 12.1.10.1. Company Overview
- 12.1.10.2. Products
- 12.1.10.3. Company Financials
- 12.1.10.4. SWOT Analysis
- 12.1.11 Asahi Kasei
- 12.1.11.1. Company Overview
- 12.1.11.2. Products
- 12.1.11.3. Company Financials
- 12.1.11.4. SWOT Analysis
- 12.1.12 ACTECH
- 12.1.12.1. Company Overview
- 12.1.12.2. Products
- 12.1.12.3. Company Financials
- 12.1.12.4. SWOT Analysis
- 12.1.13 Ant Group (Acupaq)
- 12.1.13.1. Company Overview
- 12.1.13.2. Products
- 12.1.13.3. Company Financials
- 12.1.13.4. SWOT Analysis
- 12.1.14 Advanced Component Taping
- 12.1.14.1. Company Overview
- 12.1.14.2. Products
- 12.1.14.3. Company Financials
- 12.1.14.4. SWOT Analysis
- 12.1.15 Argosy Inc.
- 12.1.15.1. Company Overview
- 12.1.15.2. Products
- 12.1.15.3. Company Financials
- 12.1.15.4. SWOT Analysis
- 12.1.1 3M
- 12.2. Market Entropy
- 12.2.1 Company's Key Areas Served
- 12.2.2 Recent Developments
- 12.3. Company Market Share Analysis 2025
- 12.3.1 Top 5 Companies Market Share Analysis
- 12.3.2 Top 3 Companies Market Share Analysis
- 12.4. List of Potential Customers
- 13. Research Methodology
List of Figures
- Figure 1: Global Stamped Carrier Tape Revenue Breakdown (million, %) by Region 2025 & 2033
- Figure 2: North America Stamped Carrier Tape Revenue (million), by Application 2025 & 2033
- Figure 3: North America Stamped Carrier Tape Revenue Share (%), by Application 2025 & 2033
- Figure 4: North America Stamped Carrier Tape Revenue (million), by Type 2025 & 2033
- Figure 5: North America Stamped Carrier Tape Revenue Share (%), by Type 2025 & 2033
- Figure 6: North America Stamped Carrier Tape Revenue (million), by Country 2025 & 2033
- Figure 7: North America Stamped Carrier Tape Revenue Share (%), by Country 2025 & 2033
- Figure 8: South America Stamped Carrier Tape Revenue (million), by Application 2025 & 2033
- Figure 9: South America Stamped Carrier Tape Revenue Share (%), by Application 2025 & 2033
- Figure 10: South America Stamped Carrier Tape Revenue (million), by Type 2025 & 2033
- Figure 11: South America Stamped Carrier Tape Revenue Share (%), by Type 2025 & 2033
- Figure 12: South America Stamped Carrier Tape Revenue (million), by Country 2025 & 2033
- Figure 13: South America Stamped Carrier Tape Revenue Share (%), by Country 2025 & 2033
- Figure 14: Europe Stamped Carrier Tape Revenue (million), by Application 2025 & 2033
- Figure 15: Europe Stamped Carrier Tape Revenue Share (%), by Application 2025 & 2033
- Figure 16: Europe Stamped Carrier Tape Revenue (million), by Type 2025 & 2033
- Figure 17: Europe Stamped Carrier Tape Revenue Share (%), by Type 2025 & 2033
- Figure 18: Europe Stamped Carrier Tape Revenue (million), by Country 2025 & 2033
- Figure 19: Europe Stamped Carrier Tape Revenue Share (%), by Country 2025 & 2033
- Figure 20: Middle East & Africa Stamped Carrier Tape Revenue (million), by Application 2025 & 2033
- Figure 21: Middle East & Africa Stamped Carrier Tape Revenue Share (%), by Application 2025 & 2033
- Figure 22: Middle East & Africa Stamped Carrier Tape Revenue (million), by Type 2025 & 2033
- Figure 23: Middle East & Africa Stamped Carrier Tape Revenue Share (%), by Type 2025 & 2033
- Figure 24: Middle East & Africa Stamped Carrier Tape Revenue (million), by Country 2025 & 2033
- Figure 25: Middle East & Africa Stamped Carrier Tape Revenue Share (%), by Country 2025 & 2033
- Figure 26: Asia Pacific Stamped Carrier Tape Revenue (million), by Application 2025 & 2033
- Figure 27: Asia Pacific Stamped Carrier Tape Revenue Share (%), by Application 2025 & 2033
- Figure 28: Asia Pacific Stamped Carrier Tape Revenue (million), by Type 2025 & 2033
- Figure 29: Asia Pacific Stamped Carrier Tape Revenue Share (%), by Type 2025 & 2033
- Figure 30: Asia Pacific Stamped Carrier Tape Revenue (million), by Country 2025 & 2033
- Figure 31: Asia Pacific Stamped Carrier Tape Revenue Share (%), by Country 2025 & 2033
List of Tables
- Table 1: Global Stamped Carrier Tape Revenue million Forecast, by Application 2020 & 2033
- Table 2: Global Stamped Carrier Tape Revenue million Forecast, by Type 2020 & 2033
- Table 3: Global Stamped Carrier Tape Revenue million Forecast, by Region 2020 & 2033
- Table 4: Global Stamped Carrier Tape Revenue million Forecast, by Application 2020 & 2033
- Table 5: Global Stamped Carrier Tape Revenue million Forecast, by Type 2020 & 2033
- Table 6: Global Stamped Carrier Tape Revenue million Forecast, by Country 2020 & 2033
- Table 7: United States Stamped Carrier Tape Revenue (million) Forecast, by Application 2020 & 2033
- Table 8: Canada Stamped Carrier Tape Revenue (million) Forecast, by Application 2020 & 2033
- Table 9: Mexico Stamped Carrier Tape Revenue (million) Forecast, by Application 2020 & 2033
- Table 10: Global Stamped Carrier Tape Revenue million Forecast, by Application 2020 & 2033
- Table 11: Global Stamped Carrier Tape Revenue million Forecast, by Type 2020 & 2033
- Table 12: Global Stamped Carrier Tape Revenue million Forecast, by Country 2020 & 2033
- Table 13: Brazil Stamped Carrier Tape Revenue (million) Forecast, by Application 2020 & 2033
- Table 14: Argentina Stamped Carrier Tape Revenue (million) Forecast, by Application 2020 & 2033
- Table 15: Rest of South America Stamped Carrier Tape Revenue (million) Forecast, by Application 2020 & 2033
- Table 16: Global Stamped Carrier Tape Revenue million Forecast, by Application 2020 & 2033
- Table 17: Global Stamped Carrier Tape Revenue million Forecast, by Type 2020 & 2033
- Table 18: Global Stamped Carrier Tape Revenue million Forecast, by Country 2020 & 2033
- Table 19: United Kingdom Stamped Carrier Tape Revenue (million) Forecast, by Application 2020 & 2033
- Table 20: Germany Stamped Carrier Tape Revenue (million) Forecast, by Application 2020 & 2033
- Table 21: France Stamped Carrier Tape Revenue (million) Forecast, by Application 2020 & 2033
- Table 22: Italy Stamped Carrier Tape Revenue (million) Forecast, by Application 2020 & 2033
- Table 23: Spain Stamped Carrier Tape Revenue (million) Forecast, by Application 2020 & 2033
- Table 24: Russia Stamped Carrier Tape Revenue (million) Forecast, by Application 2020 & 2033
- Table 25: Benelux Stamped Carrier Tape Revenue (million) Forecast, by Application 2020 & 2033
- Table 26: Nordics Stamped Carrier Tape Revenue (million) Forecast, by Application 2020 & 2033
- Table 27: Rest of Europe Stamped Carrier Tape Revenue (million) Forecast, by Application 2020 & 2033
- Table 28: Global Stamped Carrier Tape Revenue million Forecast, by Application 2020 & 2033
- Table 29: Global Stamped Carrier Tape Revenue million Forecast, by Type 2020 & 2033
- Table 30: Global Stamped Carrier Tape Revenue million Forecast, by Country 2020 & 2033
- Table 31: Turkey Stamped Carrier Tape Revenue (million) Forecast, by Application 2020 & 2033
- Table 32: Israel Stamped Carrier Tape Revenue (million) Forecast, by Application 2020 & 2033
- Table 33: GCC Stamped Carrier Tape Revenue (million) Forecast, by Application 2020 & 2033
- Table 34: North Africa Stamped Carrier Tape Revenue (million) Forecast, by Application 2020 & 2033
- Table 35: South Africa Stamped Carrier Tape Revenue (million) Forecast, by Application 2020 & 2033
- Table 36: Rest of Middle East & Africa Stamped Carrier Tape Revenue (million) Forecast, by Application 2020 & 2033
- Table 37: Global Stamped Carrier Tape Revenue million Forecast, by Application 2020 & 2033
- Table 38: Global Stamped Carrier Tape Revenue million Forecast, by Type 2020 & 2033
- Table 39: Global Stamped Carrier Tape Revenue million Forecast, by Country 2020 & 2033
- Table 40: China Stamped Carrier Tape Revenue (million) Forecast, by Application 2020 & 2033
- Table 41: India Stamped Carrier Tape Revenue (million) Forecast, by Application 2020 & 2033
- Table 42: Japan Stamped Carrier Tape Revenue (million) Forecast, by Application 2020 & 2033
- Table 43: South Korea Stamped Carrier Tape Revenue (million) Forecast, by Application 2020 & 2033
- Table 44: ASEAN Stamped Carrier Tape Revenue (million) Forecast, by Application 2020 & 2033
- Table 45: Oceania Stamped Carrier Tape Revenue (million) Forecast, by Application 2020 & 2033
- Table 46: Rest of Asia Pacific Stamped Carrier Tape Revenue (million) Forecast, by Application 2020 & 2033
Frequently Asked Questions
1. What is the projected Compound Annual Growth Rate (CAGR) of the Stamped Carrier Tape?
The projected CAGR is approximately 5.5%.
2. Which companies are prominent players in the Stamped Carrier Tape?
Key companies in the market include 3M, ZheJiang Jiemei, Advantek, Shin-Etsu, Lasertek, U-PAK, ROTHE, C-Pak, Oji F-Tex Co., Ltd., Accu Tech Plastics, Asahi Kasei, ACTECH, Ant Group (Acupaq), Advanced Component Taping, Argosy Inc..
3. What are the main segments of the Stamped Carrier Tape?
The market segments include Application, Type.
4. Can you provide details about the market size?
The market size is estimated to be USD 553 million as of 2022.
5. What are some drivers contributing to market growth?
N/A
6. What are the notable trends driving market growth?
N/A
7. Are there any restraints impacting market growth?
N/A
8. Can you provide examples of recent developments in the market?
N/A
9. What pricing options are available for accessing the report?
Pricing options include single-user, multi-user, and enterprise licenses priced at USD 2900.00, USD 4350.00, and USD 5800.00 respectively.
10. Is the market size provided in terms of value or volume?
The market size is provided in terms of value, measured in million.
11. Are there any specific market keywords associated with the report?
Yes, the market keyword associated with the report is "Stamped Carrier Tape," which aids in identifying and referencing the specific market segment covered.
12. How do I determine which pricing option suits my needs best?
The pricing options vary based on user requirements and access needs. Individual users may opt for single-user licenses, while businesses requiring broader access may choose multi-user or enterprise licenses for cost-effective access to the report.
13. Are there any additional resources or data provided in the Stamped Carrier Tape report?
While the report offers comprehensive insights, it's advisable to review the specific contents or supplementary materials provided to ascertain if additional resources or data are available.
14. How can I stay updated on further developments or reports in the Stamped Carrier Tape?
To stay informed about further developments, trends, and reports in the Stamped Carrier Tape, consider subscribing to industry newsletters, following relevant companies and organizations, or regularly checking reputable industry news sources and publications.
Methodology
Step 1 - Identification of Relevant Samples Size from Population Database


Step 2 - Approaches for Defining Global Market Size (Value, Volume* & Price*)

Note*: In applicable scenarios
Step 3 - Data Sources
Primary Research
- Web Analytics
- Survey Reports
- Research Institute
- Latest Research Reports
- Opinion Leaders
Secondary Research
- Annual Reports
- White Paper
- Latest Press Release
- Industry Association
- Paid Database
- Investor Presentations

Step 4 - Data Triangulation
Involves using different sources of information in order to increase the validity of a study
These sources are likely to be stakeholders in a program - participants, other researchers, program staff, other community members, and so on.
Then we put all data in single framework & apply various statistical tools to find out the dynamic on the market.
During the analysis stage, feedback from the stakeholder groups would be compared to determine areas of agreement as well as areas of divergence