

Key Insights
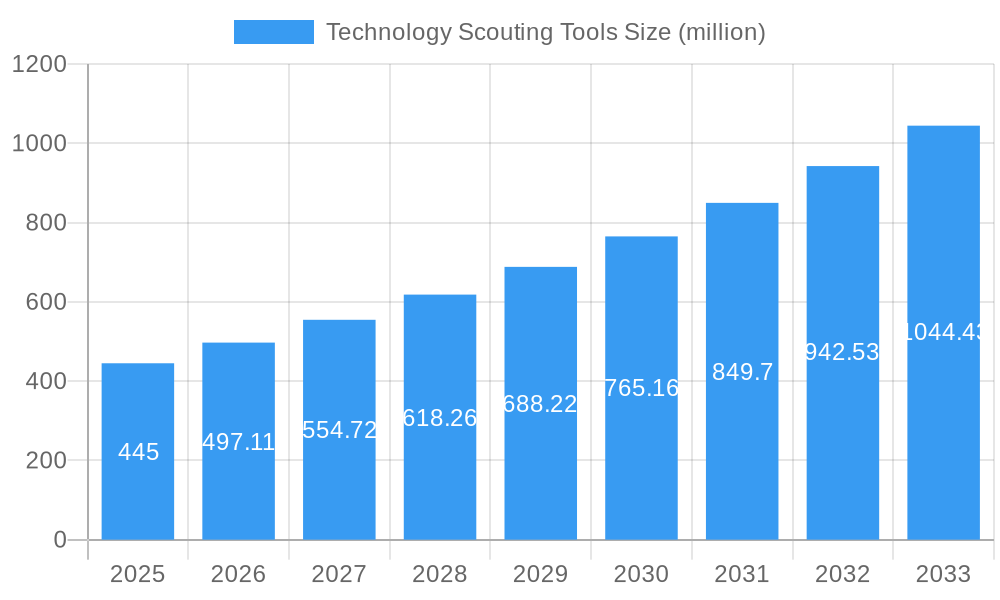
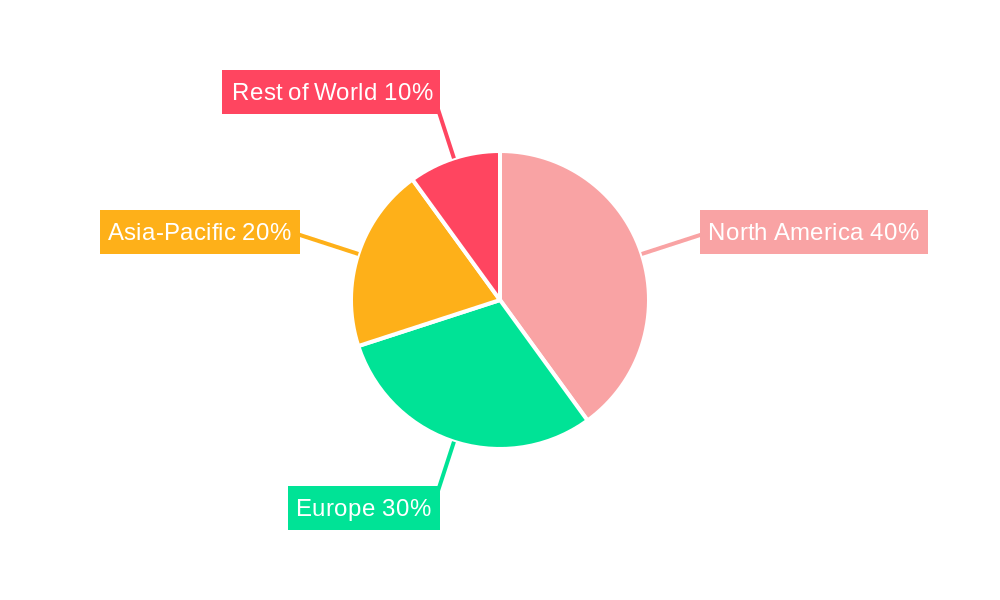
The technology scouting tools market, valued at $445 million in 2025, is projected to experience robust growth, driven by the increasing need for organizations to identify and assess emerging technologies for competitive advantage and innovation. The market's Compound Annual Growth Rate (CAGR) of 11.8% from 2025 to 2033 indicates a significant expansion, fueled by factors such as the rising adoption of digital transformation initiatives across various industries, the growing complexity of technological landscapes requiring specialized tools for efficient scouting, and the increasing need for faster time-to-market for new products and services. Key players like Wellspring, Ezassi, upBOARD, and others are actively shaping the market with their innovative solutions, fostering competition and driving further development in the field. The market is segmented by deployment mode (cloud-based and on-premise), by application (research & development, strategic planning, competitive intelligence), and by industry (pharmaceuticals, technology, automotive). While data on specific regional market shares is unavailable, it is anticipated that North America and Europe will dominate initially, given their established technological infrastructure and high adoption rates. However, growth in Asia-Pacific and other developing regions is likely to increase significantly over the forecast period. Potential restraints include the high cost of implementation, the complexity of integrating with existing systems, and a potential shortage of skilled professionals capable of effectively utilizing these advanced tools.
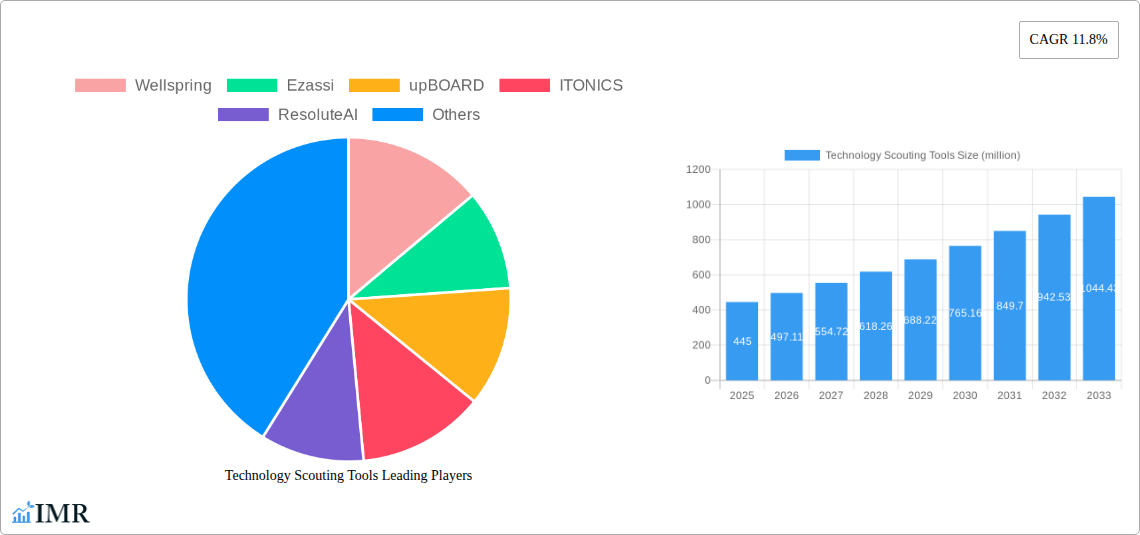
Technology Scouting Tools Market Size (In Million)
The substantial growth predicted for the technology scouting tools market reflects a wider industry trend towards proactive technological innovation. Companies are increasingly recognizing the importance of having a robust technology scouting strategy, not only for identifying disruptive technologies but also for understanding market trends, managing competitive threats, and fostering internal innovation. The continuous development of artificial intelligence (AI) and machine learning (ML) capabilities is likely to further enhance the functionalities and effectiveness of these tools, driving increased adoption across all industry sectors. The competitive landscape is dynamic, with both established players and emerging startups vying for market share, leading to innovation and improvements in pricing and accessibility of these crucial tools. This competitive environment benefits users by driving down costs and improving functionalities.
Technology Scouting Tools Company Market Share
Technology Scouting Tools Market Report: 2019-2033
This comprehensive report provides a detailed analysis of the Technology Scouting Tools market, encompassing market dynamics, growth trends, regional dominance, product landscape, key players, and future outlook. The study period spans from 2019 to 2033, with 2025 serving as the base and estimated year. The forecast period covers 2025-2033, while the historical period encompasses 2019-2024. The report caters to industry professionals, investors, and strategic decision-makers seeking in-depth insights into this rapidly evolving market. Parent markets include the broader technology and intelligence sectors, with child markets encompassing specific industry verticals leveraging technology scouting tools.
Technology Scouting Tools Market Dynamics & Structure
The Technology Scouting Tools market is characterized by moderate concentration, with key players holding significant market share. However, the entry of new innovative startups is increasing competition. Technological innovation, particularly in AI and machine learning, is a major driver, improving the efficiency and accuracy of scouting processes. Regulatory frameworks, particularly around data privacy and intellectual property, impact market operations. Competitive product substitutes include manual scouting and less sophisticated software solutions. End-user demographics comprise R&D departments, innovation teams, and strategic planning units across diverse industries. M&A activity has been moderate, with xx deals recorded between 2019 and 2024, indicating consolidation and expansion strategies amongst players.
- Market Concentration: Moderately concentrated, with the top 5 players holding approximately xx% market share in 2025.
- Innovation Drivers: AI, machine learning, big data analytics, improved data integration.
- Regulatory Impacts: Data privacy regulations (GDPR, CCPA), IP protection laws.
- Competitive Substitutes: Manual scouting methods, basic research databases.
- End-User Demographics: R&D departments, innovation teams, strategic planning units (across various industries).
- M&A Activity: xx deals from 2019-2024, xx projected for 2025-2033.
Technology Scouting Tools Growth Trends & Insights
The Technology Scouting Tools market experienced significant growth from 2019 to 2024, with a CAGR of xx%. This growth is driven by increasing R&D investments, a growing emphasis on innovation, and the need for efficient technology identification. The market size reached $xx million in 2024 and is projected to reach $xx million by 2033, exhibiting a CAGR of xx% during the forecast period. Market penetration remains relatively low, suggesting significant growth potential. Technological disruptions, such as advancements in natural language processing and improved data visualization, are enhancing the capabilities of these tools. Shifting consumer behavior towards data-driven decision-making further fuels market adoption.
Dominant Regions, Countries, or Segments in Technology Scouting Tools
North America currently dominates the Technology Scouting Tools market, holding approximately xx% of the global market share in 2025. This dominance stems from strong R&D investment, a high concentration of technology companies, and early adoption of advanced technologies. Europe and Asia-Pacific follow, with significant growth potential driven by increasing government initiatives promoting innovation and expanding technological capabilities. The pharmaceutical and technology sectors are leading adopters within specific industry segments.
- North America Dominance: Strong R&D investment, high technology density, early adoption.
- Europe Growth: Growing R&D spending, supportive government policies.
- Asia-Pacific Potential: Rapid economic growth, rising technological capabilities.
- Pharmaceutical & Technology: Leading industry segments driving adoption.
Technology Scouting Tools Product Landscape
The Technology Scouting Tools market offers diverse product types, ranging from basic patent search engines to sophisticated platforms integrating AI for advanced analysis. These tools provide comprehensive solutions for identifying emerging technologies, analyzing market trends, and tracking competitive landscapes. Unique selling propositions include advanced analytics, user-friendly interfaces, and seamless integration with existing workflows. Technological advancements focus on improved accuracy, enhanced data visualization, and predictive analytics capabilities.
Key Drivers, Barriers & Challenges in Technology Scouting Tools
Key Drivers:
- Rising R&D spending across various industries.
- Increased focus on open innovation and technology partnerships.
- Growing need for efficient technology identification and market intelligence.
Challenges:
- High initial investment costs associated with implementing these tools.
- Data security and privacy concerns related to handling sensitive information.
- Competition from established and emerging players.
Emerging Opportunities in Technology Scouting Tools
Emerging opportunities exist in untapped market segments, such as small and medium-sized enterprises (SMEs) and developing economies. The integration of technology scouting tools with other enterprise resource planning (ERP) systems also presents opportunities for growth. Innovative applications, such as predictive technology forecasting and early identification of disruptive technologies, promise to expand market adoption.
Growth Accelerators in the Technology Scouting Tools Industry
Long-term growth will be driven by continued technological advancements, especially in AI and machine learning. Strategic partnerships between technology providers and industry leaders will facilitate wider adoption. Expansion into new geographical markets and industry segments will unlock additional growth potential.
Key Players Shaping the Technology Scouting Tools Market
- Wellspring
- Ezassi
- upBOARD
- ITONICS
- ResoluteAI
- NetBase Quid
- Innography IP intelligence
- InnovationQ
- Lens
- Orbit Intelligence
- PatSnap Discovery
- Q-scout
Notable Milestones in Technology Scouting Tools Sector
- 2020: Launch of AI-powered technology scouting platform by Orbit Intelligence.
- 2021: Acquisition of a smaller technology scouting firm by PatSnap.
- 2022: Introduction of advanced data visualization features by Wellspring.
- 2023: Partnership between ITONICS and a major pharmaceutical company for joint R&D projects.
- 2024: Regulatory changes impacting data privacy in the EU influencing technology scouting operations.
In-Depth Technology Scouting Tools Market Outlook
The Technology Scouting Tools market is poised for substantial growth over the next decade. Continued technological advancements, strategic partnerships, and increasing awareness of the importance of technology scouting will fuel market expansion. The focus on AI-driven insights and enhanced user experience will drive adoption across various industry segments, resulting in a significant market expansion beyond the current projections.
Technology Scouting Tools Segmentation
-
1. Application
- 1.1. Large Enterprises
- 1.2. SMEs
-
2. Types
- 2.1. Cloud Based
- 2.2. On-Premises
Technology Scouting Tools Segmentation By Geography
-
1. North America
- 1.1. United States
- 1.2. Canada
- 1.3. Mexico
-
2. South America
- 2.1. Brazil
- 2.2. Argentina
- 2.3. Rest of South America
-
3. Europe
- 3.1. United Kingdom
- 3.2. Germany
- 3.3. France
- 3.4. Italy
- 3.5. Spain
- 3.6. Russia
- 3.7. Benelux
- 3.8. Nordics
- 3.9. Rest of Europe
-
4. Middle East & Africa
- 4.1. Turkey
- 4.2. Israel
- 4.3. GCC
- 4.4. North Africa
- 4.5. South Africa
- 4.6. Rest of Middle East & Africa
-
5. Asia Pacific
- 5.1. China
- 5.2. India
- 5.3. Japan
- 5.4. South Korea
- 5.5. ASEAN
- 5.6. Oceania
- 5.7. Rest of Asia Pacific
Technology Scouting Tools Regional Market Share
Geographic Coverage of Technology Scouting Tools
Technology Scouting Tools REPORT HIGHLIGHTS
| Aspects | Details |
|---|---|
| Study Period | 2020-2034 |
| Base Year | 2025 |
| Estimated Year | 2026 |
| Forecast Period | 2026-2034 |
| Historical Period | 2020-2025 |
| Growth Rate | CAGR of 11.8% from 2020-2034 |
| Segmentation |
|
Table of Contents
- 1. Introduction
- 1.1. Research Scope
- 1.2. Market Segmentation
- 1.3. Research Methodology
- 1.4. Definitions and Assumptions
- 2. Executive Summary
- 2.1. Introduction
- 3. Market Dynamics
- 3.1. Introduction
- 3.2. Market Drivers
- 3.3. Market Restrains
- 3.4. Market Trends
- 4. Market Factor Analysis
- 4.1. Porters Five Forces
- 4.2. Supply/Value Chain
- 4.3. PESTEL analysis
- 4.4. Market Entropy
- 4.5. Patent/Trademark Analysis
- 5. Global Technology Scouting Tools Analysis, Insights and Forecast, 2020-2032
- 5.1. Market Analysis, Insights and Forecast - by Application
- 5.1.1. Large Enterprises
- 5.1.2. SMEs
- 5.2. Market Analysis, Insights and Forecast - by Types
- 5.2.1. Cloud Based
- 5.2.2. On-Premises
- 5.3. Market Analysis, Insights and Forecast - by Region
- 5.3.1. North America
- 5.3.2. South America
- 5.3.3. Europe
- 5.3.4. Middle East & Africa
- 5.3.5. Asia Pacific
- 5.1. Market Analysis, Insights and Forecast - by Application
- 6. North America Technology Scouting Tools Analysis, Insights and Forecast, 2020-2032
- 6.1. Market Analysis, Insights and Forecast - by Application
- 6.1.1. Large Enterprises
- 6.1.2. SMEs
- 6.2. Market Analysis, Insights and Forecast - by Types
- 6.2.1. Cloud Based
- 6.2.2. On-Premises
- 6.1. Market Analysis, Insights and Forecast - by Application
- 7. South America Technology Scouting Tools Analysis, Insights and Forecast, 2020-2032
- 7.1. Market Analysis, Insights and Forecast - by Application
- 7.1.1. Large Enterprises
- 7.1.2. SMEs
- 7.2. Market Analysis, Insights and Forecast - by Types
- 7.2.1. Cloud Based
- 7.2.2. On-Premises
- 7.1. Market Analysis, Insights and Forecast - by Application
- 8. Europe Technology Scouting Tools Analysis, Insights and Forecast, 2020-2032
- 8.1. Market Analysis, Insights and Forecast - by Application
- 8.1.1. Large Enterprises
- 8.1.2. SMEs
- 8.2. Market Analysis, Insights and Forecast - by Types
- 8.2.1. Cloud Based
- 8.2.2. On-Premises
- 8.1. Market Analysis, Insights and Forecast - by Application
- 9. Middle East & Africa Technology Scouting Tools Analysis, Insights and Forecast, 2020-2032
- 9.1. Market Analysis, Insights and Forecast - by Application
- 9.1.1. Large Enterprises
- 9.1.2. SMEs
- 9.2. Market Analysis, Insights and Forecast - by Types
- 9.2.1. Cloud Based
- 9.2.2. On-Premises
- 9.1. Market Analysis, Insights and Forecast - by Application
- 10. Asia Pacific Technology Scouting Tools Analysis, Insights and Forecast, 2020-2032
- 10.1. Market Analysis, Insights and Forecast - by Application
- 10.1.1. Large Enterprises
- 10.1.2. SMEs
- 10.2. Market Analysis, Insights and Forecast - by Types
- 10.2.1. Cloud Based
- 10.2.2. On-Premises
- 10.1. Market Analysis, Insights and Forecast - by Application
- 11. Competitive Analysis
- 11.1. Global Market Share Analysis 2025
- 11.2. Company Profiles
- 11.2.1 Wellspring
- 11.2.1.1. Overview
- 11.2.1.2. Products
- 11.2.1.3. SWOT Analysis
- 11.2.1.4. Recent Developments
- 11.2.1.5. Financials (Based on Availability)
- 11.2.2 Ezassi
- 11.2.2.1. Overview
- 11.2.2.2. Products
- 11.2.2.3. SWOT Analysis
- 11.2.2.4. Recent Developments
- 11.2.2.5. Financials (Based on Availability)
- 11.2.3 upBOARD
- 11.2.3.1. Overview
- 11.2.3.2. Products
- 11.2.3.3. SWOT Analysis
- 11.2.3.4. Recent Developments
- 11.2.3.5. Financials (Based on Availability)
- 11.2.4 ITONICS
- 11.2.4.1. Overview
- 11.2.4.2. Products
- 11.2.4.3. SWOT Analysis
- 11.2.4.4. Recent Developments
- 11.2.4.5. Financials (Based on Availability)
- 11.2.5 ResoluteAI
- 11.2.5.1. Overview
- 11.2.5.2. Products
- 11.2.5.3. SWOT Analysis
- 11.2.5.4. Recent Developments
- 11.2.5.5. Financials (Based on Availability)
- 11.2.6 NetBase Quid
- 11.2.6.1. Overview
- 11.2.6.2. Products
- 11.2.6.3. SWOT Analysis
- 11.2.6.4. Recent Developments
- 11.2.6.5. Financials (Based on Availability)
- 11.2.7 Innography IP intelligence
- 11.2.7.1. Overview
- 11.2.7.2. Products
- 11.2.7.3. SWOT Analysis
- 11.2.7.4. Recent Developments
- 11.2.7.5. Financials (Based on Availability)
- 11.2.8 InnovationQ
- 11.2.8.1. Overview
- 11.2.8.2. Products
- 11.2.8.3. SWOT Analysis
- 11.2.8.4. Recent Developments
- 11.2.8.5. Financials (Based on Availability)
- 11.2.9 Lens
- 11.2.9.1. Overview
- 11.2.9.2. Products
- 11.2.9.3. SWOT Analysis
- 11.2.9.4. Recent Developments
- 11.2.9.5. Financials (Based on Availability)
- 11.2.10 Orbit Intelligence
- 11.2.10.1. Overview
- 11.2.10.2. Products
- 11.2.10.3. SWOT Analysis
- 11.2.10.4. Recent Developments
- 11.2.10.5. Financials (Based on Availability)
- 11.2.11 PatSnap Discovery
- 11.2.11.1. Overview
- 11.2.11.2. Products
- 11.2.11.3. SWOT Analysis
- 11.2.11.4. Recent Developments
- 11.2.11.5. Financials (Based on Availability)
- 11.2.12 Q-scout
- 11.2.12.1. Overview
- 11.2.12.2. Products
- 11.2.12.3. SWOT Analysis
- 11.2.12.4. Recent Developments
- 11.2.12.5. Financials (Based on Availability)
- 11.2.1 Wellspring
List of Figures
- Figure 1: Global Technology Scouting Tools Revenue Breakdown (million, %) by Region 2025 & 2033
- Figure 2: North America Technology Scouting Tools Revenue (million), by Application 2025 & 2033
- Figure 3: North America Technology Scouting Tools Revenue Share (%), by Application 2025 & 2033
- Figure 4: North America Technology Scouting Tools Revenue (million), by Types 2025 & 2033
- Figure 5: North America Technology Scouting Tools Revenue Share (%), by Types 2025 & 2033
- Figure 6: North America Technology Scouting Tools Revenue (million), by Country 2025 & 2033
- Figure 7: North America Technology Scouting Tools Revenue Share (%), by Country 2025 & 2033
- Figure 8: South America Technology Scouting Tools Revenue (million), by Application 2025 & 2033
- Figure 9: South America Technology Scouting Tools Revenue Share (%), by Application 2025 & 2033
- Figure 10: South America Technology Scouting Tools Revenue (million), by Types 2025 & 2033
- Figure 11: South America Technology Scouting Tools Revenue Share (%), by Types 2025 & 2033
- Figure 12: South America Technology Scouting Tools Revenue (million), by Country 2025 & 2033
- Figure 13: South America Technology Scouting Tools Revenue Share (%), by Country 2025 & 2033
- Figure 14: Europe Technology Scouting Tools Revenue (million), by Application 2025 & 2033
- Figure 15: Europe Technology Scouting Tools Revenue Share (%), by Application 2025 & 2033
- Figure 16: Europe Technology Scouting Tools Revenue (million), by Types 2025 & 2033
- Figure 17: Europe Technology Scouting Tools Revenue Share (%), by Types 2025 & 2033
- Figure 18: Europe Technology Scouting Tools Revenue (million), by Country 2025 & 2033
- Figure 19: Europe Technology Scouting Tools Revenue Share (%), by Country 2025 & 2033
- Figure 20: Middle East & Africa Technology Scouting Tools Revenue (million), by Application 2025 & 2033
- Figure 21: Middle East & Africa Technology Scouting Tools Revenue Share (%), by Application 2025 & 2033
- Figure 22: Middle East & Africa Technology Scouting Tools Revenue (million), by Types 2025 & 2033
- Figure 23: Middle East & Africa Technology Scouting Tools Revenue Share (%), by Types 2025 & 2033
- Figure 24: Middle East & Africa Technology Scouting Tools Revenue (million), by Country 2025 & 2033
- Figure 25: Middle East & Africa Technology Scouting Tools Revenue Share (%), by Country 2025 & 2033
- Figure 26: Asia Pacific Technology Scouting Tools Revenue (million), by Application 2025 & 2033
- Figure 27: Asia Pacific Technology Scouting Tools Revenue Share (%), by Application 2025 & 2033
- Figure 28: Asia Pacific Technology Scouting Tools Revenue (million), by Types 2025 & 2033
- Figure 29: Asia Pacific Technology Scouting Tools Revenue Share (%), by Types 2025 & 2033
- Figure 30: Asia Pacific Technology Scouting Tools Revenue (million), by Country 2025 & 2033
- Figure 31: Asia Pacific Technology Scouting Tools Revenue Share (%), by Country 2025 & 2033
List of Tables
- Table 1: Global Technology Scouting Tools Revenue million Forecast, by Application 2020 & 2033
- Table 2: Global Technology Scouting Tools Revenue million Forecast, by Types 2020 & 2033
- Table 3: Global Technology Scouting Tools Revenue million Forecast, by Region 2020 & 2033
- Table 4: Global Technology Scouting Tools Revenue million Forecast, by Application 2020 & 2033
- Table 5: Global Technology Scouting Tools Revenue million Forecast, by Types 2020 & 2033
- Table 6: Global Technology Scouting Tools Revenue million Forecast, by Country 2020 & 2033
- Table 7: United States Technology Scouting Tools Revenue (million) Forecast, by Application 2020 & 2033
- Table 8: Canada Technology Scouting Tools Revenue (million) Forecast, by Application 2020 & 2033
- Table 9: Mexico Technology Scouting Tools Revenue (million) Forecast, by Application 2020 & 2033
- Table 10: Global Technology Scouting Tools Revenue million Forecast, by Application 2020 & 2033
- Table 11: Global Technology Scouting Tools Revenue million Forecast, by Types 2020 & 2033
- Table 12: Global Technology Scouting Tools Revenue million Forecast, by Country 2020 & 2033
- Table 13: Brazil Technology Scouting Tools Revenue (million) Forecast, by Application 2020 & 2033
- Table 14: Argentina Technology Scouting Tools Revenue (million) Forecast, by Application 2020 & 2033
- Table 15: Rest of South America Technology Scouting Tools Revenue (million) Forecast, by Application 2020 & 2033
- Table 16: Global Technology Scouting Tools Revenue million Forecast, by Application 2020 & 2033
- Table 17: Global Technology Scouting Tools Revenue million Forecast, by Types 2020 & 2033
- Table 18: Global Technology Scouting Tools Revenue million Forecast, by Country 2020 & 2033
- Table 19: United Kingdom Technology Scouting Tools Revenue (million) Forecast, by Application 2020 & 2033
- Table 20: Germany Technology Scouting Tools Revenue (million) Forecast, by Application 2020 & 2033
- Table 21: France Technology Scouting Tools Revenue (million) Forecast, by Application 2020 & 2033
- Table 22: Italy Technology Scouting Tools Revenue (million) Forecast, by Application 2020 & 2033
- Table 23: Spain Technology Scouting Tools Revenue (million) Forecast, by Application 2020 & 2033
- Table 24: Russia Technology Scouting Tools Revenue (million) Forecast, by Application 2020 & 2033
- Table 25: Benelux Technology Scouting Tools Revenue (million) Forecast, by Application 2020 & 2033
- Table 26: Nordics Technology Scouting Tools Revenue (million) Forecast, by Application 2020 & 2033
- Table 27: Rest of Europe Technology Scouting Tools Revenue (million) Forecast, by Application 2020 & 2033
- Table 28: Global Technology Scouting Tools Revenue million Forecast, by Application 2020 & 2033
- Table 29: Global Technology Scouting Tools Revenue million Forecast, by Types 2020 & 2033
- Table 30: Global Technology Scouting Tools Revenue million Forecast, by Country 2020 & 2033
- Table 31: Turkey Technology Scouting Tools Revenue (million) Forecast, by Application 2020 & 2033
- Table 32: Israel Technology Scouting Tools Revenue (million) Forecast, by Application 2020 & 2033
- Table 33: GCC Technology Scouting Tools Revenue (million) Forecast, by Application 2020 & 2033
- Table 34: North Africa Technology Scouting Tools Revenue (million) Forecast, by Application 2020 & 2033
- Table 35: South Africa Technology Scouting Tools Revenue (million) Forecast, by Application 2020 & 2033
- Table 36: Rest of Middle East & Africa Technology Scouting Tools Revenue (million) Forecast, by Application 2020 & 2033
- Table 37: Global Technology Scouting Tools Revenue million Forecast, by Application 2020 & 2033
- Table 38: Global Technology Scouting Tools Revenue million Forecast, by Types 2020 & 2033
- Table 39: Global Technology Scouting Tools Revenue million Forecast, by Country 2020 & 2033
- Table 40: China Technology Scouting Tools Revenue (million) Forecast, by Application 2020 & 2033
- Table 41: India Technology Scouting Tools Revenue (million) Forecast, by Application 2020 & 2033
- Table 42: Japan Technology Scouting Tools Revenue (million) Forecast, by Application 2020 & 2033
- Table 43: South Korea Technology Scouting Tools Revenue (million) Forecast, by Application 2020 & 2033
- Table 44: ASEAN Technology Scouting Tools Revenue (million) Forecast, by Application 2020 & 2033
- Table 45: Oceania Technology Scouting Tools Revenue (million) Forecast, by Application 2020 & 2033
- Table 46: Rest of Asia Pacific Technology Scouting Tools Revenue (million) Forecast, by Application 2020 & 2033
Frequently Asked Questions
1. What is the projected Compound Annual Growth Rate (CAGR) of the Technology Scouting Tools?
The projected CAGR is approximately 11.8%.
2. Which companies are prominent players in the Technology Scouting Tools?
Key companies in the market include Wellspring, Ezassi, upBOARD, ITONICS, ResoluteAI, NetBase Quid, Innography IP intelligence, InnovationQ, Lens, Orbit Intelligence, PatSnap Discovery, Q-scout.
3. What are the main segments of the Technology Scouting Tools?
The market segments include Application, Types.
4. Can you provide details about the market size?
The market size is estimated to be USD 445 million as of 2022.
5. What are some drivers contributing to market growth?
N/A
6. What are the notable trends driving market growth?
N/A
7. Are there any restraints impacting market growth?
N/A
8. Can you provide examples of recent developments in the market?
N/A
9. What pricing options are available for accessing the report?
Pricing options include single-user, multi-user, and enterprise licenses priced at USD 4900.00, USD 7350.00, and USD 9800.00 respectively.
10. Is the market size provided in terms of value or volume?
The market size is provided in terms of value, measured in million.
11. Are there any specific market keywords associated with the report?
Yes, the market keyword associated with the report is "Technology Scouting Tools," which aids in identifying and referencing the specific market segment covered.
12. How do I determine which pricing option suits my needs best?
The pricing options vary based on user requirements and access needs. Individual users may opt for single-user licenses, while businesses requiring broader access may choose multi-user or enterprise licenses for cost-effective access to the report.
13. Are there any additional resources or data provided in the Technology Scouting Tools report?
While the report offers comprehensive insights, it's advisable to review the specific contents or supplementary materials provided to ascertain if additional resources or data are available.
14. How can I stay updated on further developments or reports in the Technology Scouting Tools?
To stay informed about further developments, trends, and reports in the Technology Scouting Tools, consider subscribing to industry newsletters, following relevant companies and organizations, or regularly checking reputable industry news sources and publications.
Methodology
Step 1 - Identification of Relevant Samples Size from Population Database


Step 2 - Approaches for Defining Global Market Size (Value, Volume* & Price*)

Note*: In applicable scenarios
Step 3 - Data Sources
Primary Research
- Web Analytics
- Survey Reports
- Research Institute
- Latest Research Reports
- Opinion Leaders
Secondary Research
- Annual Reports
- White Paper
- Latest Press Release
- Industry Association
- Paid Database
- Investor Presentations

Step 4 - Data Triangulation
Involves using different sources of information in order to increase the validity of a study
These sources are likely to be stakeholders in a program - participants, other researchers, program staff, other community members, and so on.
Then we put all data in single framework & apply various statistical tools to find out the dynamic on the market.
During the analysis stage, feedback from the stakeholder groups would be compared to determine areas of agreement as well as areas of divergence