

Key Insights
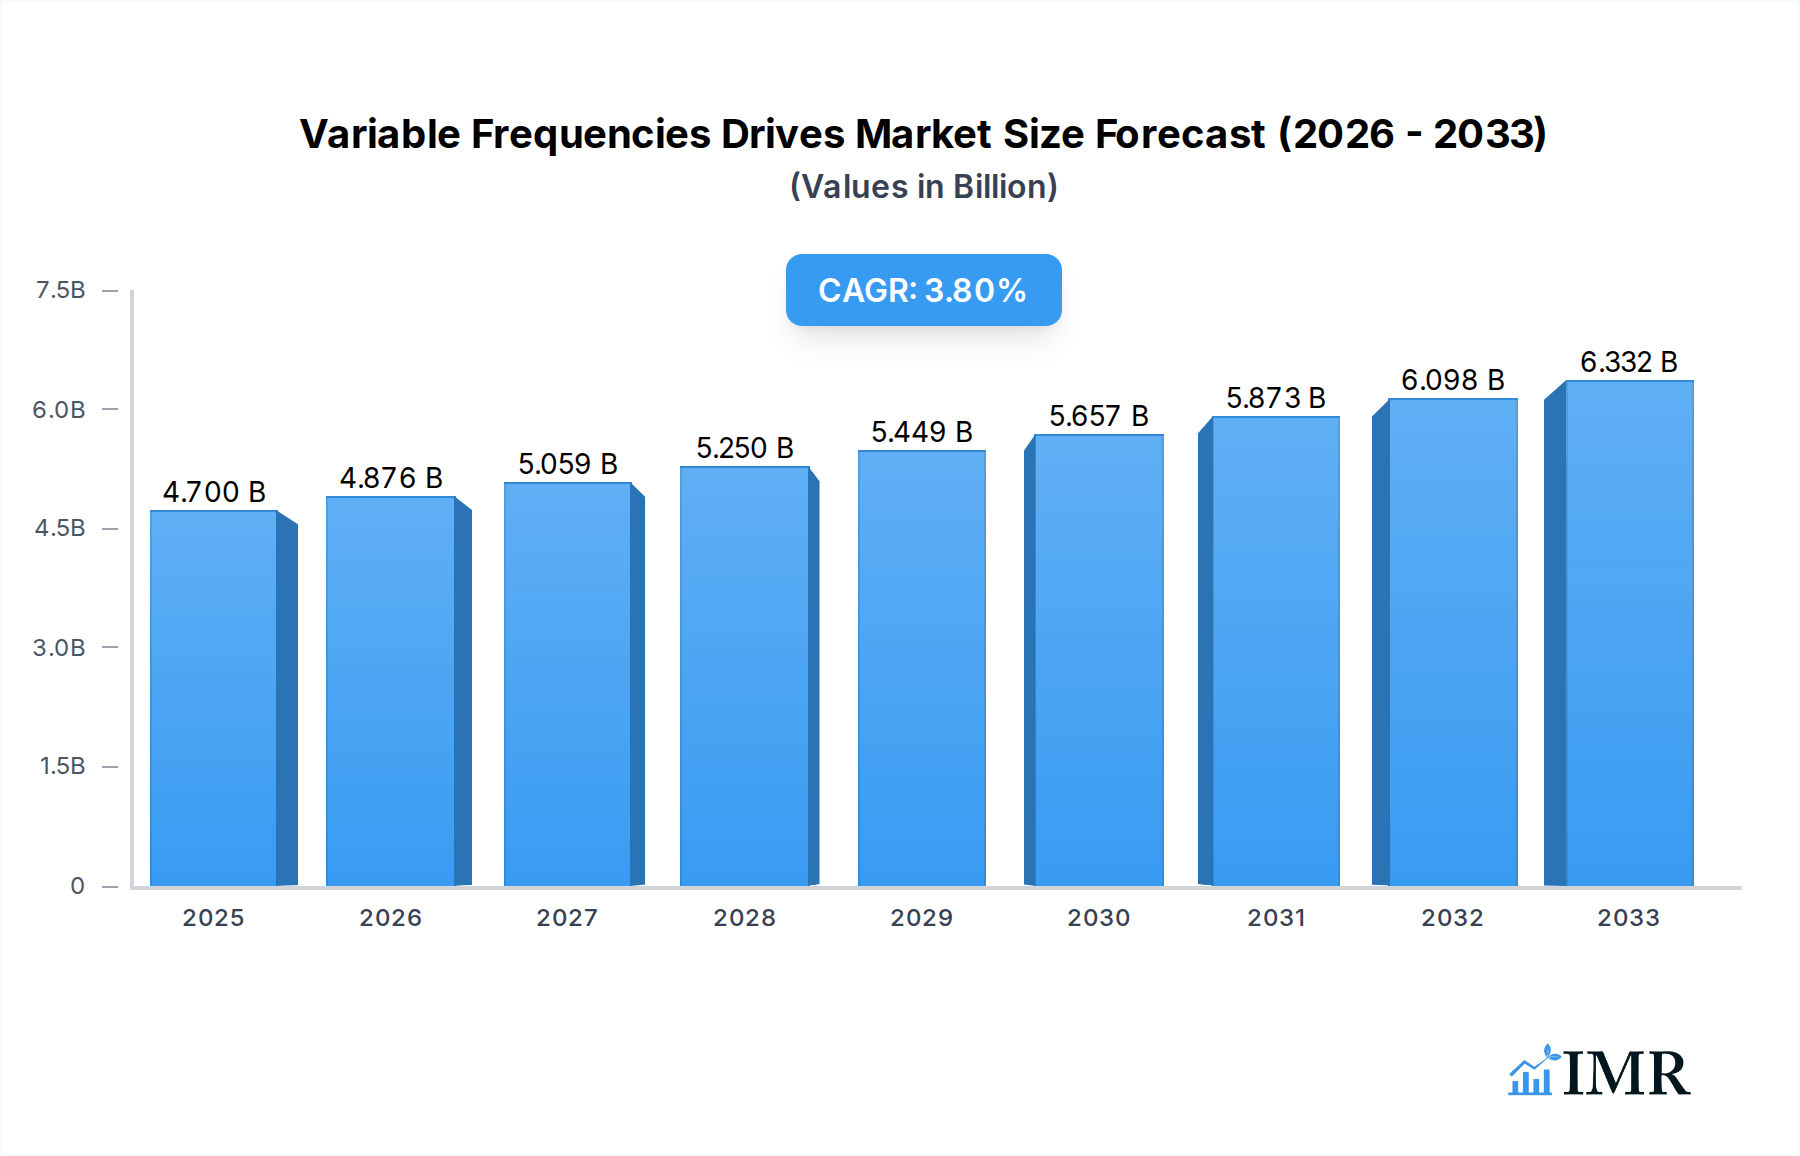
The global Variable Frequency Drives (VFDs) market is poised for significant growth, projected to reach $4.7 billion by 2025, with a compound annual growth rate (CAGR) of 3.7% during the forecast period of 2025-2033. This expansion is largely fueled by the escalating demand for energy efficiency across various industrial sectors. VFDs are instrumental in optimizing motor performance, leading to substantial reductions in energy consumption and operational costs. Key drivers include stringent government regulations promoting energy conservation, the increasing adoption of automation in manufacturing, and the growing industrialization in emerging economies. Industries such as pumps, fans, compressors, and conveyors are major consumers of VFDs, recognizing their capability to precisely control motor speed and torque, thereby enhancing process efficiency and equipment lifespan.

Variable Frequencies Drives Market Size (In Billion)
The market is witnessing dynamic trends, including the increasing integration of advanced technologies like the Internet of Things (IoT) and artificial intelligence (AI) into VFD systems for enhanced monitoring, predictive maintenance, and remote control. This technological convergence is paving the way for smarter and more connected industrial operations. The competitive landscape is characterized by the presence of major global players like ABB, Siemens, Schneider Electric, and Danfoss, who are continuously investing in research and development to introduce innovative products and expand their market reach. While the market exhibits a robust growth trajectory, certain restraints, such as the initial high cost of VFD installation and the need for skilled personnel for operation and maintenance, could pose challenges. However, the long-term benefits in terms of energy savings and improved productivity are expected to outweigh these initial hurdles, ensuring sustained market expansion.
Variable Frequencies Drives Company Market Share
Variable Frequencies Drives Market: Comprehensive Analysis and Future Outlook (2019–2033)
This in-depth report provides a definitive analysis of the global Variable Frequencies Drives (VFDs) market, offering critical insights for industry stakeholders. Spanning the historical period of 2019-2024 and projecting to 2033, with a base year of 2025, this research leverages extensive data to map market dynamics, growth trajectories, and future opportunities. Explore the competitive landscape, technological advancements, regional dominance, and the impact of key players shaping this vital sector.
Variable Frequencies Drives Market Dynamics & Structure
The global Variable Frequencies Drives (VFDs) market is characterized by a moderately concentrated structure, with leading players like ABB, Siemens, Schneider Electric, Danfoss, and Rockwell Automation holding significant market shares. Technological innovation is a primary driver, fueled by the demand for enhanced energy efficiency, process optimization, and automation across industries. Stringent energy conservation regulations worldwide are compelling industries to adopt VFDs for reducing energy consumption in motor-driven applications, thus acting as a significant regulatory driver. Competitive product substitutes, though present in niche applications, are largely outpaced by the superior performance and adaptability of VFDs in most scenarios. End-user demographics are increasingly diverse, encompassing industrial manufacturing, building automation, water and wastewater management, oil and gas, and renewable energy sectors. Mergers and acquisitions (M&A) are a notable trend, as larger entities seek to expand their product portfolios and geographical reach, and smaller innovative companies are acquired to integrate cutting-edge technologies. For instance, the M&A activity volume reached approximately $1.5 billion in 2023, indicating consolidation and strategic growth. Barriers to innovation, while present in terms of high R&D costs and lengthy product development cycles, are being overcome by strategic collaborations and a focus on developing smarter, more connected VFD solutions.
Variable Frequencies Drives Growth Trends & Insights
The global Variable Frequencies Drives market is on a robust growth trajectory, driven by an escalating demand for energy efficiency and automation. The market size is projected to reach $XX billion by 2033, exhibiting a Compound Annual Growth Rate (CAGR) of approximately 6.8% from 2025 to 2033. This impressive growth is propelled by increasing adoption rates across various industrial sectors that are increasingly prioritizing operational cost reduction and performance optimization. Technological disruptions, particularly in the realm of smart VFDs with integrated IoT capabilities for predictive maintenance and remote monitoring, are revolutionizing how VFDs are deployed and managed. Consumer behavior is shifting towards solutions that offer greater control, flexibility, and sustainability. The increasing focus on Industry 4.0 initiatives and the growing imperative to reduce carbon footprints are further accelerating the market's expansion. Market penetration is deepening, with VFDs becoming standard components in new installations and retrofitting projects. The development of compact, high-power density VFDs and advancements in power electronics are contributing to their wider applicability. Furthermore, the growing electrification of transportation and industrial processes indirectly boosts the demand for VFDs. The emphasis on smart grids and renewable energy integration also necessitates advanced motor control solutions that VFDs provide.
Dominant Regions, Countries, or Segments in Variable Frequencies Drives
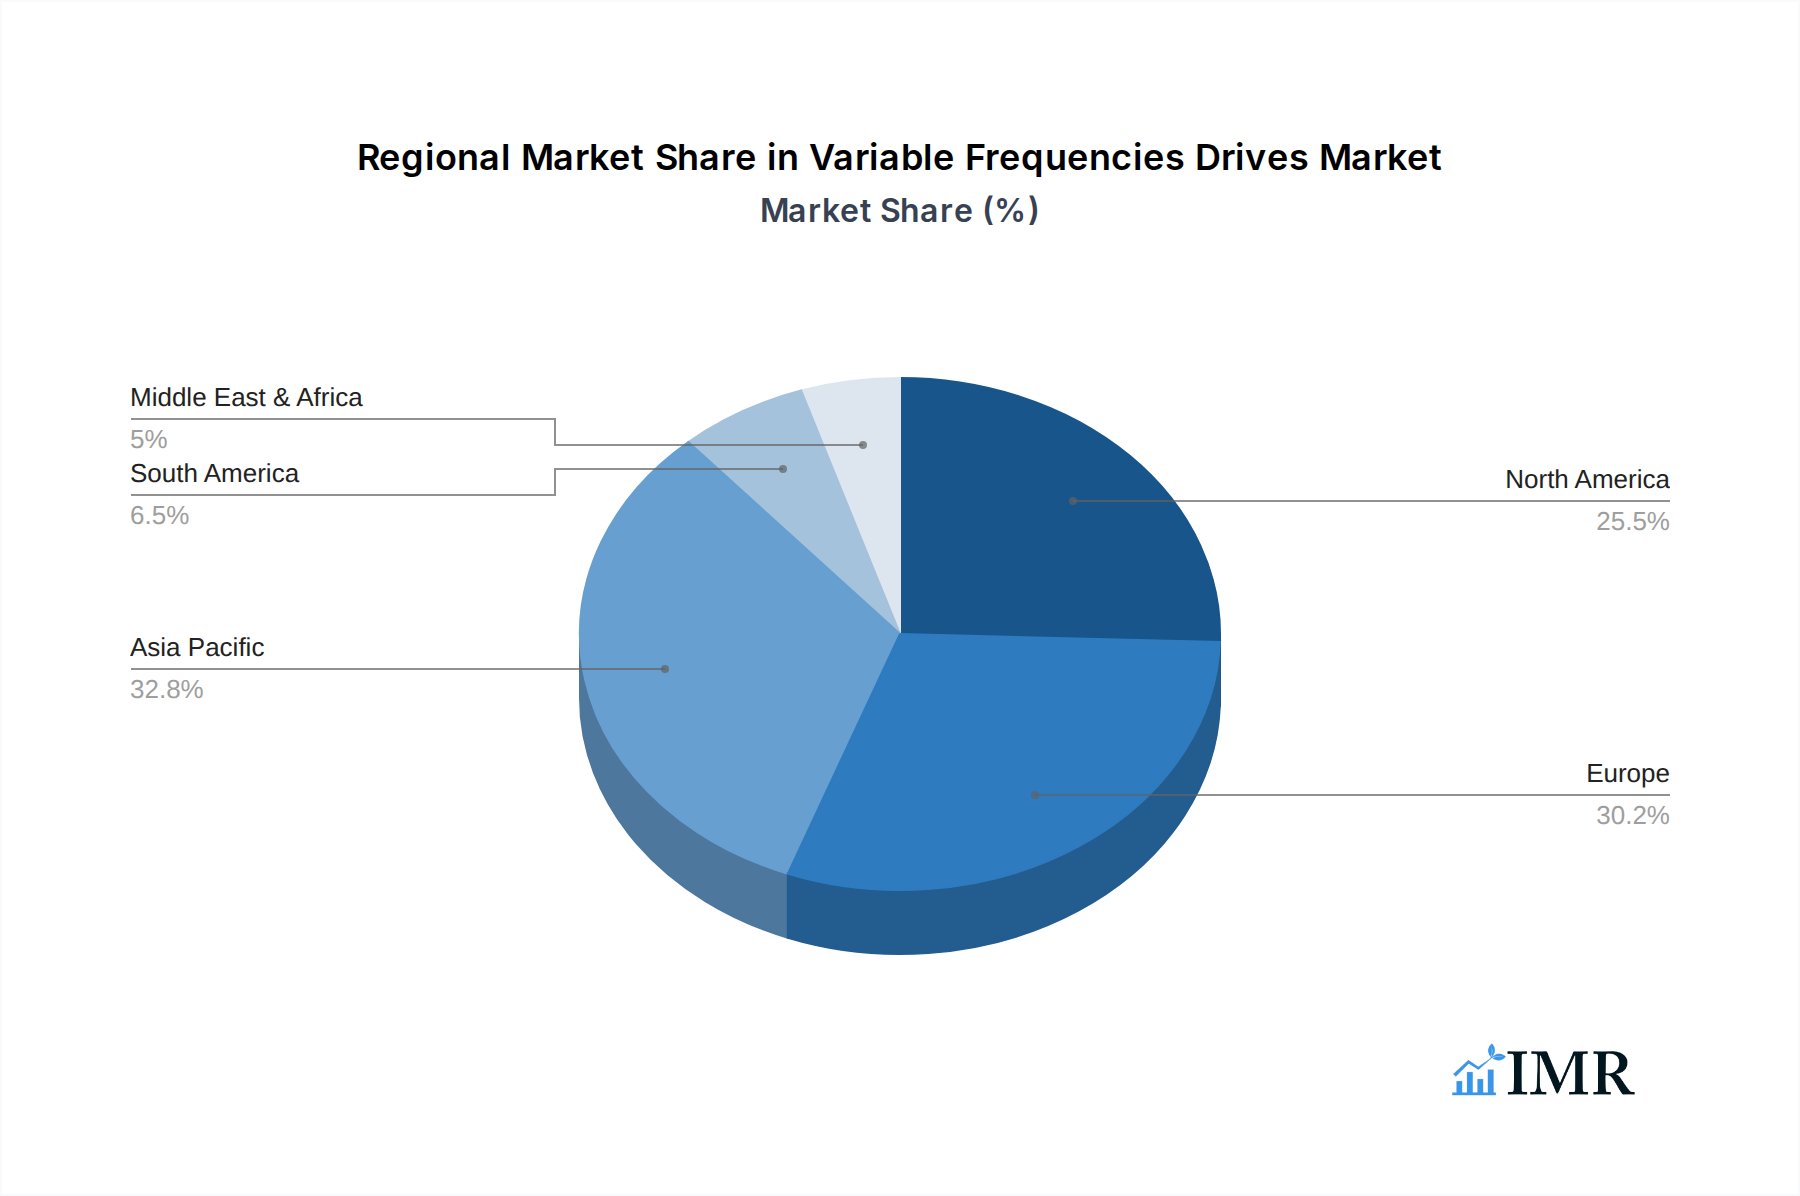
The Asia Pacific region stands out as the dominant force in the global Variable Frequencies Drives market, driven by rapid industrialization, significant investments in infrastructure, and a burgeoning manufacturing sector. Countries like China and India are at the forefront, with their expanding economies and increasing adoption of advanced manufacturing technologies. The application segment of Pumps and Fans collectively represents the largest market share, accounting for an estimated 45% of the total VFD market. This dominance is attributed to their ubiquitous presence in sectors such as water and wastewater treatment, HVAC systems in commercial and residential buildings, and industrial fluid management. The widespread use of pumps and fans in various industrial processes, coupled with the inherent energy-saving potential offered by VFDs in these applications, makes them prime growth areas.
Key Drivers in Asia Pacific:
- Economic Policies: Government initiatives promoting industrial growth, energy conservation, and smart manufacturing.
- Infrastructure Development: Massive investments in power generation, water supply, and transportation infrastructure.
- Manufacturing Hub: Asia Pacific's status as a global manufacturing powerhouse, requiring efficient motor control for diverse industrial applications.
- Growing Urbanization: Increased demand for energy-efficient HVAC systems and water management solutions in rapidly growing cities.
Dominance Factors:
- Market Share: Asia Pacific commands an estimated 40% of the global VFD market share in 2025.
- Growth Potential: Projected CAGR of over 7.5% in the forecast period due to continued industrial expansion and adoption of energy-saving technologies.
- Technological Adoption: Increasing integration of VFDs in both new and existing industrial setups to meet efficiency standards.
The AC Drives type segment is also a major contributor to market growth, holding a substantial market share of approximately 70% due to their versatility and widespread application in industrial motor control.
Variable Frequencies Drives Product Landscape
The Variable Frequencies Drives product landscape is characterized by continuous innovation focused on enhanced energy efficiency, improved control precision, and greater connectivity. Recent product introductions include advanced AC drives with integrated safety features, predictive maintenance capabilities powered by AI, and compact designs for space-constrained applications. Servo drives are witnessing advancements in higher torque density and faster response times, catering to sophisticated automation needs in robotics and precision manufacturing. The emphasis is on developing drives that are not only powerful but also intelligent, capable of communicating with other systems and optimizing performance in real-time. Unique selling propositions revolve around reduced energy consumption, extended equipment lifespan, and seamless integration into Industry 4.0 environments.
Key Drivers, Barriers & Challenges in Variable Frequencies Drives
The Variable Frequencies Drives market is propelled by several key drivers. The paramount driver is the escalating global demand for energy efficiency and the reduction of greenhouse gas emissions, mandated by government regulations and corporate sustainability goals. Advancements in power electronics and digitalization, enabling smarter and more connected VFDs, also fuel growth. The expansion of industrial automation and the adoption of Industry 4.0 principles across manufacturing, infrastructure, and building management are critical growth accelerators.
Challenges, however, persist. High initial investment costs can be a barrier for smaller enterprises. Supply chain disruptions for critical components, particularly semiconductors, can impact production and lead times, as seen in recent global events. Lack of skilled technicians for installation, maintenance, and advanced troubleshooting can also hinder widespread adoption. Cybersecurity concerns related to connected VFDs are emerging as a critical challenge requiring robust security protocols.
Emerging Opportunities in Variable Frequencies Drives
Emerging opportunities lie in the integration of VFDs with the Internet of Things (IoT) and artificial intelligence (AI) for advanced diagnostics, predictive maintenance, and autonomous operation. The growing adoption of renewable energy sources, such as wind and solar power, presents significant opportunities for VFDs in controlling turbines and inverters. The increasing electrification of the transportation sector, particularly in heavy-duty vehicles and industrial machinery, will also drive demand. Furthermore, the development of eco-friendly VFDs utilizing sustainable materials and energy-efficient designs represents a niche but growing market. Untapped markets in developing economies and the retrofitting of older industrial facilities offer substantial growth potential.
Growth Accelerators in the Variable Frequencies Drives Industry
Long-term growth in the Variable Frequencies Drives industry is being significantly accelerated by technological breakthroughs in areas like wide-bandgap semiconductor technology (e.g., Silicon Carbide and Gallium Nitride), leading to smaller, more efficient, and higher-performance drives. Strategic partnerships between VFD manufacturers and automation solution providers are expanding market reach and enabling integrated solutions. Market expansion strategies targeting emerging economies and specialized industrial verticals are also crucial growth catalysts. The continuous drive towards smart grids and the increasing demand for decentralized energy systems further bolster the need for advanced motor control capabilities offered by VFDs.
Key Players Shaping the Variable Frequencies Drives Market
- ABB
- Siemens
- Schneider Electric
- Danfoss
- Rockwell Automation
- WEG
- Yaskawa Electric
- Eaton
- General Electric
- Emerson
- Hitachi
- Honeywell
- Crompton Greaves
- Mitsubishi Electric
- Fuji Electric
- NIDEC
- Invertek Drives
- Johnson Controls
- TMEIC
- Trane (Ingersoll Rand)
- Belden
- Magnetek
- NORD Drivesystems
Notable Milestones in Variable Frequencies Drives Sector
- 2019: Launch of next-generation AC drives with enhanced IoT connectivity and cybersecurity features by major players like Siemens and ABB.
- 2020: Increased adoption of VFDs in HVAC systems for improved energy efficiency in commercial buildings, driven by sustainability mandates.
- 2021: Significant supply chain challenges for semiconductor components impacting VFD production and lead times globally.
- 2022: Growing interest in VFD solutions for electric vehicle charging infrastructure and industrial electrification projects.
- 2023: Release of VFDs utilizing Wide-Bandgap semiconductor technology, offering higher efficiency and smaller form factors.
- Early 2024: Focus on developing AI-powered VFDs for predictive maintenance and autonomous operation across industries.
In-Depth Variable Frequencies Drives Market Outlook
The outlook for the Variable Frequencies Drives market is overwhelmingly positive, driven by a confluence of megatrends. The persistent global imperative for energy conservation and emission reduction will continue to be the primary growth accelerator, making VFDs an indispensable technology. The relentless march of digitalization and Industry 4.0 adoption will further integrate smart, connected VFDs into the fabric of industrial operations, enhancing efficiency and productivity. Strategic partnerships and ongoing technological innovation, especially in power electronics and AI, will unlock new applications and markets. The electrification of various sectors, from transportation to industrial processes, will create sustained demand. Emerging economies are poised to become significant growth engines as they continue to industrialize and prioritize sustainable development. The market is well-positioned for substantial and sustained growth, offering attractive opportunities for innovation and investment.
Variable Frequencies Drives Segmentation
-
1. Application
- 1.1. Pumps
- 1.2. Fans
- 1.3. Compressors
- 1.4. Conveyors
- 1.5. Others
-
2. Types
- 2.1. AC Drives
- 2.2. DC Drives
- 2.3. Servo Drives
Variable Frequencies Drives Segmentation By Geography
-
1. North America
- 1.1. United States
- 1.2. Canada
- 1.3. Mexico
-
2. South America
- 2.1. Brazil
- 2.2. Argentina
- 2.3. Rest of South America
-
3. Europe
- 3.1. United Kingdom
- 3.2. Germany
- 3.3. France
- 3.4. Italy
- 3.5. Spain
- 3.6. Russia
- 3.7. Benelux
- 3.8. Nordics
- 3.9. Rest of Europe
-
4. Middle East & Africa
- 4.1. Turkey
- 4.2. Israel
- 4.3. GCC
- 4.4. North Africa
- 4.5. South Africa
- 4.6. Rest of Middle East & Africa
-
5. Asia Pacific
- 5.1. China
- 5.2. India
- 5.3. Japan
- 5.4. South Korea
- 5.5. ASEAN
- 5.6. Oceania
- 5.7. Rest of Asia Pacific
Variable Frequencies Drives Regional Market Share
Geographic Coverage of Variable Frequencies Drives
Variable Frequencies Drives REPORT HIGHLIGHTS
| Aspects | Details |
|---|---|
| Study Period | 2020-2034 |
| Base Year | 2025 |
| Estimated Year | 2026 |
| Forecast Period | 2026-2034 |
| Historical Period | 2020-2025 |
| Growth Rate | CAGR of 3.7% from 2020-2034 |
| Segmentation |
|
Table of Contents
- 1. Introduction
- 1.1. Research Scope
- 1.2. Market Segmentation
- 1.3. Research Methodology
- 1.4. Definitions and Assumptions
- 2. Executive Summary
- 2.1. Introduction
- 3. Market Dynamics
- 3.1. Introduction
- 3.2. Market Drivers
- 3.3. Market Restrains
- 3.4. Market Trends
- 4. Market Factor Analysis
- 4.1. Porters Five Forces
- 4.2. Supply/Value Chain
- 4.3. PESTEL analysis
- 4.4. Market Entropy
- 4.5. Patent/Trademark Analysis
- 5. Global Variable Frequencies Drives Analysis, Insights and Forecast, 2020-2032
- 5.1. Market Analysis, Insights and Forecast - by Application
- 5.1.1. Pumps
- 5.1.2. Fans
- 5.1.3. Compressors
- 5.1.4. Conveyors
- 5.1.5. Others
- 5.2. Market Analysis, Insights and Forecast - by Types
- 5.2.1. AC Drives
- 5.2.2. DC Drives
- 5.2.3. Servo Drives
- 5.3. Market Analysis, Insights and Forecast - by Region
- 5.3.1. North America
- 5.3.2. South America
- 5.3.3. Europe
- 5.3.4. Middle East & Africa
- 5.3.5. Asia Pacific
- 5.1. Market Analysis, Insights and Forecast - by Application
- 6. North America Variable Frequencies Drives Analysis, Insights and Forecast, 2020-2032
- 6.1. Market Analysis, Insights and Forecast - by Application
- 6.1.1. Pumps
- 6.1.2. Fans
- 6.1.3. Compressors
- 6.1.4. Conveyors
- 6.1.5. Others
- 6.2. Market Analysis, Insights and Forecast - by Types
- 6.2.1. AC Drives
- 6.2.2. DC Drives
- 6.2.3. Servo Drives
- 6.1. Market Analysis, Insights and Forecast - by Application
- 7. South America Variable Frequencies Drives Analysis, Insights and Forecast, 2020-2032
- 7.1. Market Analysis, Insights and Forecast - by Application
- 7.1.1. Pumps
- 7.1.2. Fans
- 7.1.3. Compressors
- 7.1.4. Conveyors
- 7.1.5. Others
- 7.2. Market Analysis, Insights and Forecast - by Types
- 7.2.1. AC Drives
- 7.2.2. DC Drives
- 7.2.3. Servo Drives
- 7.1. Market Analysis, Insights and Forecast - by Application
- 8. Europe Variable Frequencies Drives Analysis, Insights and Forecast, 2020-2032
- 8.1. Market Analysis, Insights and Forecast - by Application
- 8.1.1. Pumps
- 8.1.2. Fans
- 8.1.3. Compressors
- 8.1.4. Conveyors
- 8.1.5. Others
- 8.2. Market Analysis, Insights and Forecast - by Types
- 8.2.1. AC Drives
- 8.2.2. DC Drives
- 8.2.3. Servo Drives
- 8.1. Market Analysis, Insights and Forecast - by Application
- 9. Middle East & Africa Variable Frequencies Drives Analysis, Insights and Forecast, 2020-2032
- 9.1. Market Analysis, Insights and Forecast - by Application
- 9.1.1. Pumps
- 9.1.2. Fans
- 9.1.3. Compressors
- 9.1.4. Conveyors
- 9.1.5. Others
- 9.2. Market Analysis, Insights and Forecast - by Types
- 9.2.1. AC Drives
- 9.2.2. DC Drives
- 9.2.3. Servo Drives
- 9.1. Market Analysis, Insights and Forecast - by Application
- 10. Asia Pacific Variable Frequencies Drives Analysis, Insights and Forecast, 2020-2032
- 10.1. Market Analysis, Insights and Forecast - by Application
- 10.1.1. Pumps
- 10.1.2. Fans
- 10.1.3. Compressors
- 10.1.4. Conveyors
- 10.1.5. Others
- 10.2. Market Analysis, Insights and Forecast - by Types
- 10.2.1. AC Drives
- 10.2.2. DC Drives
- 10.2.3. Servo Drives
- 10.1. Market Analysis, Insights and Forecast - by Application
- 11. Competitive Analysis
- 11.1. Global Market Share Analysis 2025
- 11.2. Company Profiles
- 11.2.1 ABB
- 11.2.1.1. Overview
- 11.2.1.2. Products
- 11.2.1.3. SWOT Analysis
- 11.2.1.4. Recent Developments
- 11.2.1.5. Financials (Based on Availability)
- 11.2.2 Siemens
- 11.2.2.1. Overview
- 11.2.2.2. Products
- 11.2.2.3. SWOT Analysis
- 11.2.2.4. Recent Developments
- 11.2.2.5. Financials (Based on Availability)
- 11.2.3 Schneider Electric
- 11.2.3.1. Overview
- 11.2.3.2. Products
- 11.2.3.3. SWOT Analysis
- 11.2.3.4. Recent Developments
- 11.2.3.5. Financials (Based on Availability)
- 11.2.4 Danfoss
- 11.2.4.1. Overview
- 11.2.4.2. Products
- 11.2.4.3. SWOT Analysis
- 11.2.4.4. Recent Developments
- 11.2.4.5. Financials (Based on Availability)
- 11.2.5 Rockwell Automation
- 11.2.5.1. Overview
- 11.2.5.2. Products
- 11.2.5.3. SWOT Analysis
- 11.2.5.4. Recent Developments
- 11.2.5.5. Financials (Based on Availability)
- 11.2.6 WEG
- 11.2.6.1. Overview
- 11.2.6.2. Products
- 11.2.6.3. SWOT Analysis
- 11.2.6.4. Recent Developments
- 11.2.6.5. Financials (Based on Availability)
- 11.2.7 Yaskawa Electric
- 11.2.7.1. Overview
- 11.2.7.2. Products
- 11.2.7.3. SWOT Analysis
- 11.2.7.4. Recent Developments
- 11.2.7.5. Financials (Based on Availability)
- 11.2.8 Eaton
- 11.2.8.1. Overview
- 11.2.8.2. Products
- 11.2.8.3. SWOT Analysis
- 11.2.8.4. Recent Developments
- 11.2.8.5. Financials (Based on Availability)
- 11.2.9 General Electric
- 11.2.9.1. Overview
- 11.2.9.2. Products
- 11.2.9.3. SWOT Analysis
- 11.2.9.4. Recent Developments
- 11.2.9.5. Financials (Based on Availability)
- 11.2.10 Emerson
- 11.2.10.1. Overview
- 11.2.10.2. Products
- 11.2.10.3. SWOT Analysis
- 11.2.10.4. Recent Developments
- 11.2.10.5. Financials (Based on Availability)
- 11.2.11 Hitachi
- 11.2.11.1. Overview
- 11.2.11.2. Products
- 11.2.11.3. SWOT Analysis
- 11.2.11.4. Recent Developments
- 11.2.11.5. Financials (Based on Availability)
- 11.2.12 Honeywell
- 11.2.12.1. Overview
- 11.2.12.2. Products
- 11.2.12.3. SWOT Analysis
- 11.2.12.4. Recent Developments
- 11.2.12.5. Financials (Based on Availability)
- 11.2.13 Crompton Greaves
- 11.2.13.1. Overview
- 11.2.13.2. Products
- 11.2.13.3. SWOT Analysis
- 11.2.13.4. Recent Developments
- 11.2.13.5. Financials (Based on Availability)
- 11.2.14 Mitsubishi Electric
- 11.2.14.1. Overview
- 11.2.14.2. Products
- 11.2.14.3. SWOT Analysis
- 11.2.14.4. Recent Developments
- 11.2.14.5. Financials (Based on Availability)
- 11.2.15 Fuji Electric
- 11.2.15.1. Overview
- 11.2.15.2. Products
- 11.2.15.3. SWOT Analysis
- 11.2.15.4. Recent Developments
- 11.2.15.5. Financials (Based on Availability)
- 11.2.16 NIDEC
- 11.2.16.1. Overview
- 11.2.16.2. Products
- 11.2.16.3. SWOT Analysis
- 11.2.16.4. Recent Developments
- 11.2.16.5. Financials (Based on Availability)
- 11.2.17 Invertek Drives
- 11.2.17.1. Overview
- 11.2.17.2. Products
- 11.2.17.3. SWOT Analysis
- 11.2.17.4. Recent Developments
- 11.2.17.5. Financials (Based on Availability)
- 11.2.18 Johnson Controls
- 11.2.18.1. Overview
- 11.2.18.2. Products
- 11.2.18.3. SWOT Analysis
- 11.2.18.4. Recent Developments
- 11.2.18.5. Financials (Based on Availability)
- 11.2.19 TMEIC
- 11.2.19.1. Overview
- 11.2.19.2. Products
- 11.2.19.3. SWOT Analysis
- 11.2.19.4. Recent Developments
- 11.2.19.5. Financials (Based on Availability)
- 11.2.20 Trane (Ingersoll Rand)
- 11.2.20.1. Overview
- 11.2.20.2. Products
- 11.2.20.3. SWOT Analysis
- 11.2.20.4. Recent Developments
- 11.2.20.5. Financials (Based on Availability)
- 11.2.21 Belden
- 11.2.21.1. Overview
- 11.2.21.2. Products
- 11.2.21.3. SWOT Analysis
- 11.2.21.4. Recent Developments
- 11.2.21.5. Financials (Based on Availability)
- 11.2.22 Magnetek
- 11.2.22.1. Overview
- 11.2.22.2. Products
- 11.2.22.3. SWOT Analysis
- 11.2.22.4. Recent Developments
- 11.2.22.5. Financials (Based on Availability)
- 11.2.23 NORD Drivesystems
- 11.2.23.1. Overview
- 11.2.23.2. Products
- 11.2.23.3. SWOT Analysis
- 11.2.23.4. Recent Developments
- 11.2.23.5. Financials (Based on Availability)
- 11.2.1 ABB
List of Figures
- Figure 1: Global Variable Frequencies Drives Revenue Breakdown (billion, %) by Region 2025 & 2033
- Figure 2: Global Variable Frequencies Drives Volume Breakdown (K, %) by Region 2025 & 2033
- Figure 3: North America Variable Frequencies Drives Revenue (billion), by Application 2025 & 2033
- Figure 4: North America Variable Frequencies Drives Volume (K), by Application 2025 & 2033
- Figure 5: North America Variable Frequencies Drives Revenue Share (%), by Application 2025 & 2033
- Figure 6: North America Variable Frequencies Drives Volume Share (%), by Application 2025 & 2033
- Figure 7: North America Variable Frequencies Drives Revenue (billion), by Types 2025 & 2033
- Figure 8: North America Variable Frequencies Drives Volume (K), by Types 2025 & 2033
- Figure 9: North America Variable Frequencies Drives Revenue Share (%), by Types 2025 & 2033
- Figure 10: North America Variable Frequencies Drives Volume Share (%), by Types 2025 & 2033
- Figure 11: North America Variable Frequencies Drives Revenue (billion), by Country 2025 & 2033
- Figure 12: North America Variable Frequencies Drives Volume (K), by Country 2025 & 2033
- Figure 13: North America Variable Frequencies Drives Revenue Share (%), by Country 2025 & 2033
- Figure 14: North America Variable Frequencies Drives Volume Share (%), by Country 2025 & 2033
- Figure 15: South America Variable Frequencies Drives Revenue (billion), by Application 2025 & 2033
- Figure 16: South America Variable Frequencies Drives Volume (K), by Application 2025 & 2033
- Figure 17: South America Variable Frequencies Drives Revenue Share (%), by Application 2025 & 2033
- Figure 18: South America Variable Frequencies Drives Volume Share (%), by Application 2025 & 2033
- Figure 19: South America Variable Frequencies Drives Revenue (billion), by Types 2025 & 2033
- Figure 20: South America Variable Frequencies Drives Volume (K), by Types 2025 & 2033
- Figure 21: South America Variable Frequencies Drives Revenue Share (%), by Types 2025 & 2033
- Figure 22: South America Variable Frequencies Drives Volume Share (%), by Types 2025 & 2033
- Figure 23: South America Variable Frequencies Drives Revenue (billion), by Country 2025 & 2033
- Figure 24: South America Variable Frequencies Drives Volume (K), by Country 2025 & 2033
- Figure 25: South America Variable Frequencies Drives Revenue Share (%), by Country 2025 & 2033
- Figure 26: South America Variable Frequencies Drives Volume Share (%), by Country 2025 & 2033
- Figure 27: Europe Variable Frequencies Drives Revenue (billion), by Application 2025 & 2033
- Figure 28: Europe Variable Frequencies Drives Volume (K), by Application 2025 & 2033
- Figure 29: Europe Variable Frequencies Drives Revenue Share (%), by Application 2025 & 2033
- Figure 30: Europe Variable Frequencies Drives Volume Share (%), by Application 2025 & 2033
- Figure 31: Europe Variable Frequencies Drives Revenue (billion), by Types 2025 & 2033
- Figure 32: Europe Variable Frequencies Drives Volume (K), by Types 2025 & 2033
- Figure 33: Europe Variable Frequencies Drives Revenue Share (%), by Types 2025 & 2033
- Figure 34: Europe Variable Frequencies Drives Volume Share (%), by Types 2025 & 2033
- Figure 35: Europe Variable Frequencies Drives Revenue (billion), by Country 2025 & 2033
- Figure 36: Europe Variable Frequencies Drives Volume (K), by Country 2025 & 2033
- Figure 37: Europe Variable Frequencies Drives Revenue Share (%), by Country 2025 & 2033
- Figure 38: Europe Variable Frequencies Drives Volume Share (%), by Country 2025 & 2033
- Figure 39: Middle East & Africa Variable Frequencies Drives Revenue (billion), by Application 2025 & 2033
- Figure 40: Middle East & Africa Variable Frequencies Drives Volume (K), by Application 2025 & 2033
- Figure 41: Middle East & Africa Variable Frequencies Drives Revenue Share (%), by Application 2025 & 2033
- Figure 42: Middle East & Africa Variable Frequencies Drives Volume Share (%), by Application 2025 & 2033
- Figure 43: Middle East & Africa Variable Frequencies Drives Revenue (billion), by Types 2025 & 2033
- Figure 44: Middle East & Africa Variable Frequencies Drives Volume (K), by Types 2025 & 2033
- Figure 45: Middle East & Africa Variable Frequencies Drives Revenue Share (%), by Types 2025 & 2033
- Figure 46: Middle East & Africa Variable Frequencies Drives Volume Share (%), by Types 2025 & 2033
- Figure 47: Middle East & Africa Variable Frequencies Drives Revenue (billion), by Country 2025 & 2033
- Figure 48: Middle East & Africa Variable Frequencies Drives Volume (K), by Country 2025 & 2033
- Figure 49: Middle East & Africa Variable Frequencies Drives Revenue Share (%), by Country 2025 & 2033
- Figure 50: Middle East & Africa Variable Frequencies Drives Volume Share (%), by Country 2025 & 2033
- Figure 51: Asia Pacific Variable Frequencies Drives Revenue (billion), by Application 2025 & 2033
- Figure 52: Asia Pacific Variable Frequencies Drives Volume (K), by Application 2025 & 2033
- Figure 53: Asia Pacific Variable Frequencies Drives Revenue Share (%), by Application 2025 & 2033
- Figure 54: Asia Pacific Variable Frequencies Drives Volume Share (%), by Application 2025 & 2033
- Figure 55: Asia Pacific Variable Frequencies Drives Revenue (billion), by Types 2025 & 2033
- Figure 56: Asia Pacific Variable Frequencies Drives Volume (K), by Types 2025 & 2033
- Figure 57: Asia Pacific Variable Frequencies Drives Revenue Share (%), by Types 2025 & 2033
- Figure 58: Asia Pacific Variable Frequencies Drives Volume Share (%), by Types 2025 & 2033
- Figure 59: Asia Pacific Variable Frequencies Drives Revenue (billion), by Country 2025 & 2033
- Figure 60: Asia Pacific Variable Frequencies Drives Volume (K), by Country 2025 & 2033
- Figure 61: Asia Pacific Variable Frequencies Drives Revenue Share (%), by Country 2025 & 2033
- Figure 62: Asia Pacific Variable Frequencies Drives Volume Share (%), by Country 2025 & 2033
List of Tables
- Table 1: Global Variable Frequencies Drives Revenue billion Forecast, by Application 2020 & 2033
- Table 2: Global Variable Frequencies Drives Volume K Forecast, by Application 2020 & 2033
- Table 3: Global Variable Frequencies Drives Revenue billion Forecast, by Types 2020 & 2033
- Table 4: Global Variable Frequencies Drives Volume K Forecast, by Types 2020 & 2033
- Table 5: Global Variable Frequencies Drives Revenue billion Forecast, by Region 2020 & 2033
- Table 6: Global Variable Frequencies Drives Volume K Forecast, by Region 2020 & 2033
- Table 7: Global Variable Frequencies Drives Revenue billion Forecast, by Application 2020 & 2033
- Table 8: Global Variable Frequencies Drives Volume K Forecast, by Application 2020 & 2033
- Table 9: Global Variable Frequencies Drives Revenue billion Forecast, by Types 2020 & 2033
- Table 10: Global Variable Frequencies Drives Volume K Forecast, by Types 2020 & 2033
- Table 11: Global Variable Frequencies Drives Revenue billion Forecast, by Country 2020 & 2033
- Table 12: Global Variable Frequencies Drives Volume K Forecast, by Country 2020 & 2033
- Table 13: United States Variable Frequencies Drives Revenue (billion) Forecast, by Application 2020 & 2033
- Table 14: United States Variable Frequencies Drives Volume (K) Forecast, by Application 2020 & 2033
- Table 15: Canada Variable Frequencies Drives Revenue (billion) Forecast, by Application 2020 & 2033
- Table 16: Canada Variable Frequencies Drives Volume (K) Forecast, by Application 2020 & 2033
- Table 17: Mexico Variable Frequencies Drives Revenue (billion) Forecast, by Application 2020 & 2033
- Table 18: Mexico Variable Frequencies Drives Volume (K) Forecast, by Application 2020 & 2033
- Table 19: Global Variable Frequencies Drives Revenue billion Forecast, by Application 2020 & 2033
- Table 20: Global Variable Frequencies Drives Volume K Forecast, by Application 2020 & 2033
- Table 21: Global Variable Frequencies Drives Revenue billion Forecast, by Types 2020 & 2033
- Table 22: Global Variable Frequencies Drives Volume K Forecast, by Types 2020 & 2033
- Table 23: Global Variable Frequencies Drives Revenue billion Forecast, by Country 2020 & 2033
- Table 24: Global Variable Frequencies Drives Volume K Forecast, by Country 2020 & 2033
- Table 25: Brazil Variable Frequencies Drives Revenue (billion) Forecast, by Application 2020 & 2033
- Table 26: Brazil Variable Frequencies Drives Volume (K) Forecast, by Application 2020 & 2033
- Table 27: Argentina Variable Frequencies Drives Revenue (billion) Forecast, by Application 2020 & 2033
- Table 28: Argentina Variable Frequencies Drives Volume (K) Forecast, by Application 2020 & 2033
- Table 29: Rest of South America Variable Frequencies Drives Revenue (billion) Forecast, by Application 2020 & 2033
- Table 30: Rest of South America Variable Frequencies Drives Volume (K) Forecast, by Application 2020 & 2033
- Table 31: Global Variable Frequencies Drives Revenue billion Forecast, by Application 2020 & 2033
- Table 32: Global Variable Frequencies Drives Volume K Forecast, by Application 2020 & 2033
- Table 33: Global Variable Frequencies Drives Revenue billion Forecast, by Types 2020 & 2033
- Table 34: Global Variable Frequencies Drives Volume K Forecast, by Types 2020 & 2033
- Table 35: Global Variable Frequencies Drives Revenue billion Forecast, by Country 2020 & 2033
- Table 36: Global Variable Frequencies Drives Volume K Forecast, by Country 2020 & 2033
- Table 37: United Kingdom Variable Frequencies Drives Revenue (billion) Forecast, by Application 2020 & 2033
- Table 38: United Kingdom Variable Frequencies Drives Volume (K) Forecast, by Application 2020 & 2033
- Table 39: Germany Variable Frequencies Drives Revenue (billion) Forecast, by Application 2020 & 2033
- Table 40: Germany Variable Frequencies Drives Volume (K) Forecast, by Application 2020 & 2033
- Table 41: France Variable Frequencies Drives Revenue (billion) Forecast, by Application 2020 & 2033
- Table 42: France Variable Frequencies Drives Volume (K) Forecast, by Application 2020 & 2033
- Table 43: Italy Variable Frequencies Drives Revenue (billion) Forecast, by Application 2020 & 2033
- Table 44: Italy Variable Frequencies Drives Volume (K) Forecast, by Application 2020 & 2033
- Table 45: Spain Variable Frequencies Drives Revenue (billion) Forecast, by Application 2020 & 2033
- Table 46: Spain Variable Frequencies Drives Volume (K) Forecast, by Application 2020 & 2033
- Table 47: Russia Variable Frequencies Drives Revenue (billion) Forecast, by Application 2020 & 2033
- Table 48: Russia Variable Frequencies Drives Volume (K) Forecast, by Application 2020 & 2033
- Table 49: Benelux Variable Frequencies Drives Revenue (billion) Forecast, by Application 2020 & 2033
- Table 50: Benelux Variable Frequencies Drives Volume (K) Forecast, by Application 2020 & 2033
- Table 51: Nordics Variable Frequencies Drives Revenue (billion) Forecast, by Application 2020 & 2033
- Table 52: Nordics Variable Frequencies Drives Volume (K) Forecast, by Application 2020 & 2033
- Table 53: Rest of Europe Variable Frequencies Drives Revenue (billion) Forecast, by Application 2020 & 2033
- Table 54: Rest of Europe Variable Frequencies Drives Volume (K) Forecast, by Application 2020 & 2033
- Table 55: Global Variable Frequencies Drives Revenue billion Forecast, by Application 2020 & 2033
- Table 56: Global Variable Frequencies Drives Volume K Forecast, by Application 2020 & 2033
- Table 57: Global Variable Frequencies Drives Revenue billion Forecast, by Types 2020 & 2033
- Table 58: Global Variable Frequencies Drives Volume K Forecast, by Types 2020 & 2033
- Table 59: Global Variable Frequencies Drives Revenue billion Forecast, by Country 2020 & 2033
- Table 60: Global Variable Frequencies Drives Volume K Forecast, by Country 2020 & 2033
- Table 61: Turkey Variable Frequencies Drives Revenue (billion) Forecast, by Application 2020 & 2033
- Table 62: Turkey Variable Frequencies Drives Volume (K) Forecast, by Application 2020 & 2033
- Table 63: Israel Variable Frequencies Drives Revenue (billion) Forecast, by Application 2020 & 2033
- Table 64: Israel Variable Frequencies Drives Volume (K) Forecast, by Application 2020 & 2033
- Table 65: GCC Variable Frequencies Drives Revenue (billion) Forecast, by Application 2020 & 2033
- Table 66: GCC Variable Frequencies Drives Volume (K) Forecast, by Application 2020 & 2033
- Table 67: North Africa Variable Frequencies Drives Revenue (billion) Forecast, by Application 2020 & 2033
- Table 68: North Africa Variable Frequencies Drives Volume (K) Forecast, by Application 2020 & 2033
- Table 69: South Africa Variable Frequencies Drives Revenue (billion) Forecast, by Application 2020 & 2033
- Table 70: South Africa Variable Frequencies Drives Volume (K) Forecast, by Application 2020 & 2033
- Table 71: Rest of Middle East & Africa Variable Frequencies Drives Revenue (billion) Forecast, by Application 2020 & 2033
- Table 72: Rest of Middle East & Africa Variable Frequencies Drives Volume (K) Forecast, by Application 2020 & 2033
- Table 73: Global Variable Frequencies Drives Revenue billion Forecast, by Application 2020 & 2033
- Table 74: Global Variable Frequencies Drives Volume K Forecast, by Application 2020 & 2033
- Table 75: Global Variable Frequencies Drives Revenue billion Forecast, by Types 2020 & 2033
- Table 76: Global Variable Frequencies Drives Volume K Forecast, by Types 2020 & 2033
- Table 77: Global Variable Frequencies Drives Revenue billion Forecast, by Country 2020 & 2033
- Table 78: Global Variable Frequencies Drives Volume K Forecast, by Country 2020 & 2033
- Table 79: China Variable Frequencies Drives Revenue (billion) Forecast, by Application 2020 & 2033
- Table 80: China Variable Frequencies Drives Volume (K) Forecast, by Application 2020 & 2033
- Table 81: India Variable Frequencies Drives Revenue (billion) Forecast, by Application 2020 & 2033
- Table 82: India Variable Frequencies Drives Volume (K) Forecast, by Application 2020 & 2033
- Table 83: Japan Variable Frequencies Drives Revenue (billion) Forecast, by Application 2020 & 2033
- Table 84: Japan Variable Frequencies Drives Volume (K) Forecast, by Application 2020 & 2033
- Table 85: South Korea Variable Frequencies Drives Revenue (billion) Forecast, by Application 2020 & 2033
- Table 86: South Korea Variable Frequencies Drives Volume (K) Forecast, by Application 2020 & 2033
- Table 87: ASEAN Variable Frequencies Drives Revenue (billion) Forecast, by Application 2020 & 2033
- Table 88: ASEAN Variable Frequencies Drives Volume (K) Forecast, by Application 2020 & 2033
- Table 89: Oceania Variable Frequencies Drives Revenue (billion) Forecast, by Application 2020 & 2033
- Table 90: Oceania Variable Frequencies Drives Volume (K) Forecast, by Application 2020 & 2033
- Table 91: Rest of Asia Pacific Variable Frequencies Drives Revenue (billion) Forecast, by Application 2020 & 2033
- Table 92: Rest of Asia Pacific Variable Frequencies Drives Volume (K) Forecast, by Application 2020 & 2033
Frequently Asked Questions
1. What is the projected Compound Annual Growth Rate (CAGR) of the Variable Frequencies Drives?
The projected CAGR is approximately 3.7%.
2. Which companies are prominent players in the Variable Frequencies Drives?
Key companies in the market include ABB, Siemens, Schneider Electric, Danfoss, Rockwell Automation, WEG, Yaskawa Electric, Eaton, General Electric, Emerson, Hitachi, Honeywell, Crompton Greaves, Mitsubishi Electric, Fuji Electric, NIDEC, Invertek Drives, Johnson Controls, TMEIC, Trane (Ingersoll Rand), Belden, Magnetek, NORD Drivesystems.
3. What are the main segments of the Variable Frequencies Drives?
The market segments include Application, Types.
4. Can you provide details about the market size?
The market size is estimated to be USD 4.7 billion as of 2022.
5. What are some drivers contributing to market growth?
N/A
6. What are the notable trends driving market growth?
N/A
7. Are there any restraints impacting market growth?
N/A
8. Can you provide examples of recent developments in the market?
N/A
9. What pricing options are available for accessing the report?
Pricing options include single-user, multi-user, and enterprise licenses priced at USD 3350.00, USD 5025.00, and USD 6700.00 respectively.
10. Is the market size provided in terms of value or volume?
The market size is provided in terms of value, measured in billion and volume, measured in K.
11. Are there any specific market keywords associated with the report?
Yes, the market keyword associated with the report is "Variable Frequencies Drives," which aids in identifying and referencing the specific market segment covered.
12. How do I determine which pricing option suits my needs best?
The pricing options vary based on user requirements and access needs. Individual users may opt for single-user licenses, while businesses requiring broader access may choose multi-user or enterprise licenses for cost-effective access to the report.
13. Are there any additional resources or data provided in the Variable Frequencies Drives report?
While the report offers comprehensive insights, it's advisable to review the specific contents or supplementary materials provided to ascertain if additional resources or data are available.
14. How can I stay updated on further developments or reports in the Variable Frequencies Drives?
To stay informed about further developments, trends, and reports in the Variable Frequencies Drives, consider subscribing to industry newsletters, following relevant companies and organizations, or regularly checking reputable industry news sources and publications.
Methodology
Step 1 - Identification of Relevant Samples Size from Population Database


Step 2 - Approaches for Defining Global Market Size (Value, Volume* & Price*)

Note*: In applicable scenarios
Step 3 - Data Sources
Primary Research
- Web Analytics
- Survey Reports
- Research Institute
- Latest Research Reports
- Opinion Leaders
Secondary Research
- Annual Reports
- White Paper
- Latest Press Release
- Industry Association
- Paid Database
- Investor Presentations

Step 4 - Data Triangulation
Involves using different sources of information in order to increase the validity of a study
These sources are likely to be stakeholders in a program - participants, other researchers, program staff, other community members, and so on.
Then we put all data in single framework & apply various statistical tools to find out the dynamic on the market.
During the analysis stage, feedback from the stakeholder groups would be compared to determine areas of agreement as well as areas of divergence